





We Didn't Design One Prop Card. We Designed the System That Builds It for Each User.






Written for Product designers and PMs building data-dense analytics tools for casual or semi-expert users.
StatKing's founder chose Flatstudio partly because of how the studio works, not just what it had already shipped. Every Flatstudio engagement starts from the client's own problem, not a template carried over from the last similar project — the same principle whether it's our first sports product or our fifth.
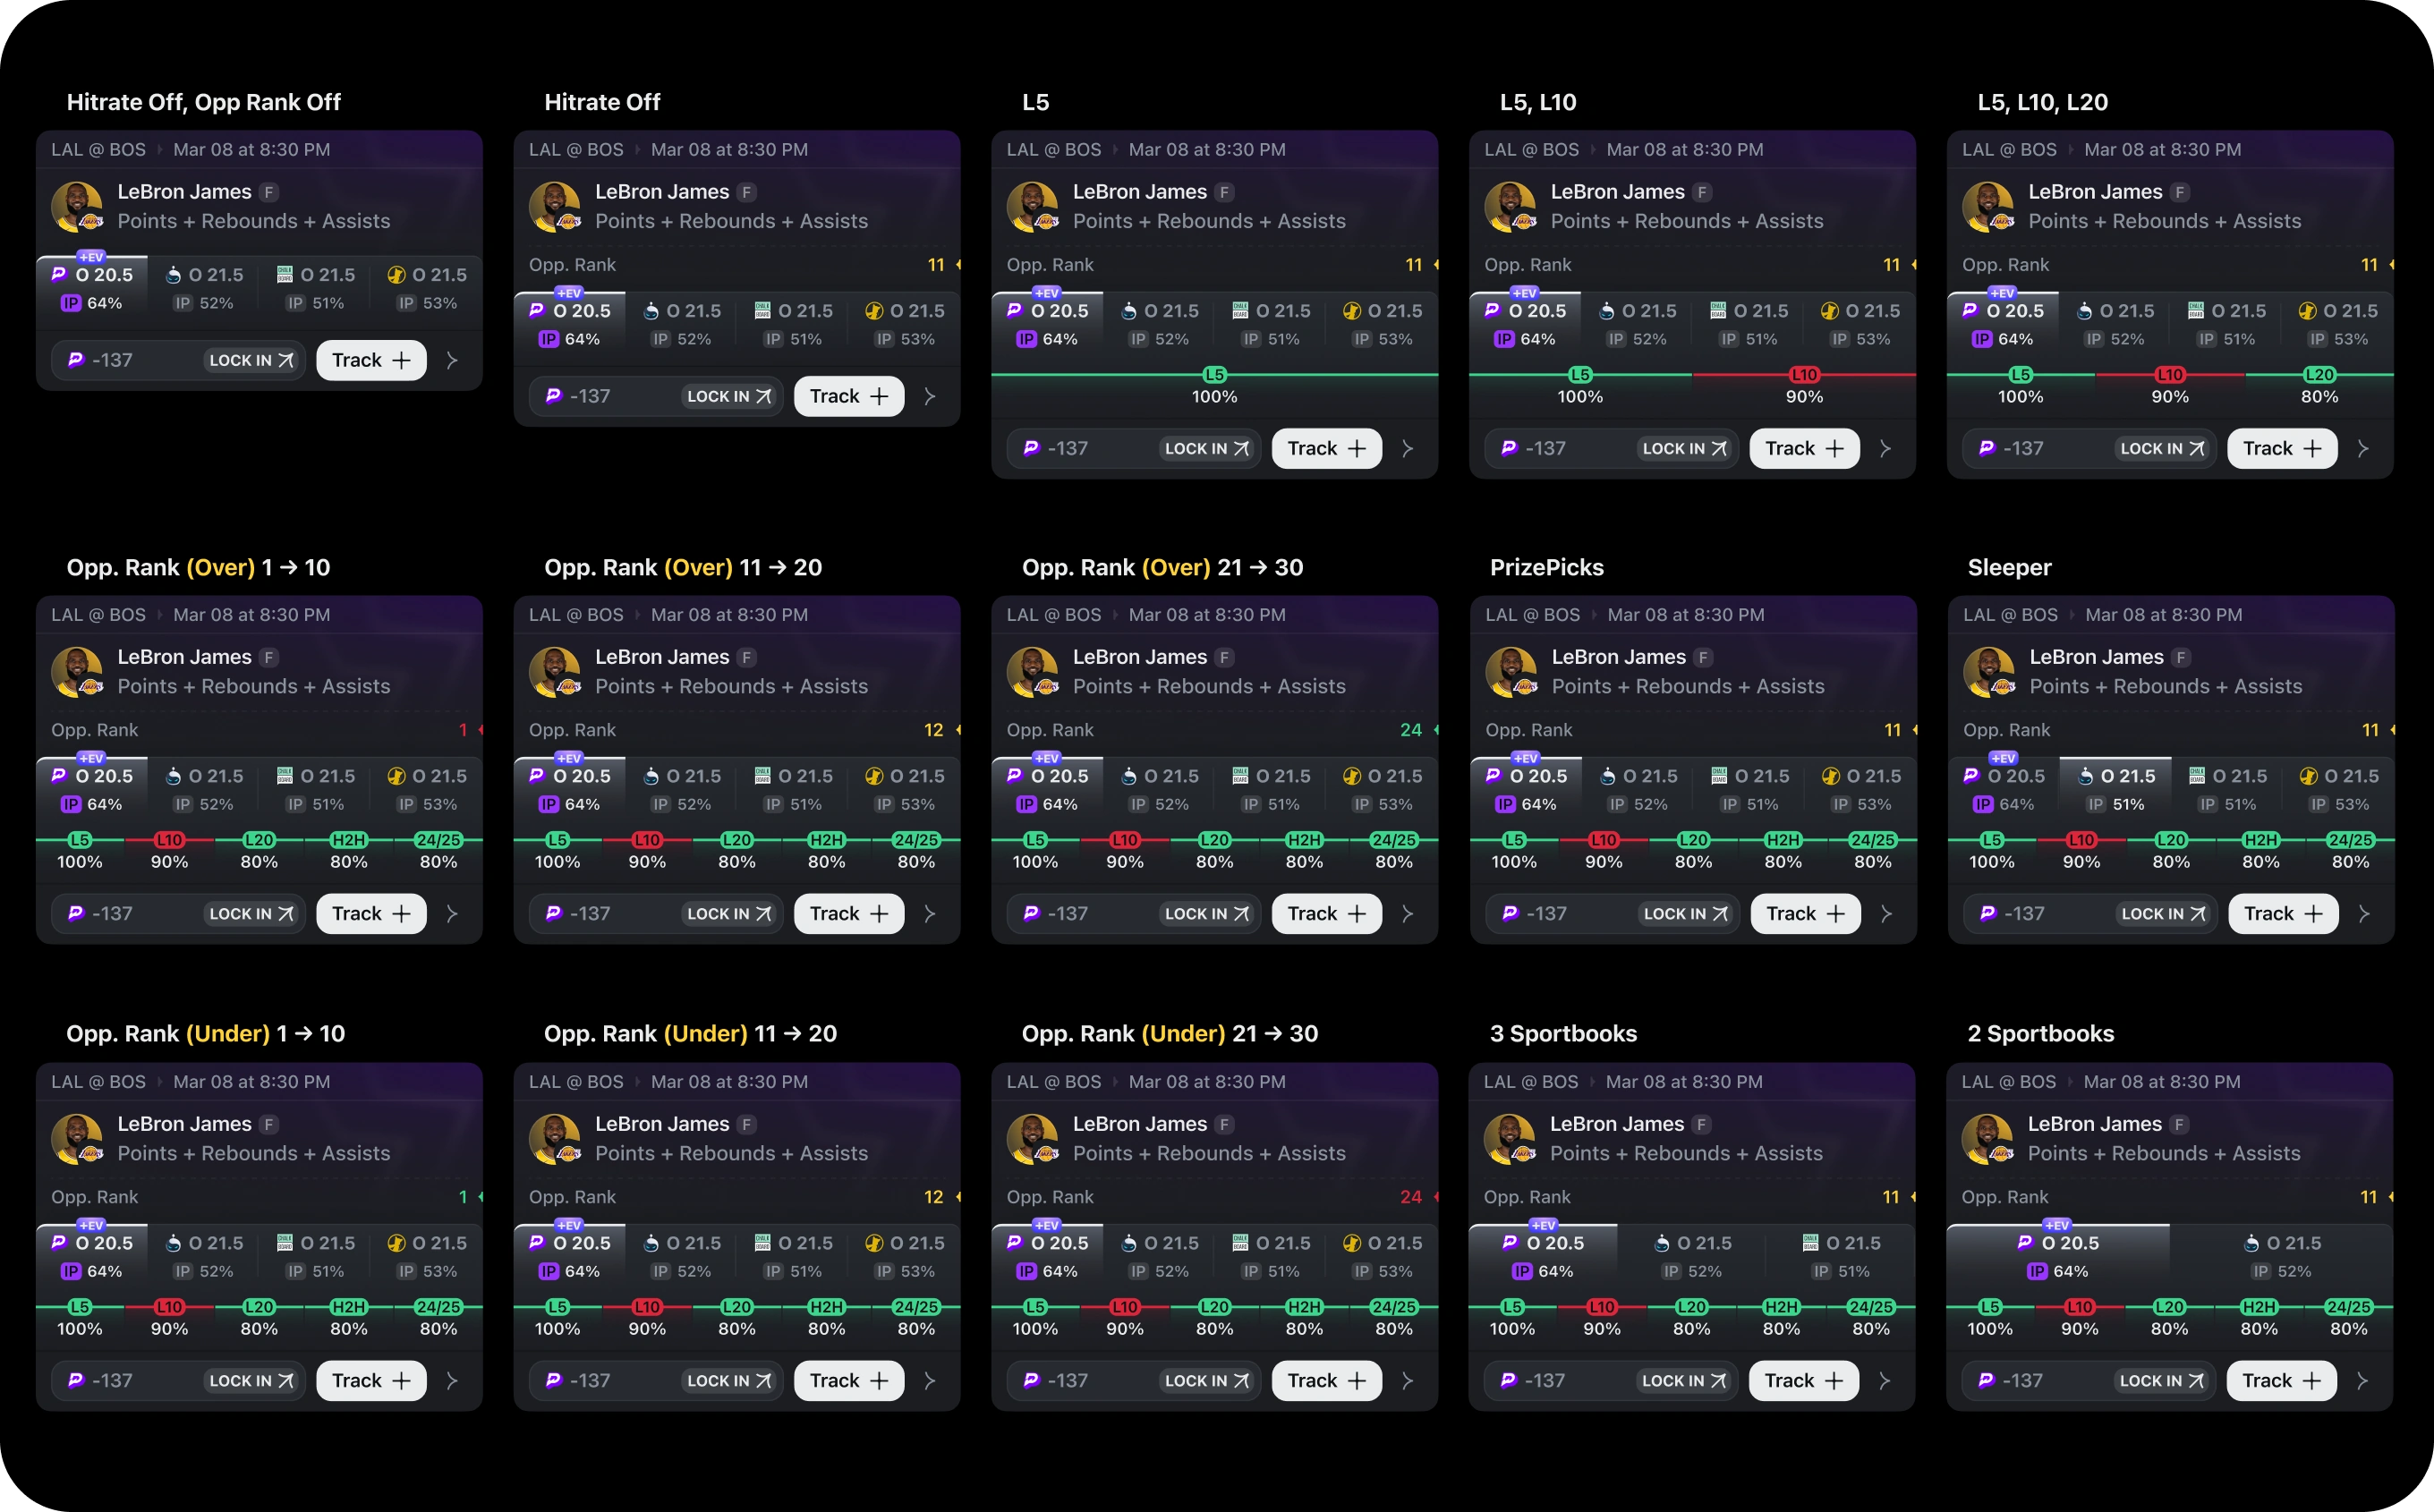
That expectation set the real design problem from day one: how do you fit hit rate, opposing-team stats, and odds from up to nine sportsbooks onto one mobile card — without it turning into a spreadsheet?
The Brief Was Four Sports and Everything, All at Once
The initial brief covered iOS, a web app, and full branding, spanning basketball, American football, soccer, and baseball, each with its own stat models and data density. Delivered as one simultaneous build, that scope would have blown both the timeline and the budget before a single screen shipped.
We split it. Product design, brand identity, and platform builds ran in parallel tracks instead of one sequential pipeline — a structure Marharyta Korovina, running the project, put in place specifically so sport coverage could be staged without stalling the other tracks. NBA shipped first, other leagues after launch, so the team could validate the core prop card pattern on one sport before expanding to more.
The One-Look Constraint
The prop card had to answer a bettor's real question — is this a good bet or not — from a single glance, using hit rate, opposing team rank, injury status, and odds across multiple sportsbooks at once.
Cramming all of that onto a mobile card without turning it into a data dump meant treating every stat as optional, not mandatory. Not every bettor cares about opponent rank. Not every bettor wants implied probability displayed as a percentage. So instead of designing one fixed card, we designed a card that reconfigures itself per user.
Letting Users Rebuild the Card Themselves
StatKing's Customization panel lets a bettor toggle Injuries, Matchup Opposing Ranking, Implied Probability, and Hit Rate on or off individually — and for Hit Rate specifically, choose which windows to show: L5, L10, L20, head-to-head, current season, or all of them at once.
That configuration locks in per sport and persists until the user changes it again. A baseball bettor who only cares about L10 hit rate and ignores opposing rank sees exactly that, every time, without re-configuring the screen each session.
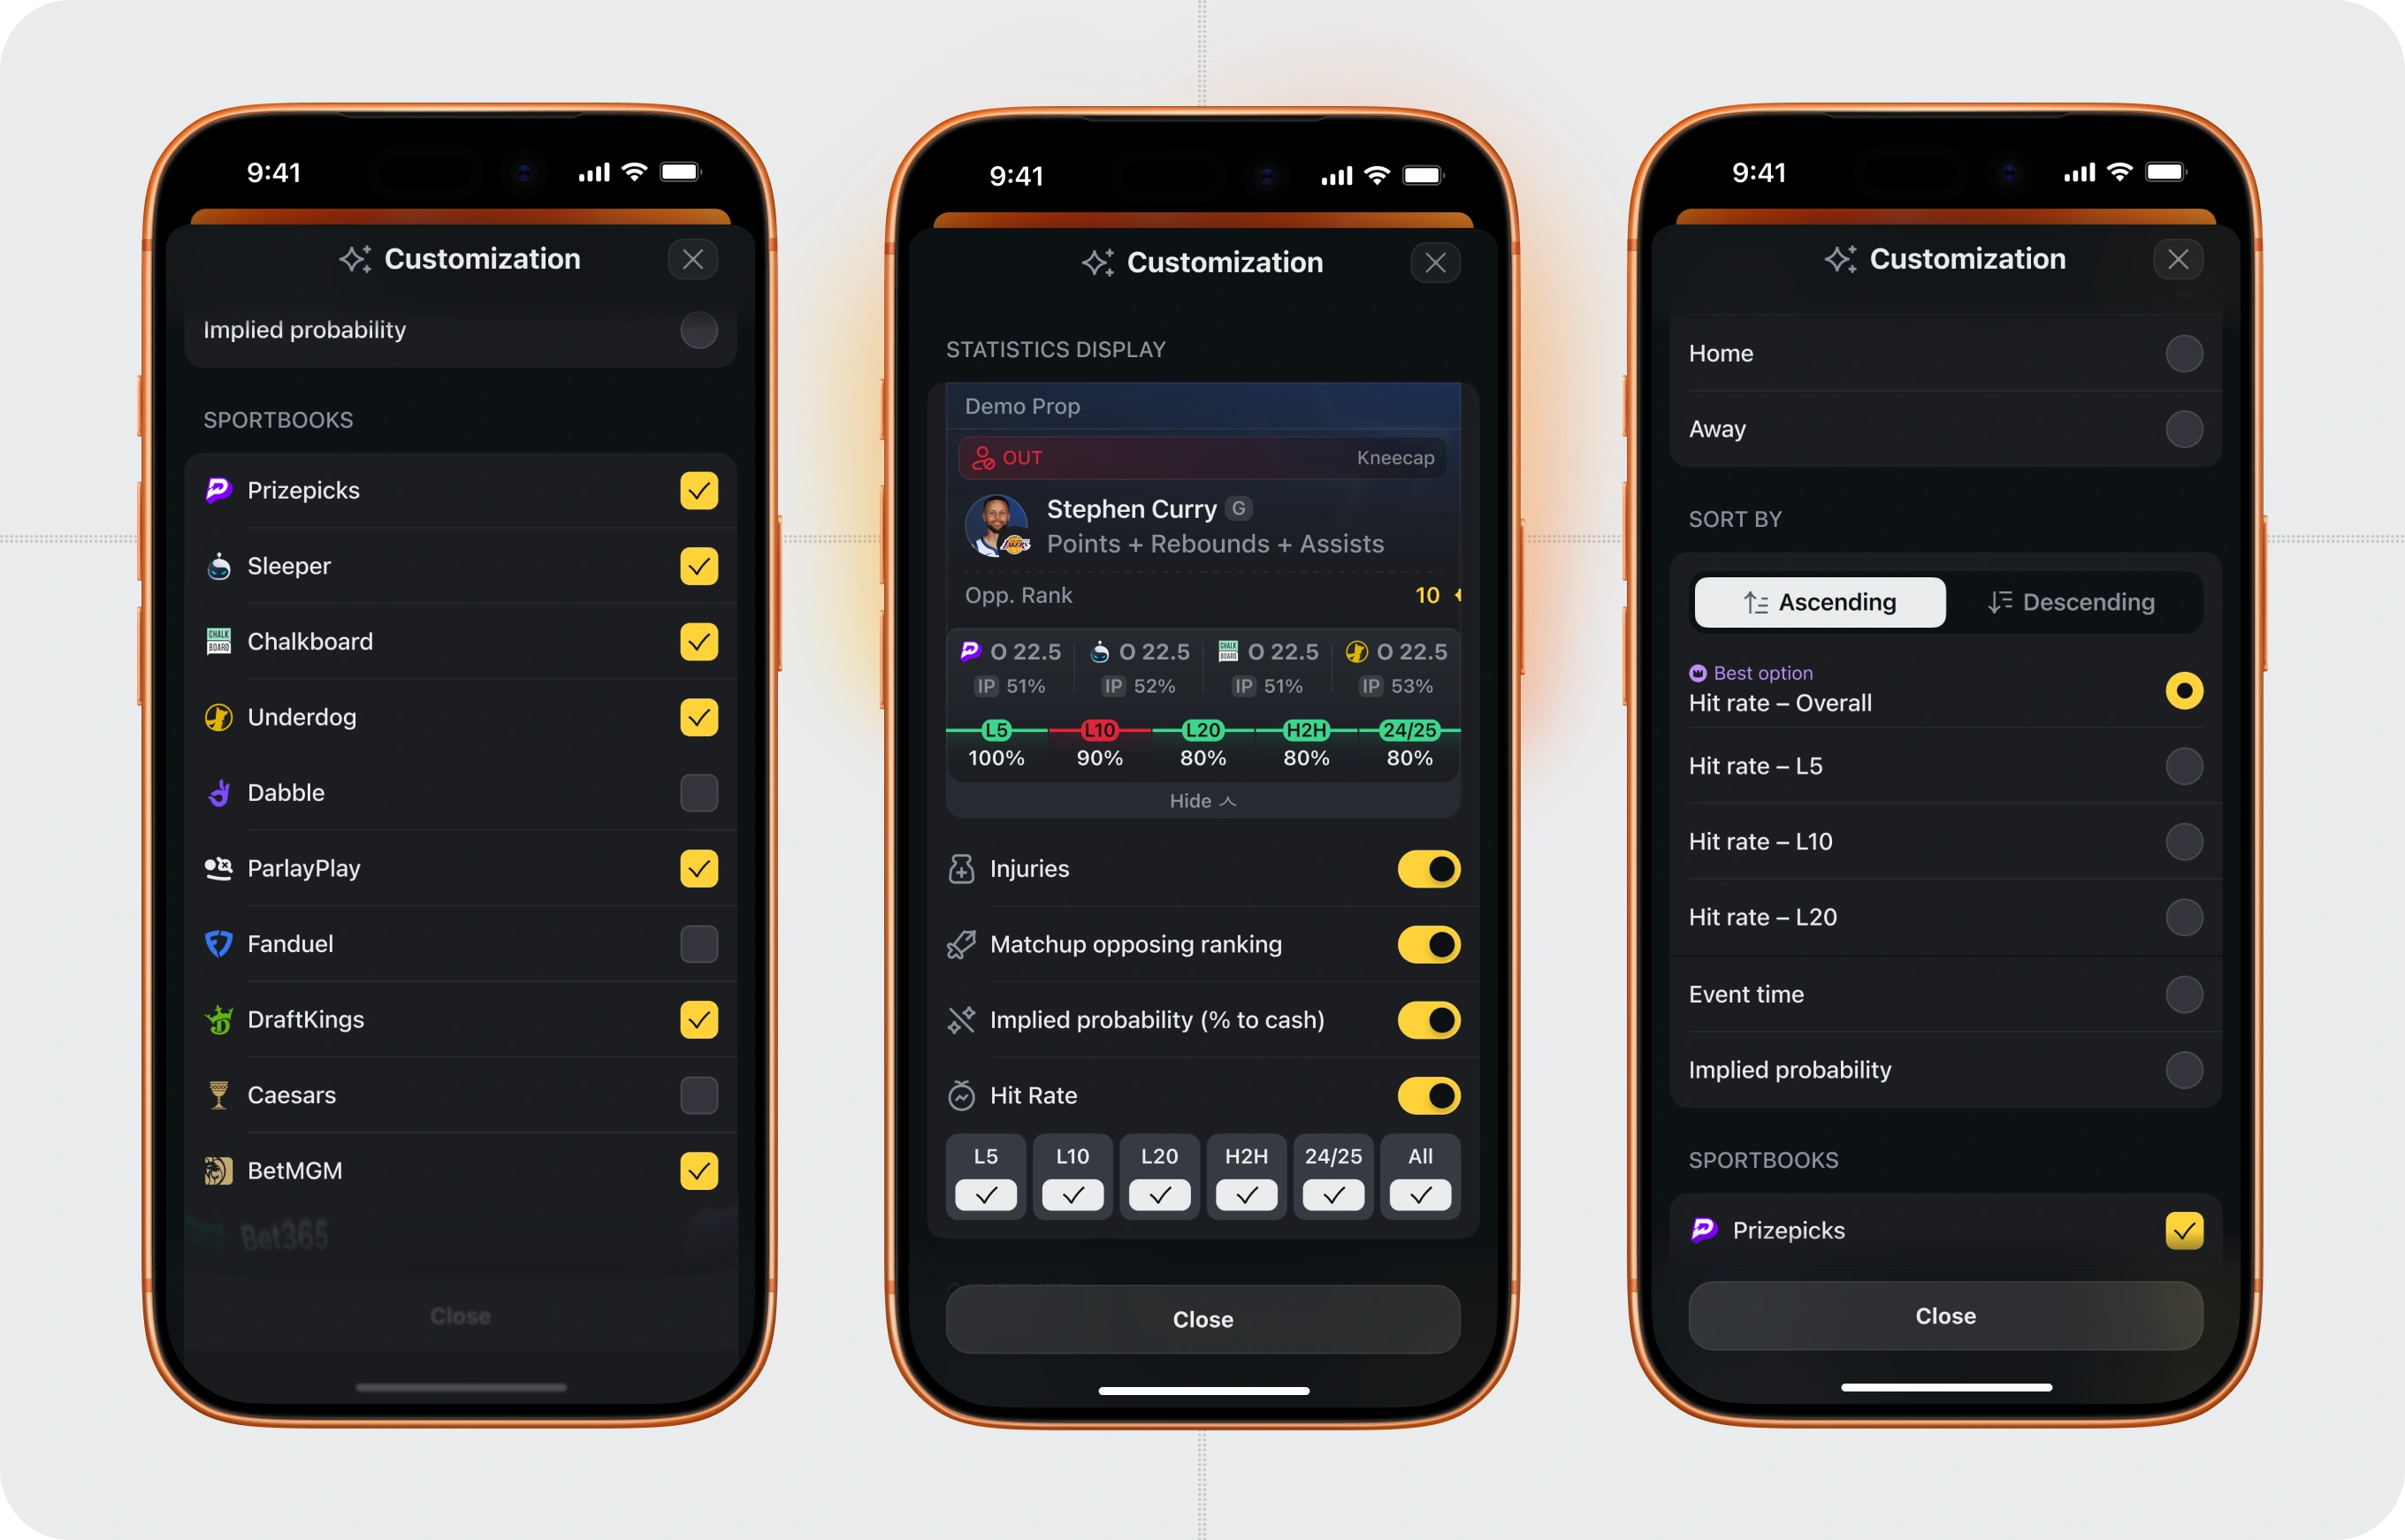
This is the same logic behind StatKing's sportsbook selection list — PrizePicks, Sleeper, Chalkboard, Underdog, Dabble, ParlayPlay, FanDuel, DraftKings, Caesars — where a user narrows the noise to the books they actually use, and every prop card across the app respects that choice.
Edge States: What the Card Shows When Something's Wrong
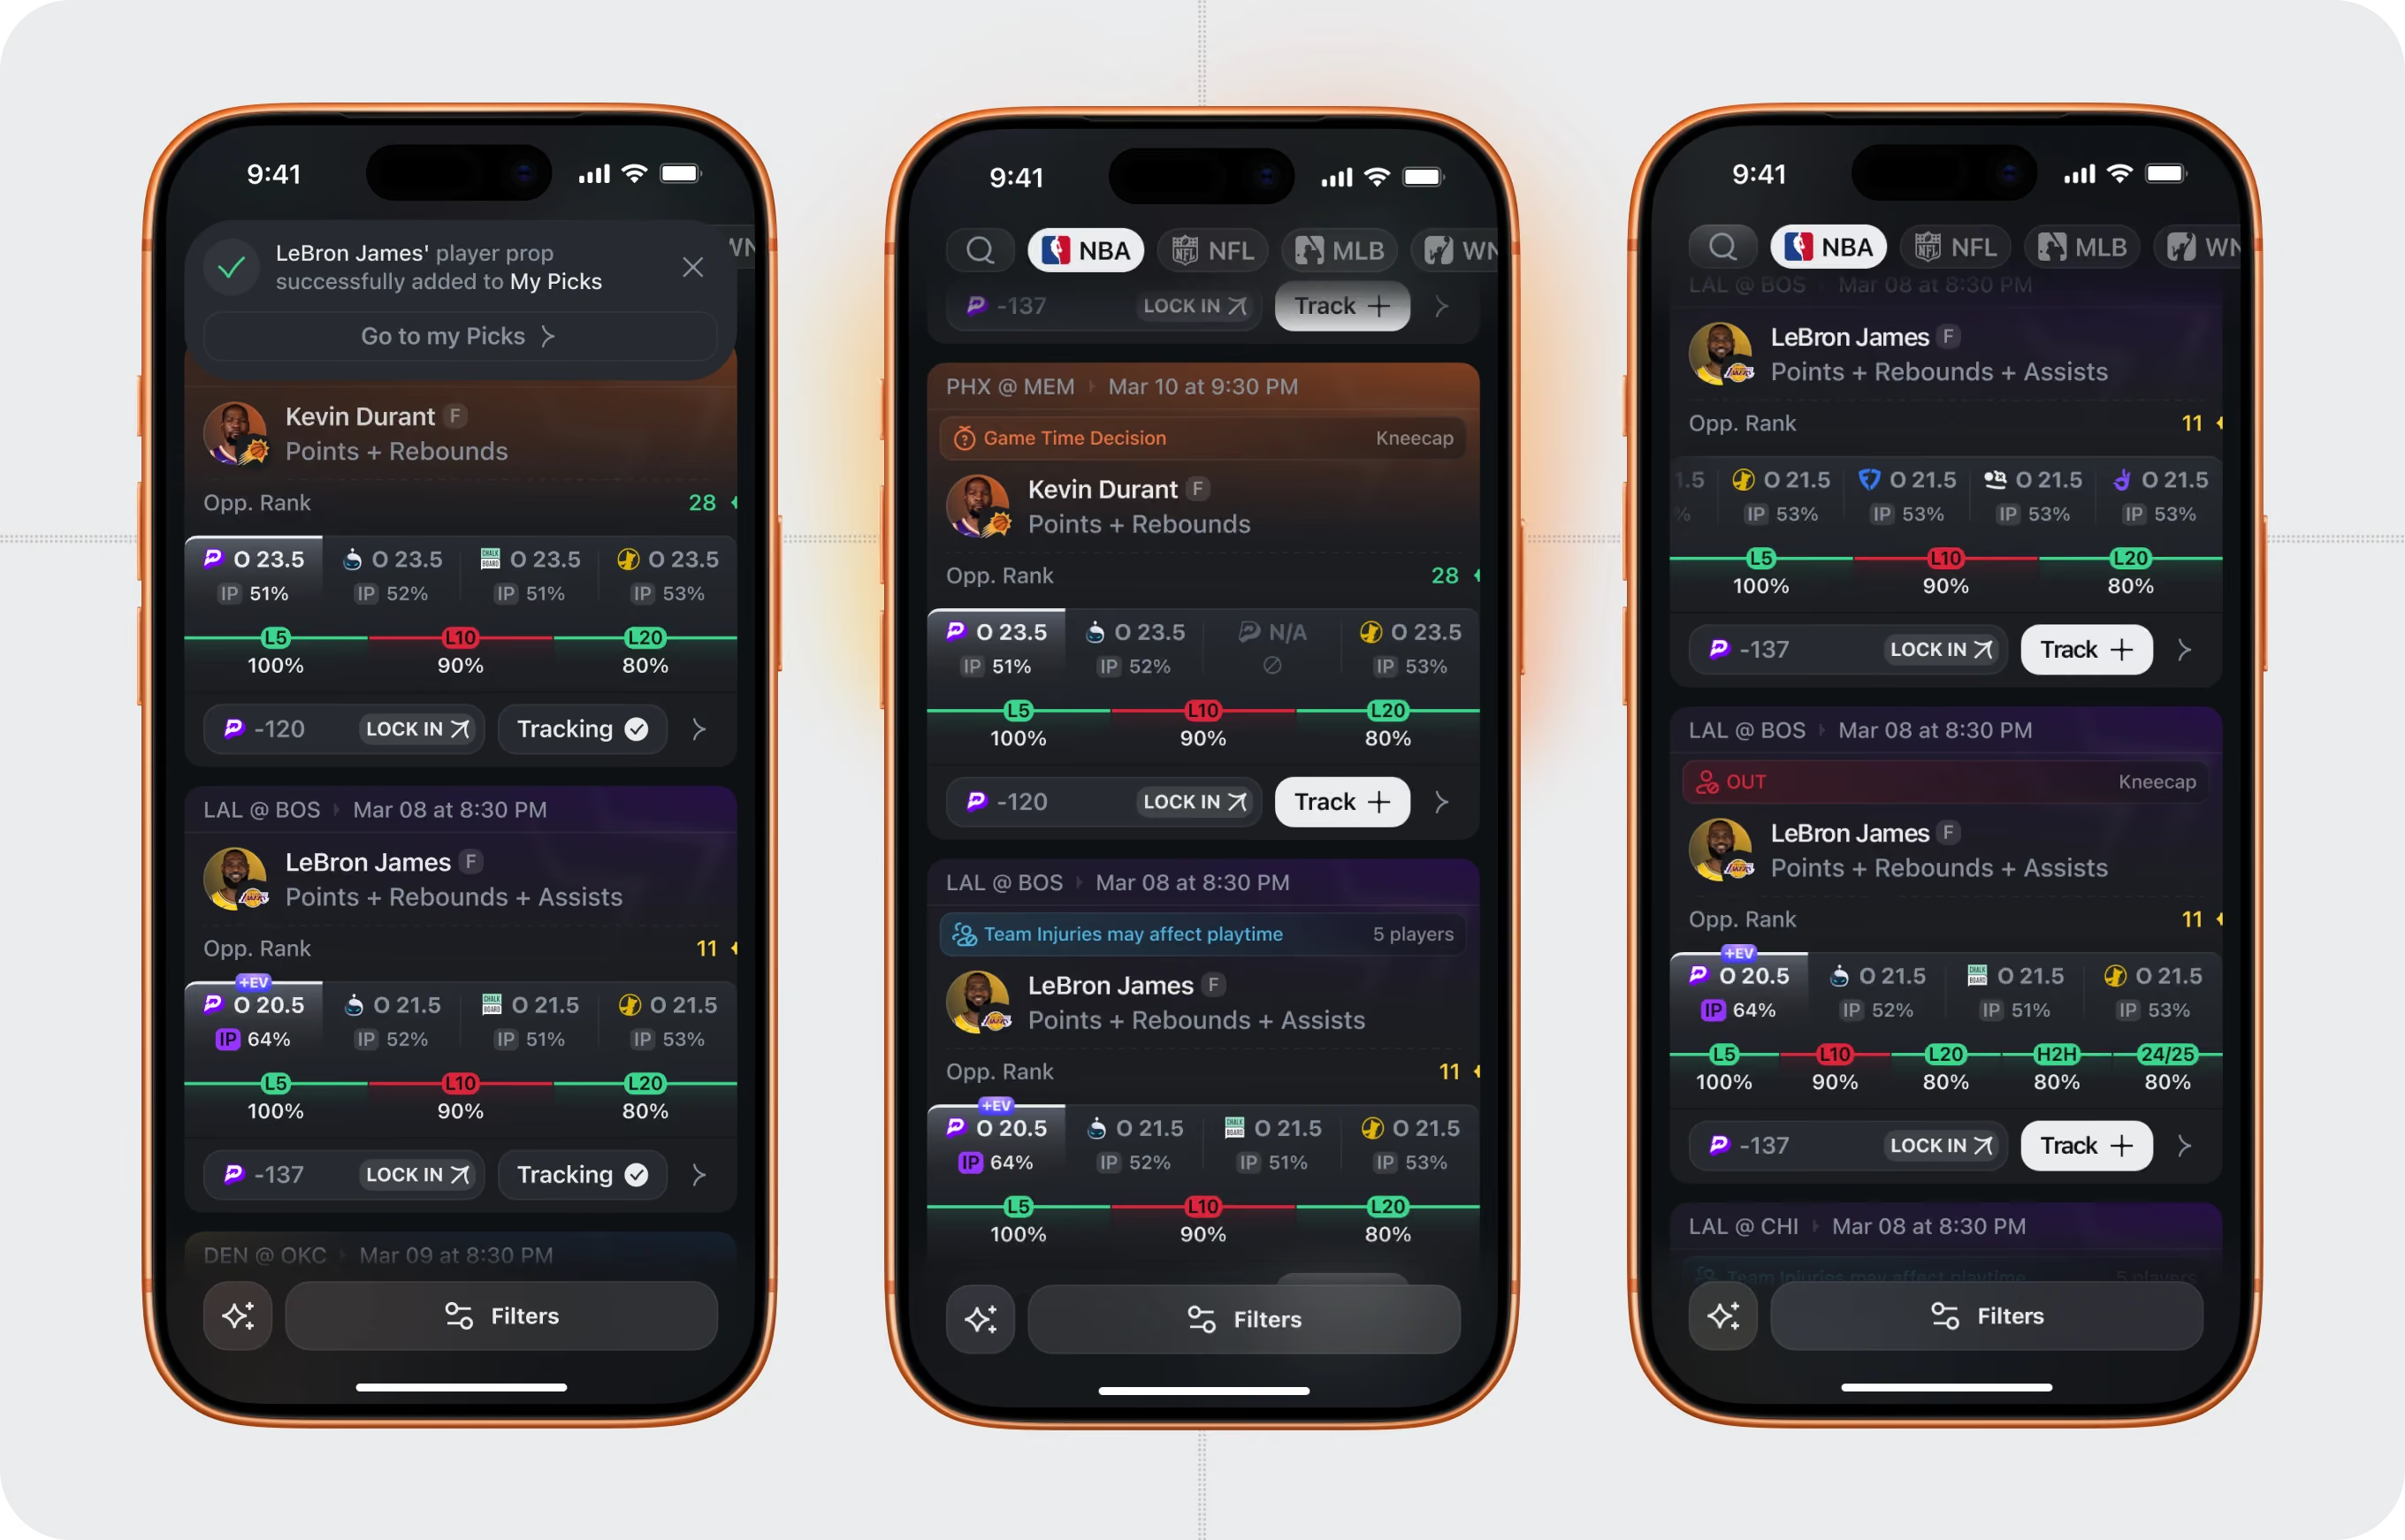
A prop card rarely lives in a clean state. Players get ruled out hours before tip-off. Status changes minute to minute on game day. The card needed visual states for both — a hard "OUT" flag with the reason attached (a specific injury, not just a red dot), and a softer "Game Time Decision" tag for players whose availability is still unresolved.
Designing for these states mattered more than designing the happy path. A bettor scanning fifty cards needs to spot the one flagged player before they lock in a pick, not after.
What We Cut to Ship NBA First
Three things didn't make the first release. Sport coverage launched with NBA only, with NFL and MLB following and further leagues marked "coming soon" rather than shipped half-finished. An in-article stat widget — inline prop data embedded directly into StatKing's articles, linking readers straight to the relevant props — was scoped out. And animated per-league iconography, similar to what Flatstudio had built for OddsJam and which the client liked, was also declined to protect budget and timeline.
None of these cuts touched the core product logic: the design system, the prop card architecture, and the filter model stayed untouched.
What Was Harder Than Expected
Running product design, iOS, and branding in parallel meant most of the budget went into build, leaving comparatively little for the marketing push the client had planned around Instagram and Twitch partnerships — one channel among several considered, not the only plan, but the one with the least runway left by the time development wrapped.
The branding phase surfaced its own lesson: building stylescapes — quick visual explorations of an emotional direction, tested with the client before a single logo sketch — let StatKing's team land on a visual mood in minutes, compared to the longer moodboard-collection process Flatstudio had used on earlier projects. That shift now shapes how Flatstudio runs brand discovery on every subsequent case.
The engagement ended before an independent marketing phase began, so there's no post-launch conversion data to report here — an honest gap, not a hidden one. The product did launch and run for a period afterward; as of publishing, the app is no longer listed on the App Store and, as far as we know, is currently up for sale.
Building a sports analytics or betting product? Flatstudio has designed player props tools, sportsbooks, and odds platforms for 8+ years — see the sports analytics portfolio or how a dedicated product team engagement works.
This article is part of the Flatstudio × StatKing case study series. Main article — StatKing: How We Built a Free Betting Analytics Product Against $40/Month Competitors.

Frequently Asked Questions
What is a player prop in sports betting?
A player prop is a bet on an individual statistic – like points, rebounds, or strikeouts – rather than the outcome of the game itself. Bettors wager on whether a player will go over or under a set number for that stat, independent of which team wins.
How do sports betting apps calculate hit rate?
Hit rate is the percentage of times a specific prop line has hit over a defined stretch of recent games – commonly the last 5, 10, or 20 games, or head-to-head history against a specific opponent. It's a historical pattern, not a guarantee of future outcomes.
What makes good UX for sports betting analytics apps?
Strong UX in this category compresses dense data – odds, stats, and trends – into a single scannable view, while letting advanced users drill into detail on demand. Customizable displays, clear injury states, and consistent card layouts across sports are the core patterns that make dense data usable.
Can bettors customize what stats they see in a prop app?
In StatKing's case, yes – a dedicated Customization panel lets users toggle individual stat categories (injuries, matchup rank, implied probability, hit rate windows) on or off, and that configuration persists across sessions rather than resetting each time.
What is a stylescape in brand design?
A stylescape is a quick, exploratory visual composition – color, texture, imagery, type – built to test an emotional direction before any logo or full identity work begins. It lets a client react to a mood rather than a finished design, which speeds up alignment early in a branding process.
