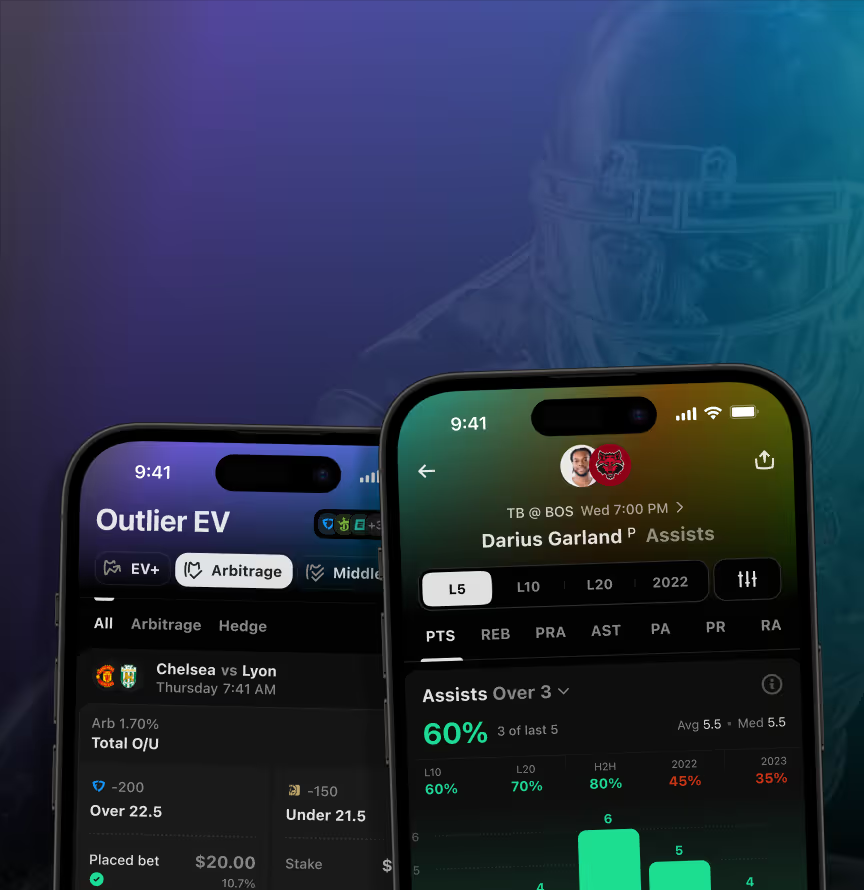















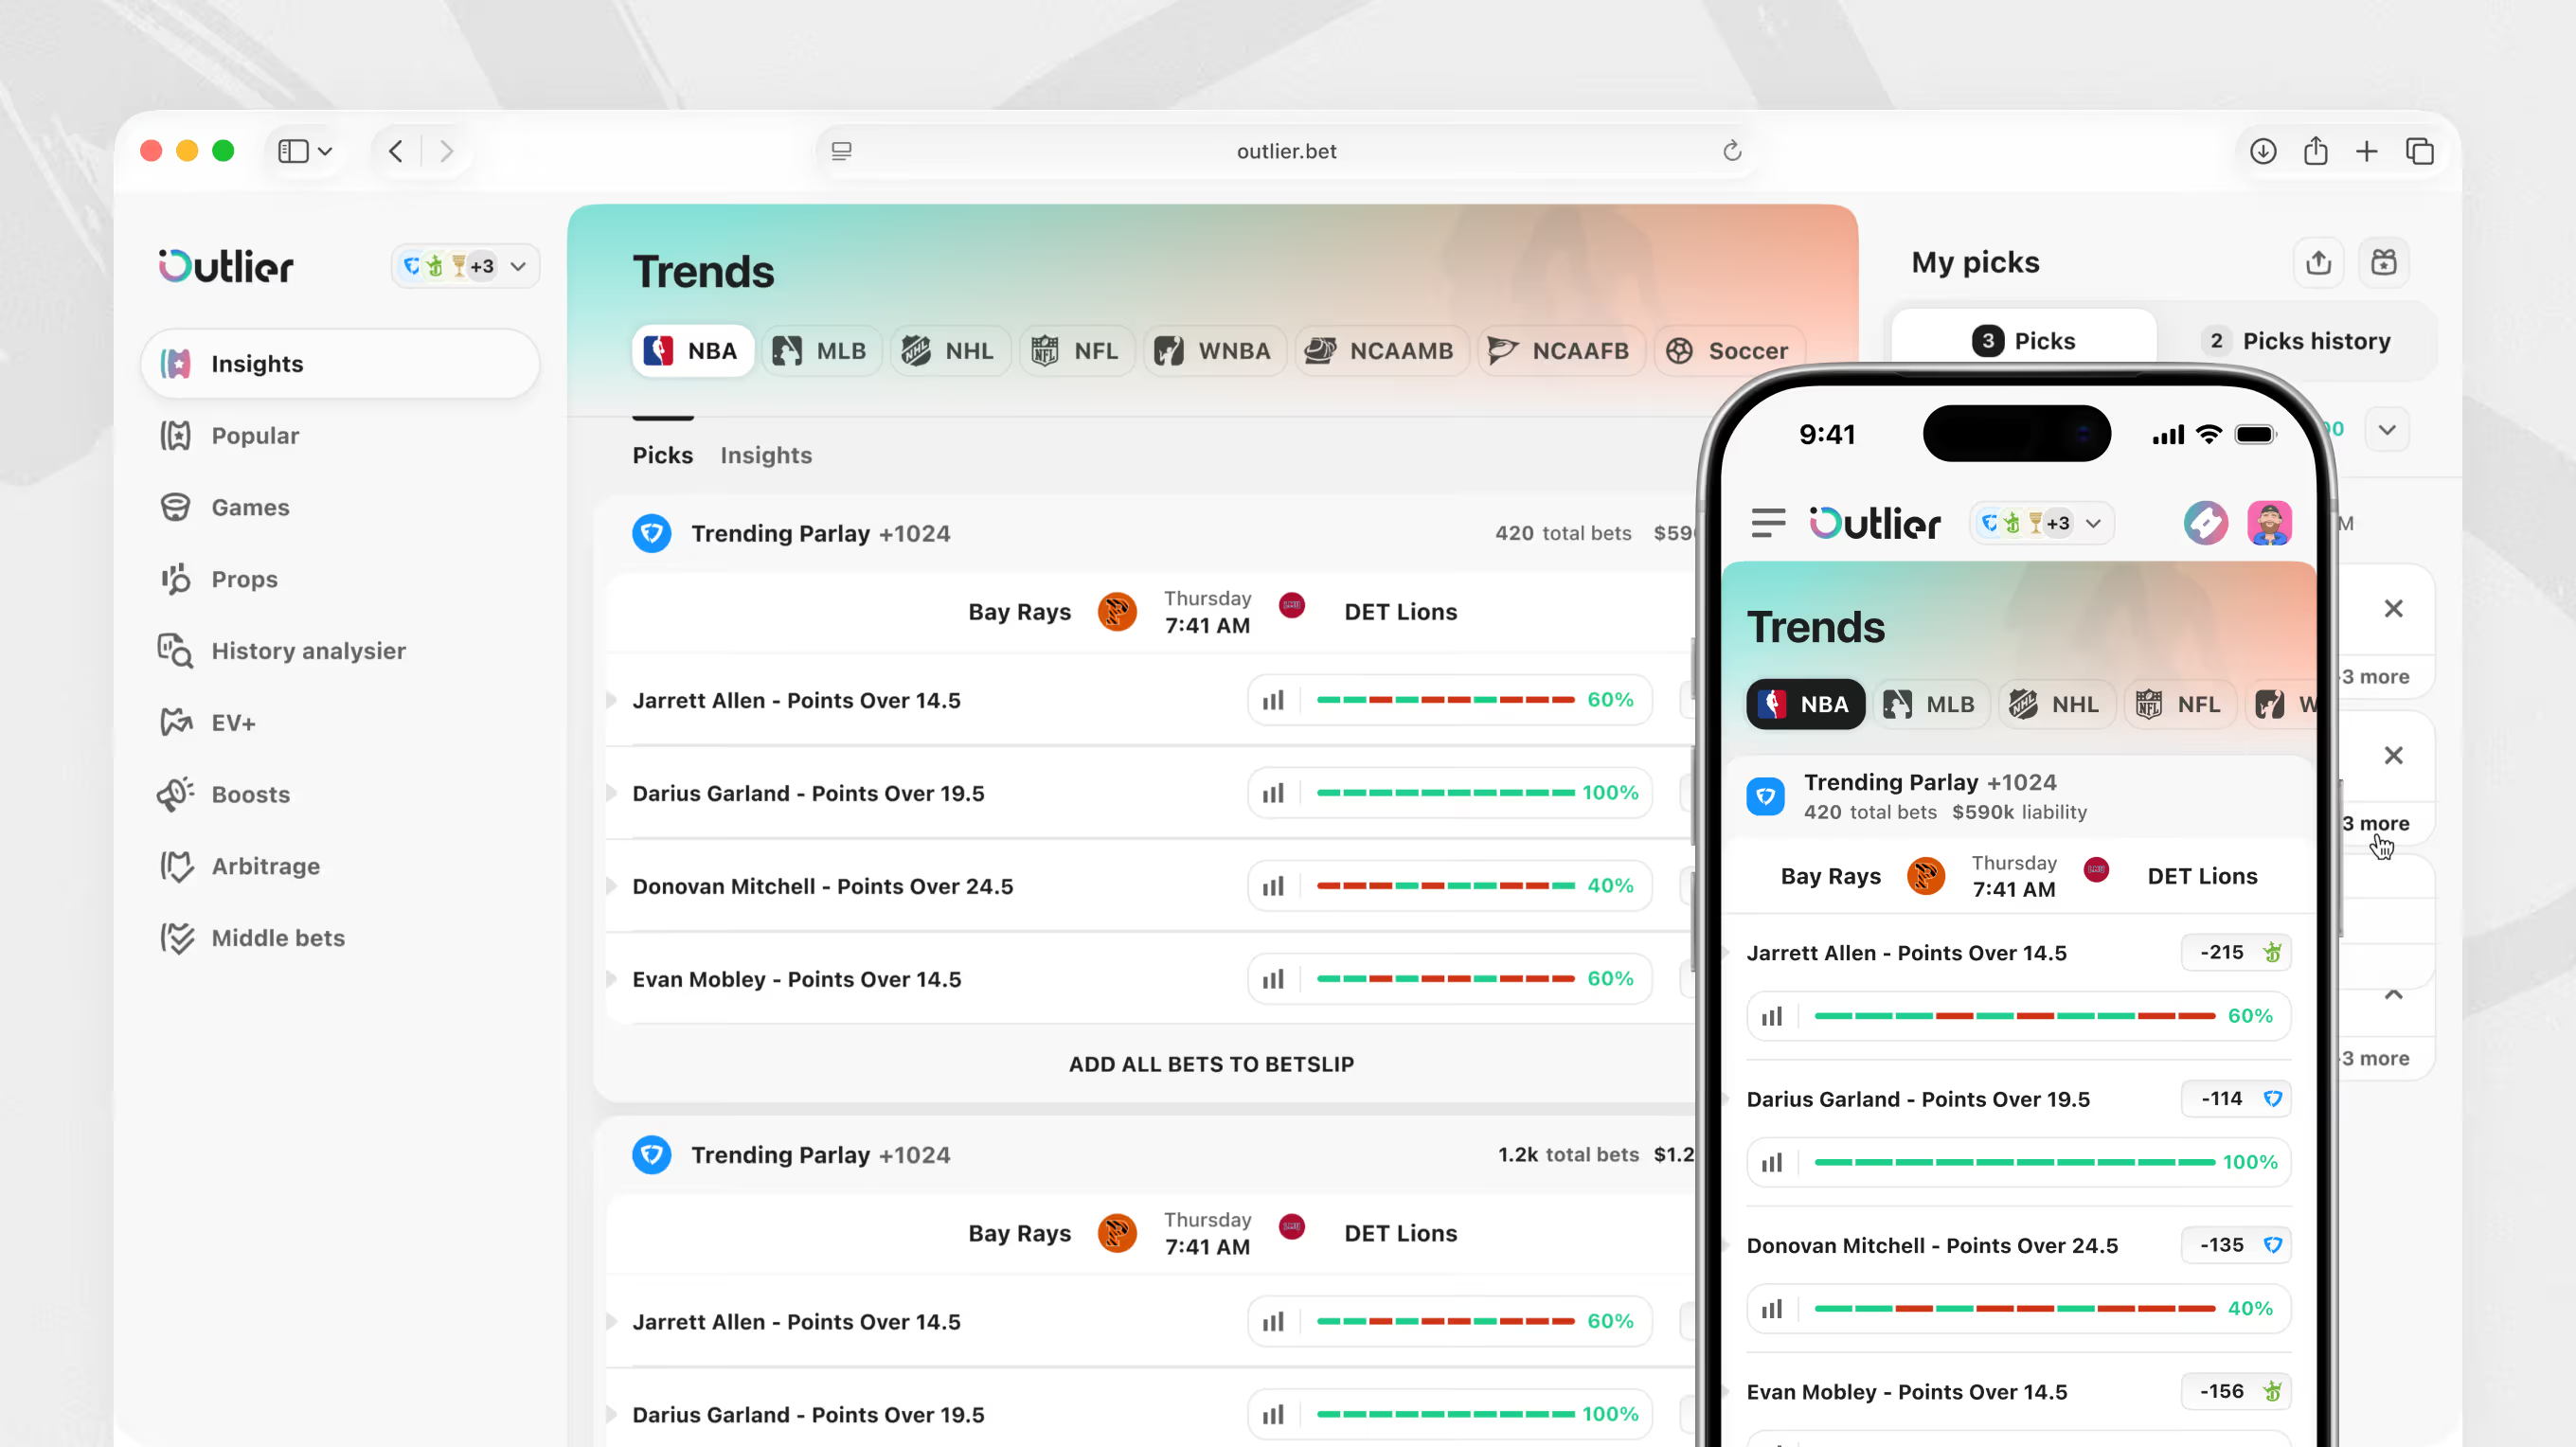

We built it from day 0, covering market research, product strategy, and a design system supporting fast integration of new sportsbooks. Colour-vision accessibility was built in from the start – and the platform became a first-of-its-kind US sports betting analytics product.
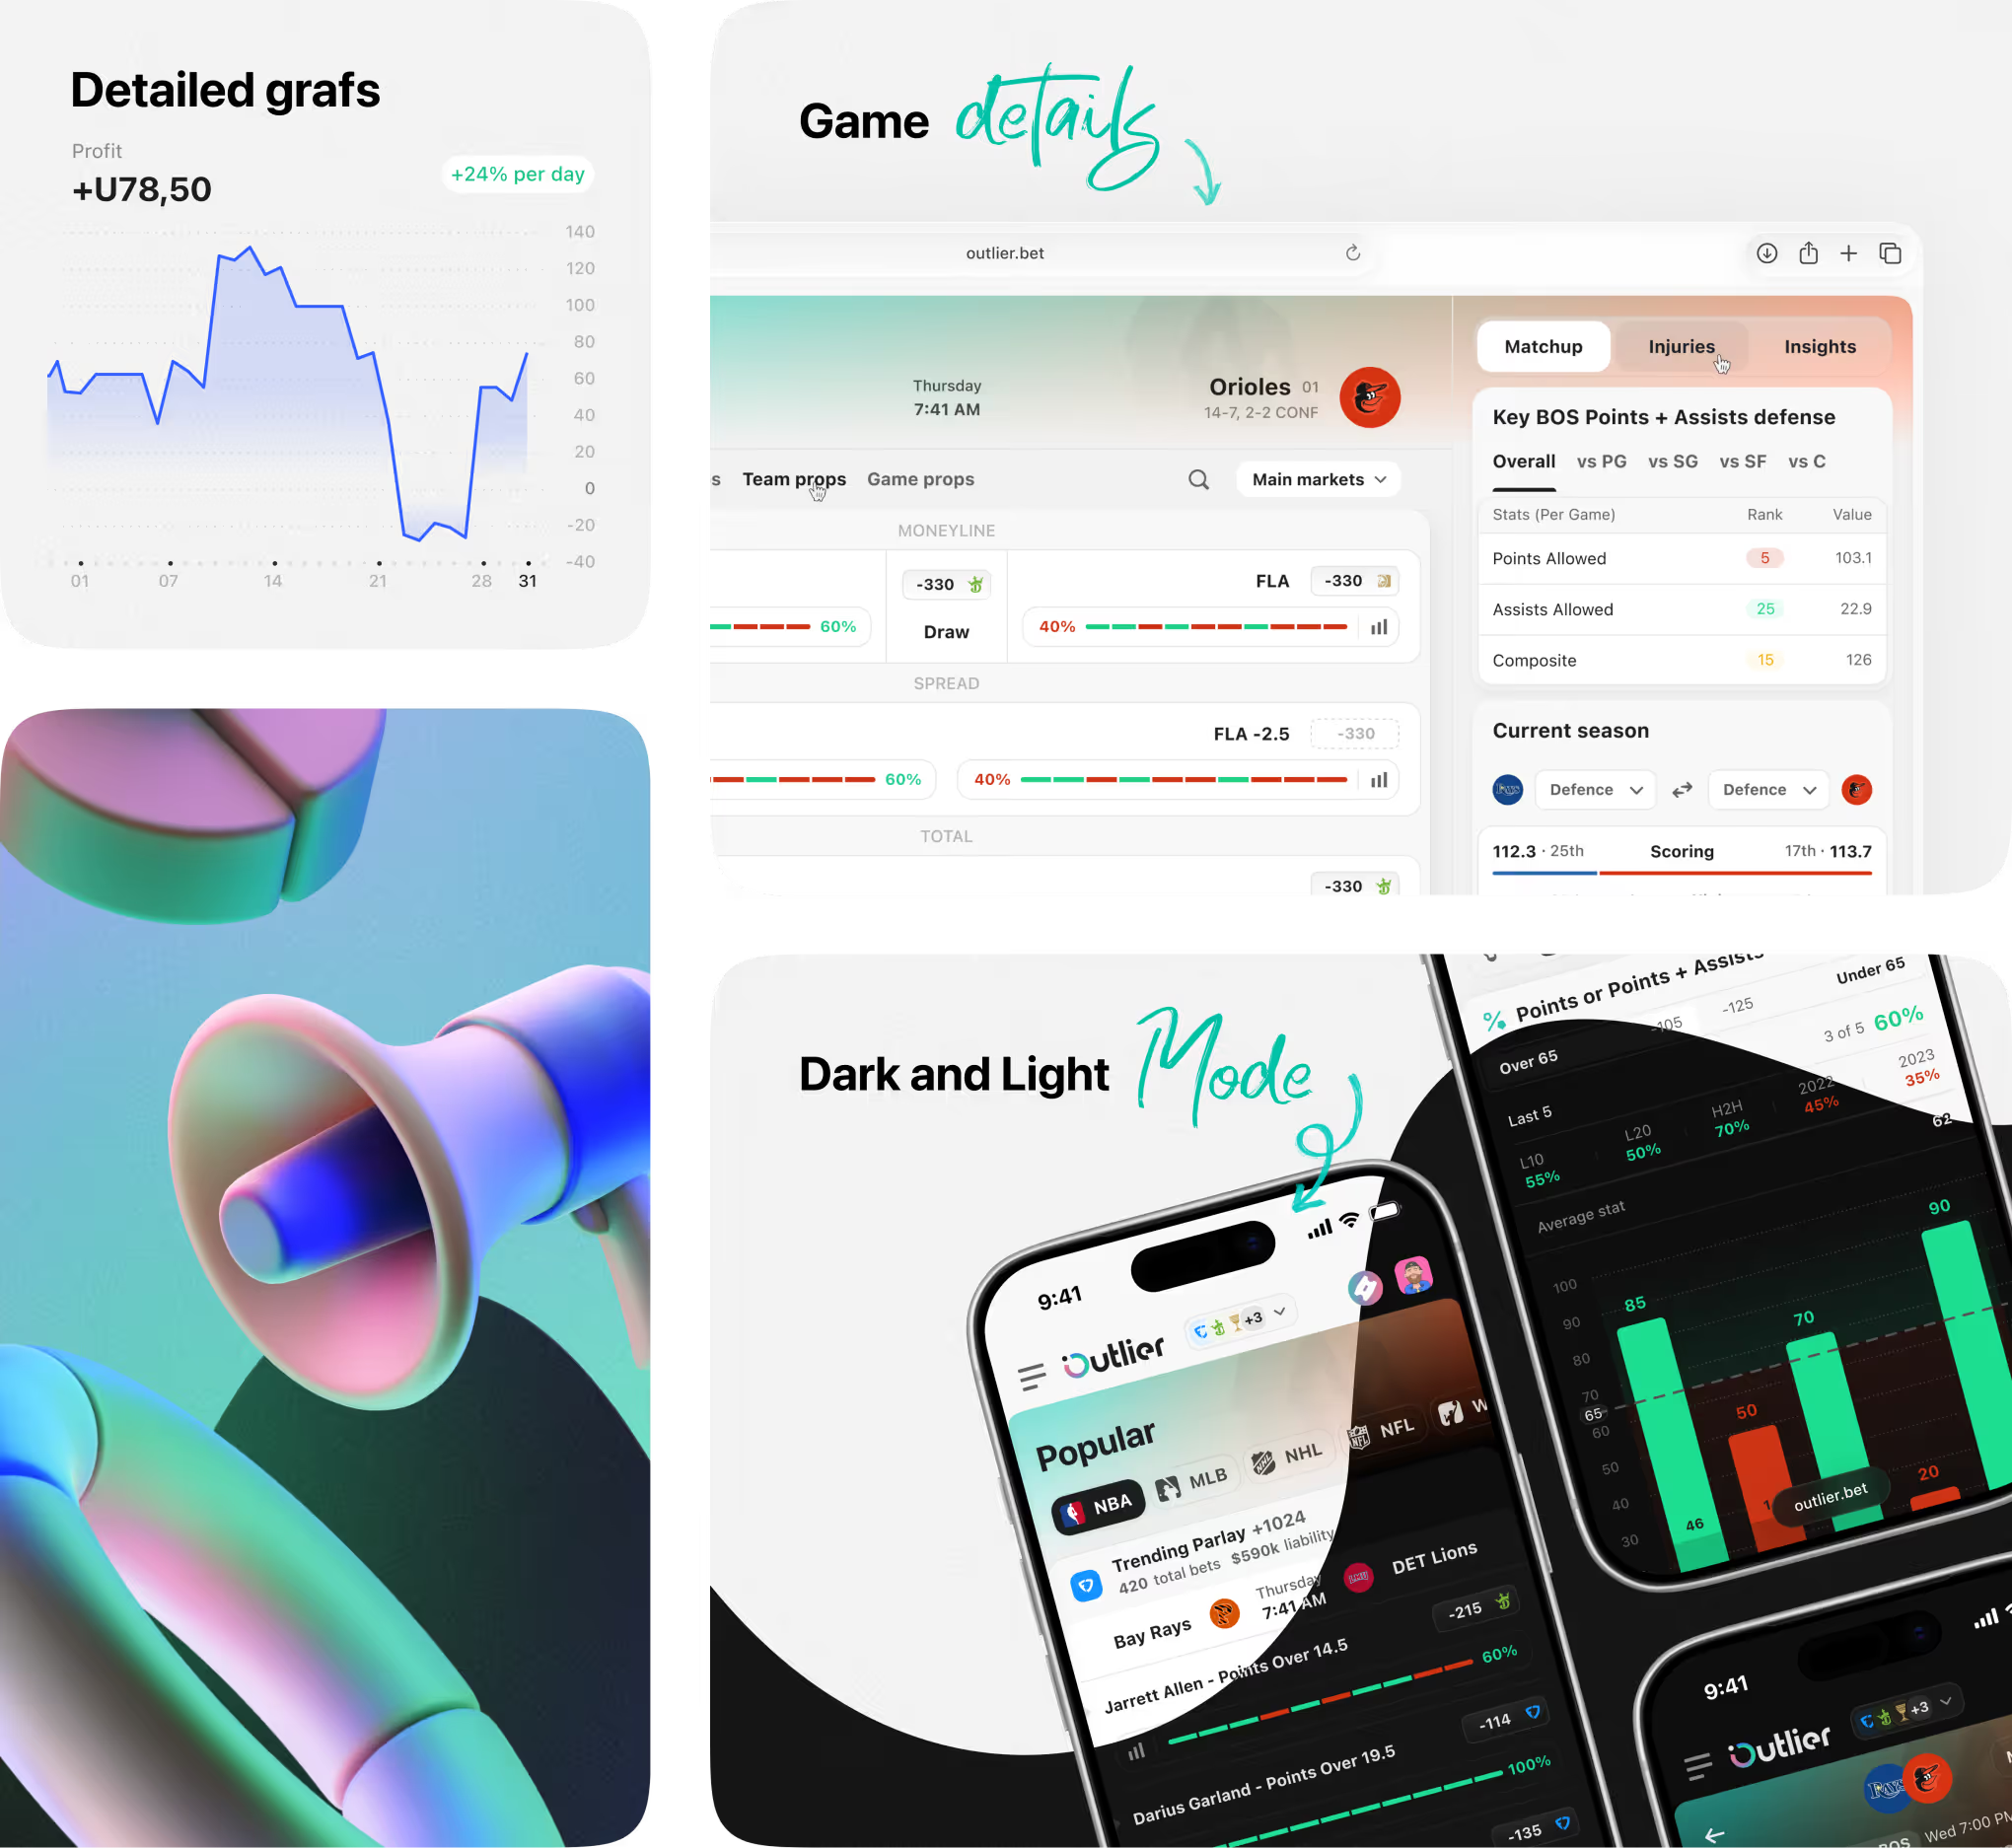
An overview of the sports betting analytics platform built for US bettors tracking odds, props, and value bets. Screens cover profit tracking, game insights, arbitrage staking, and dark/light modes.
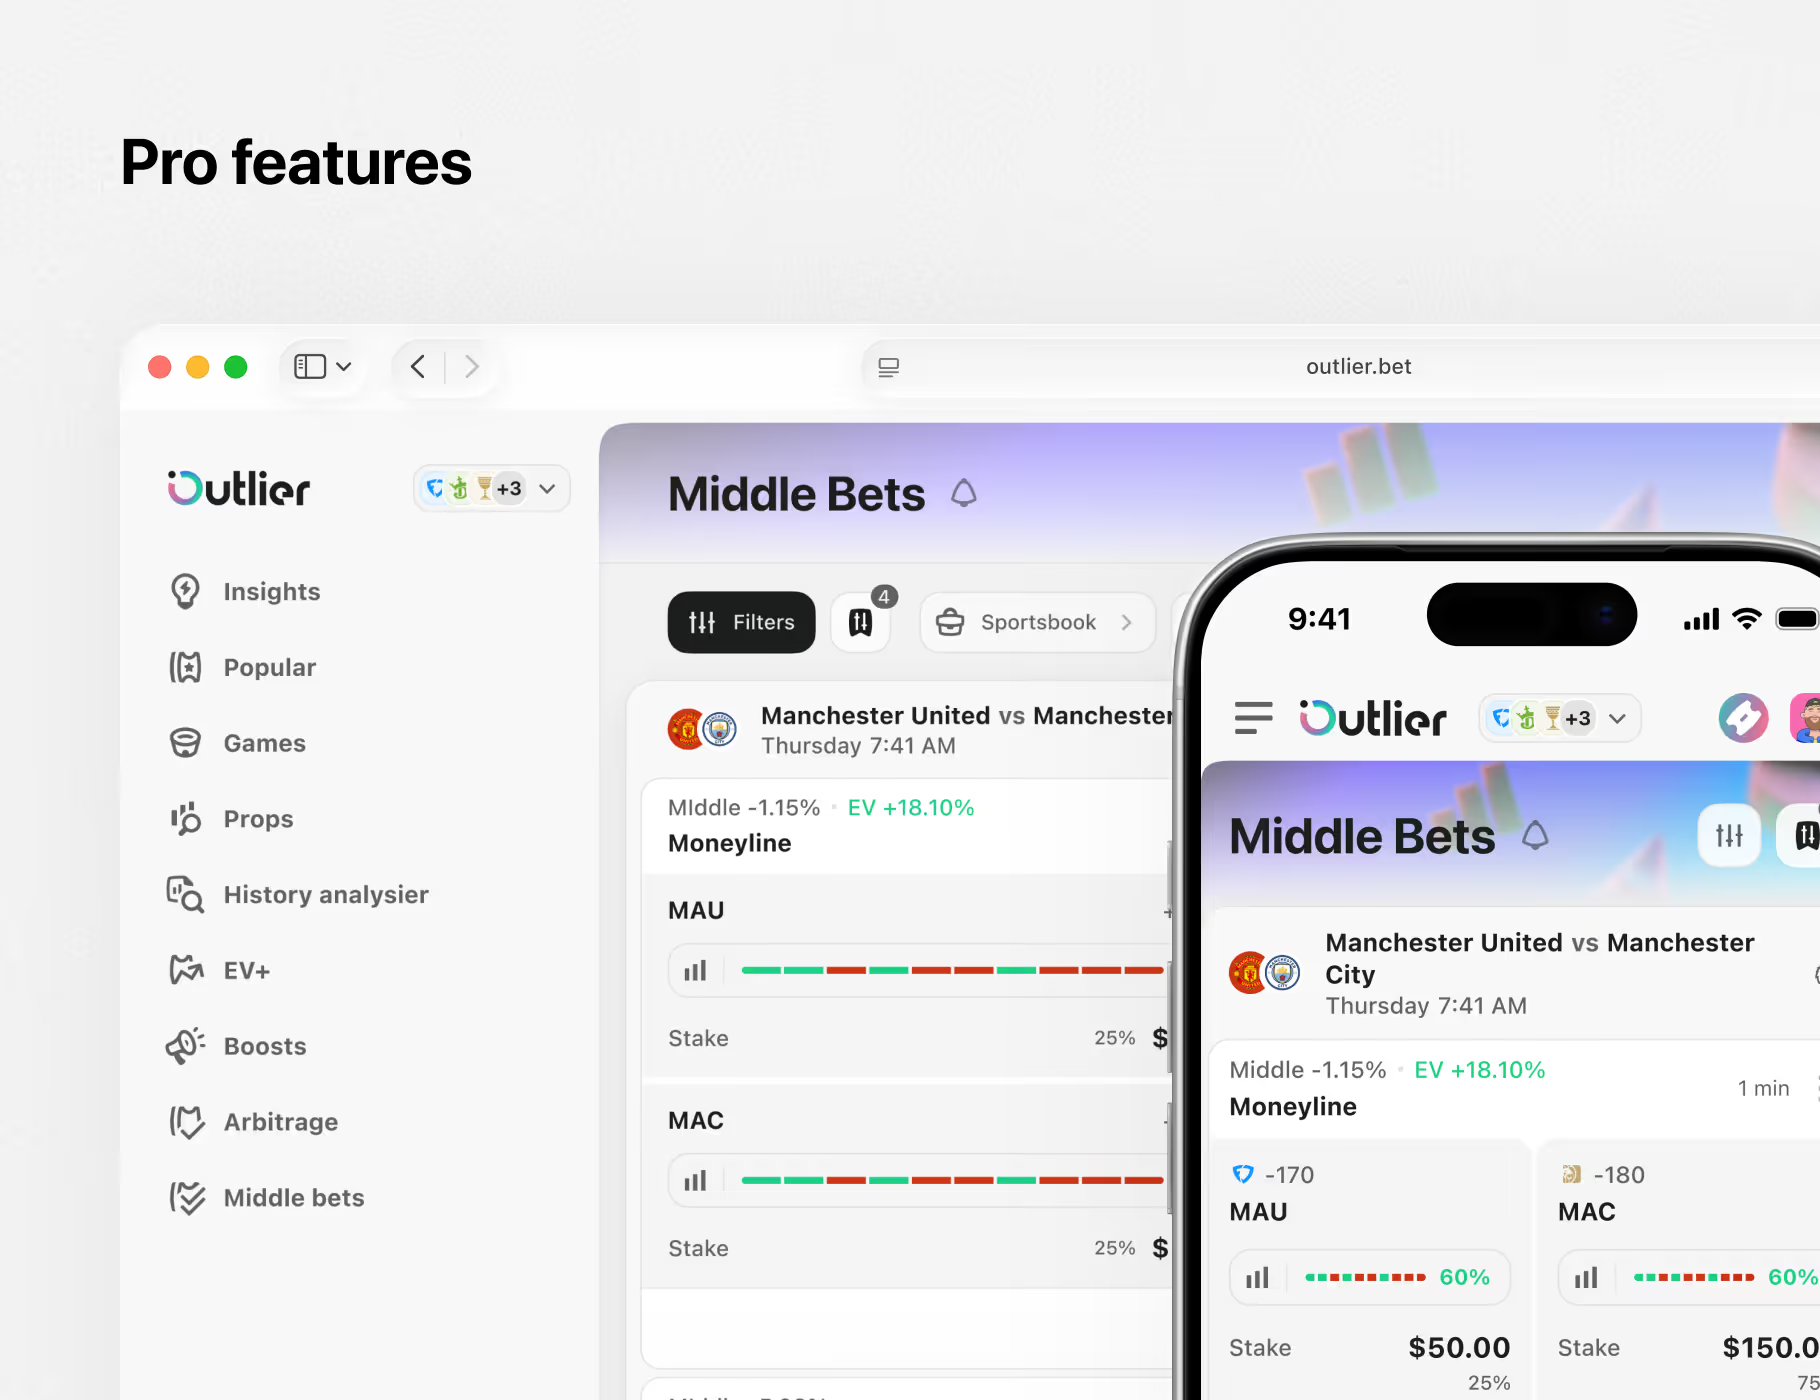
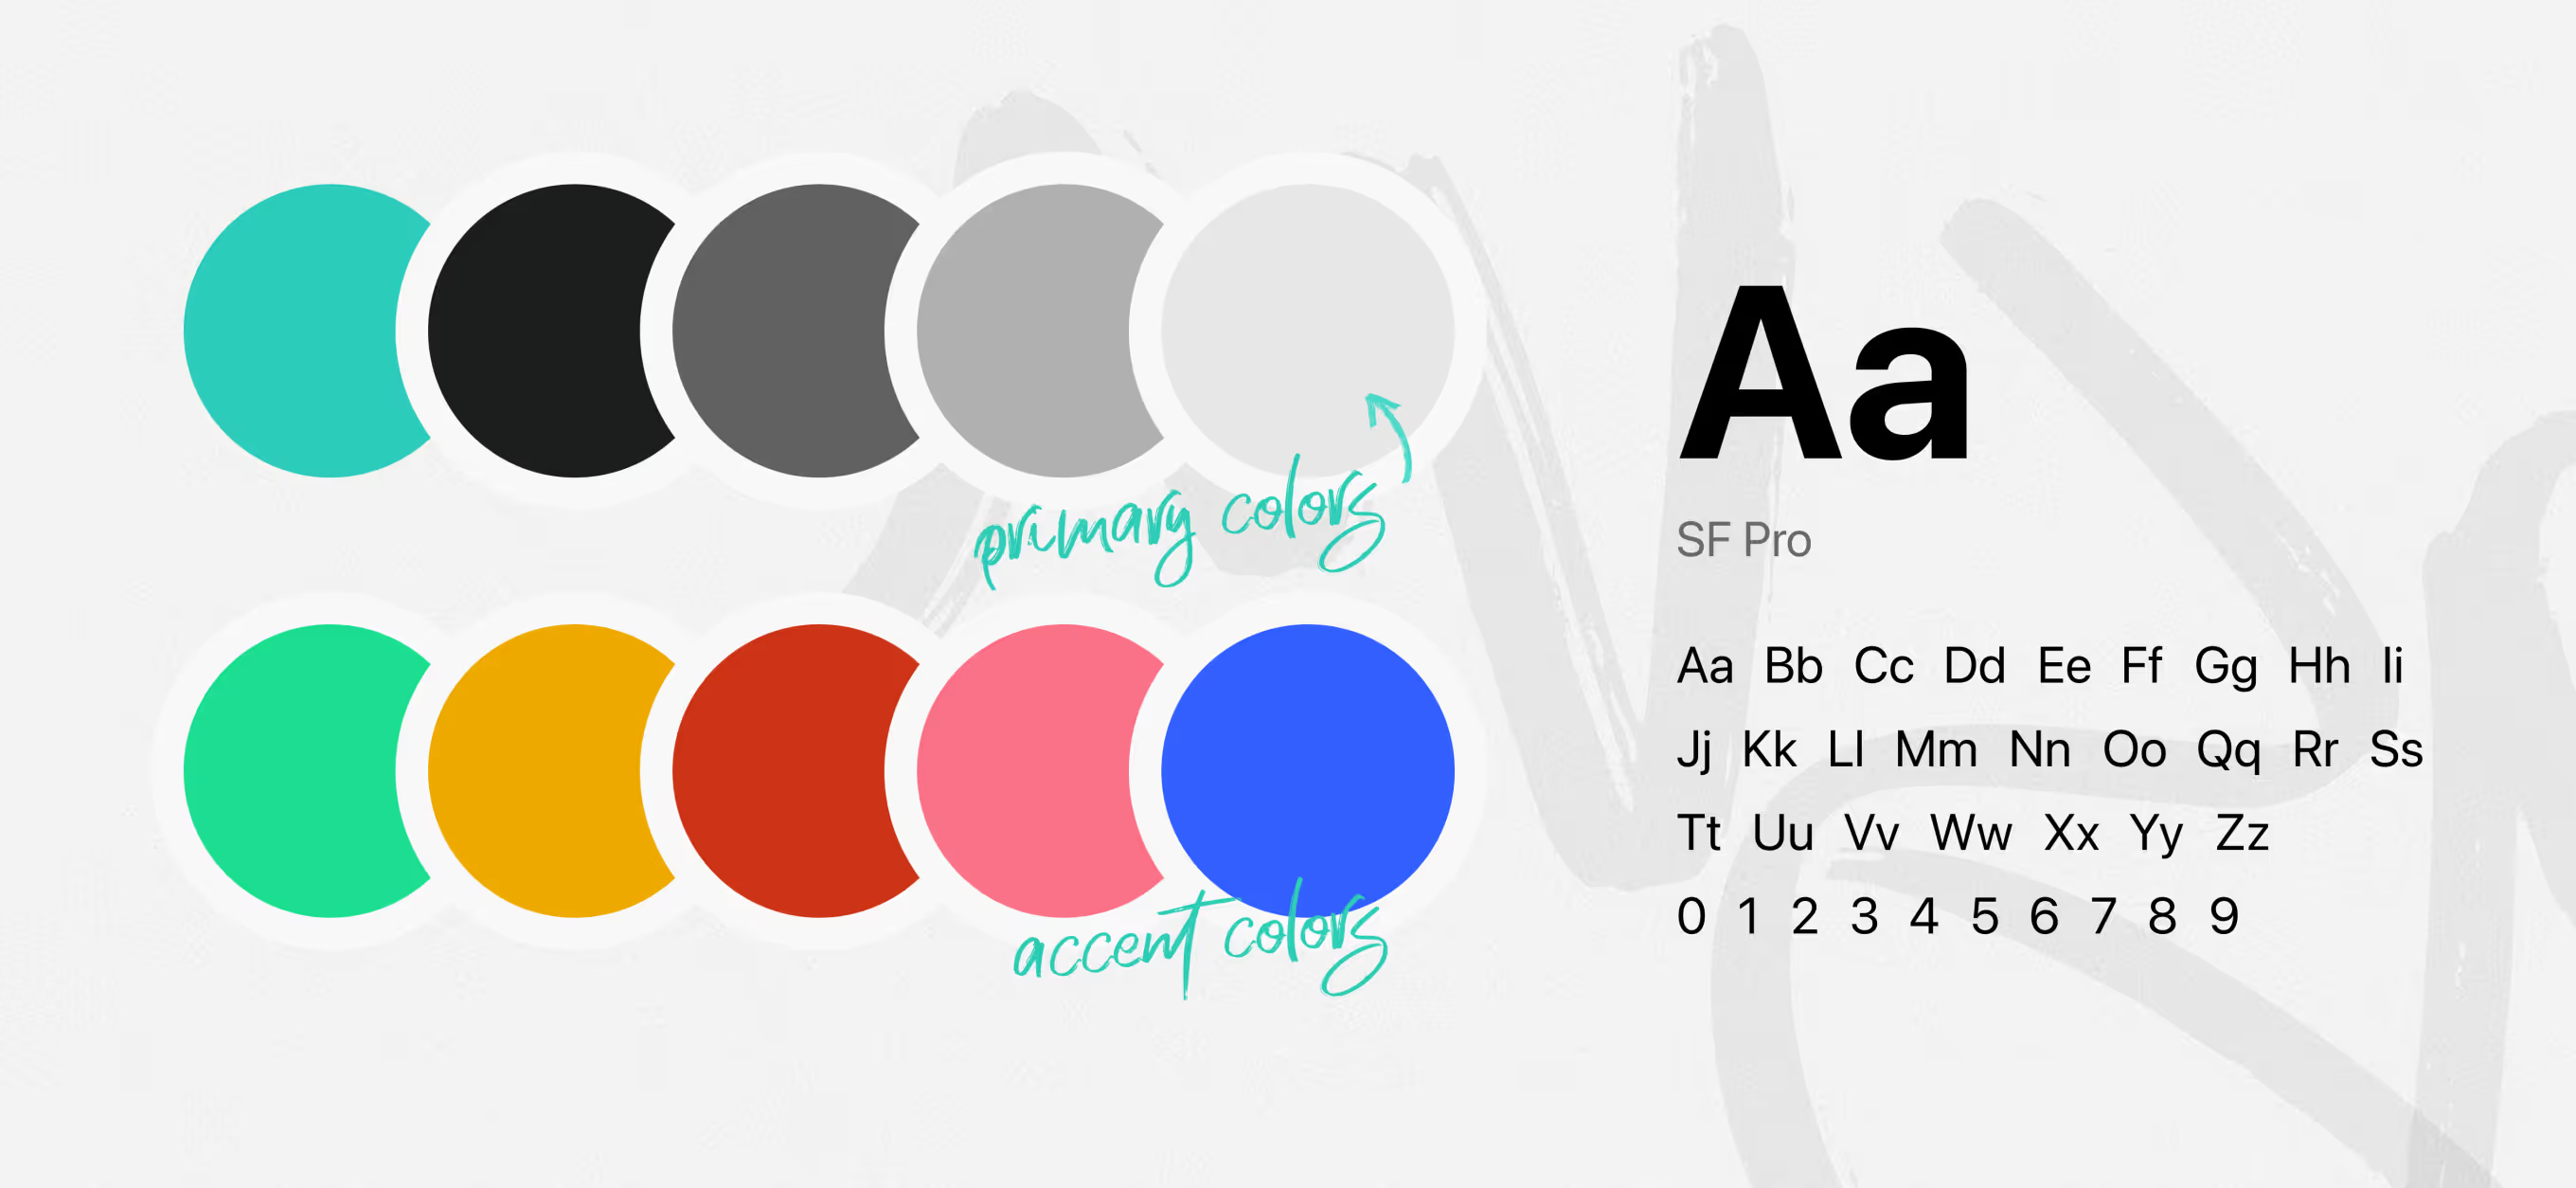
The visual foundation behind Outlier's design system, built for a data-dense sports betting platform. A teal-led primary palette pairs with five accent colors and SF Pro type for fast odds scanning.
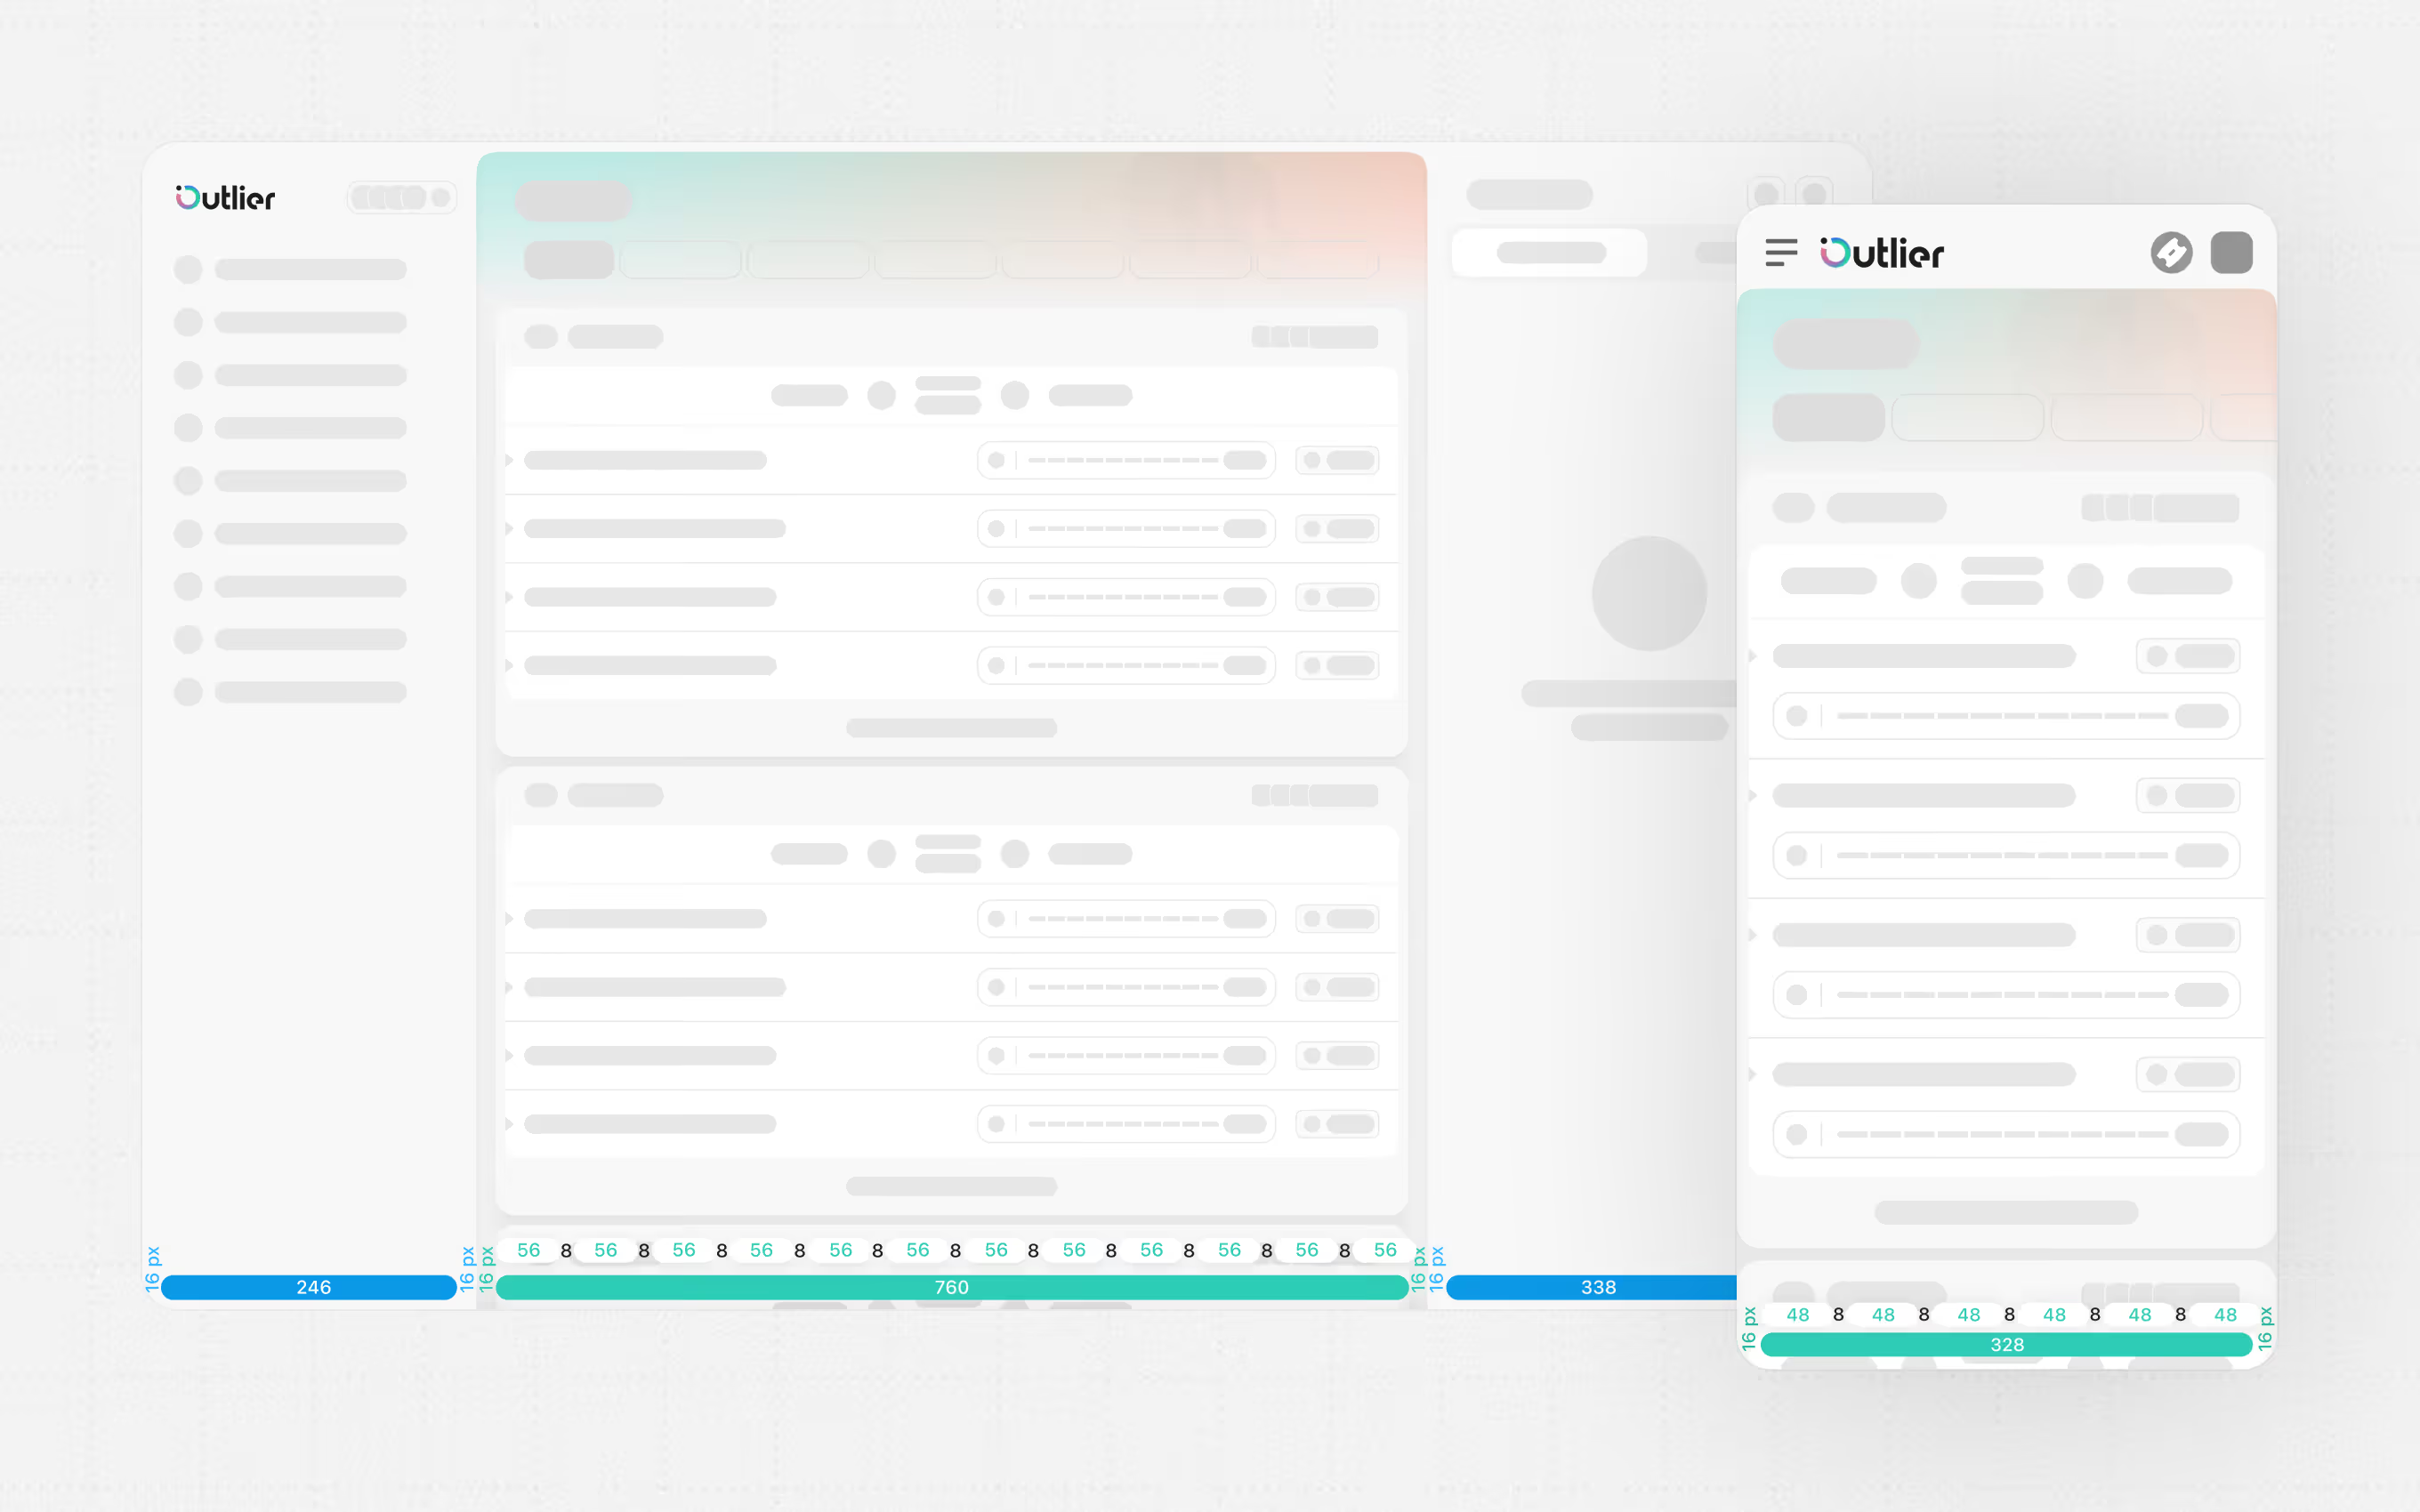
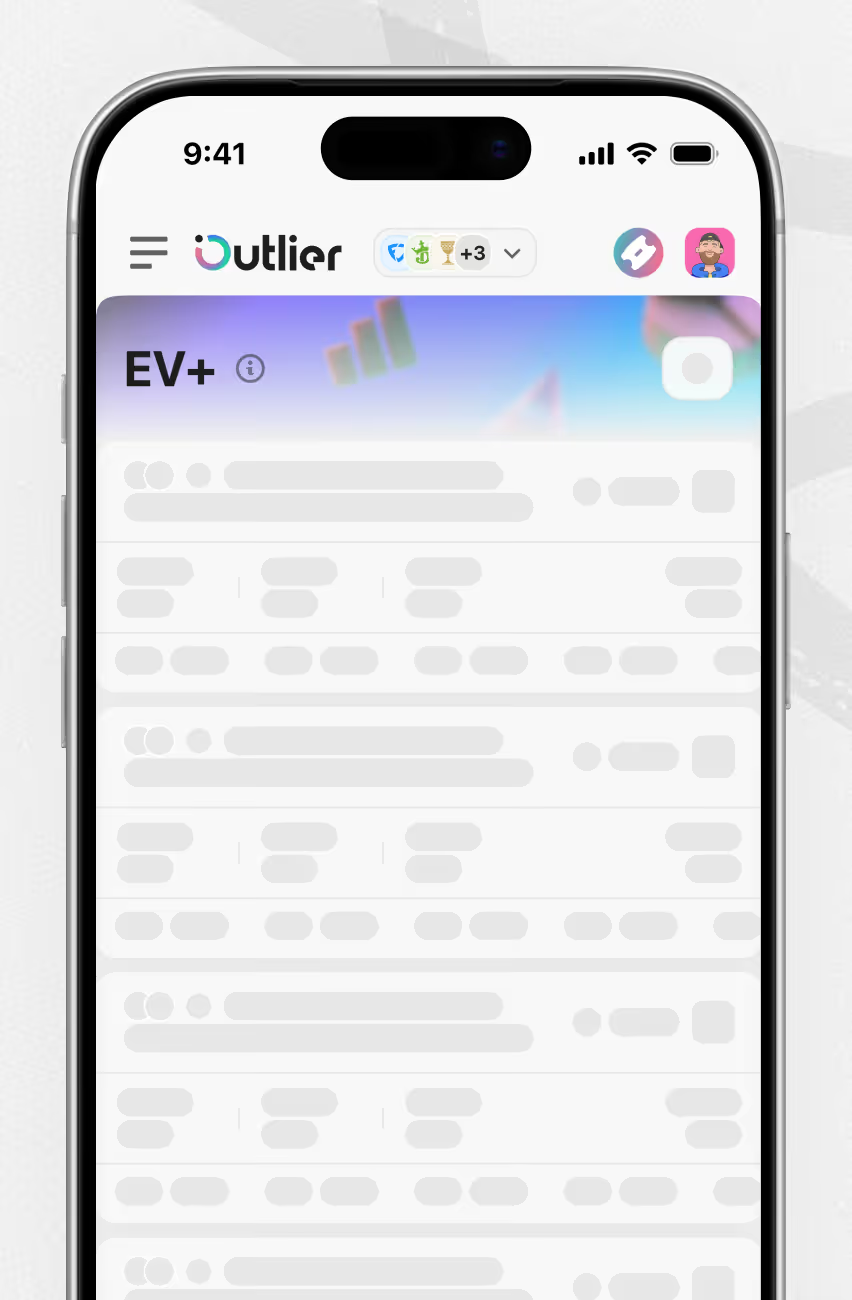
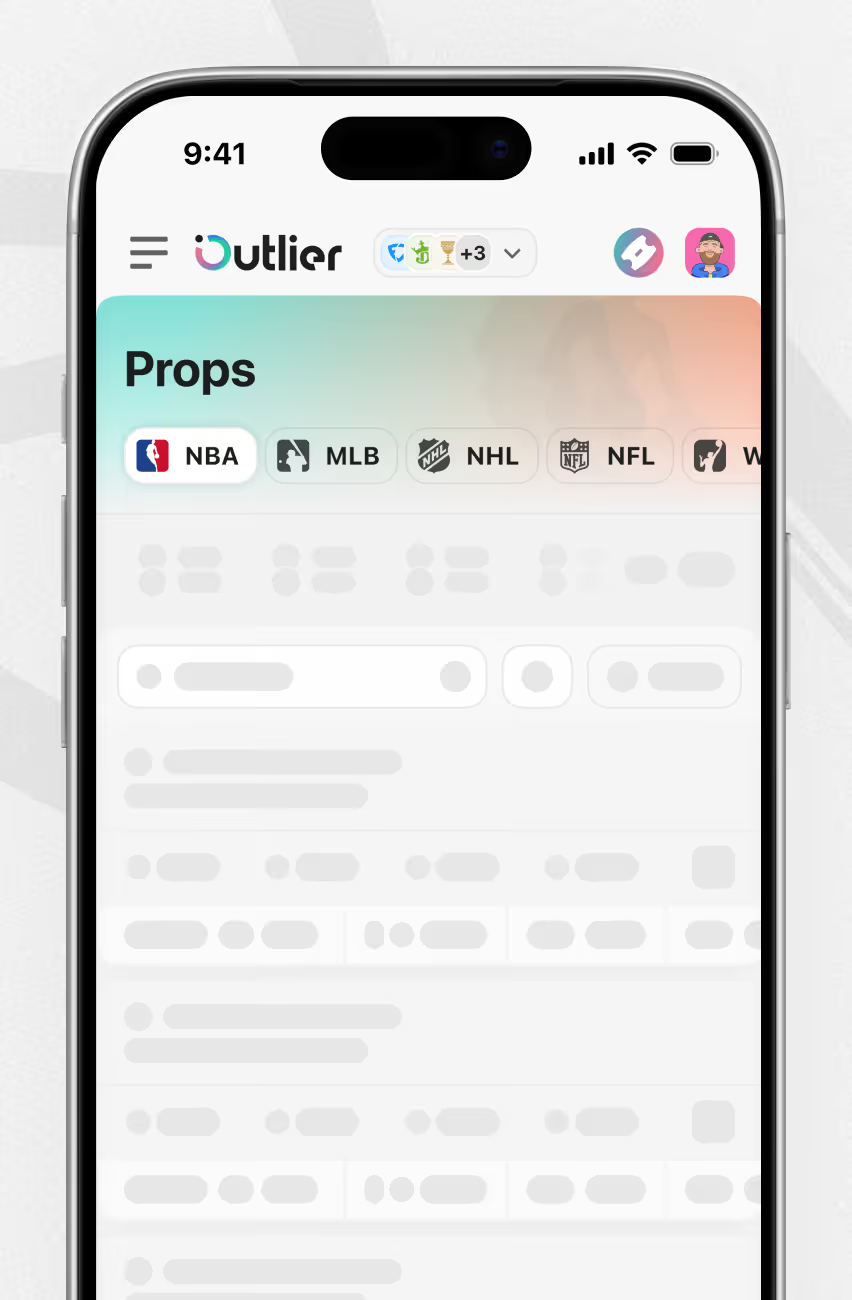
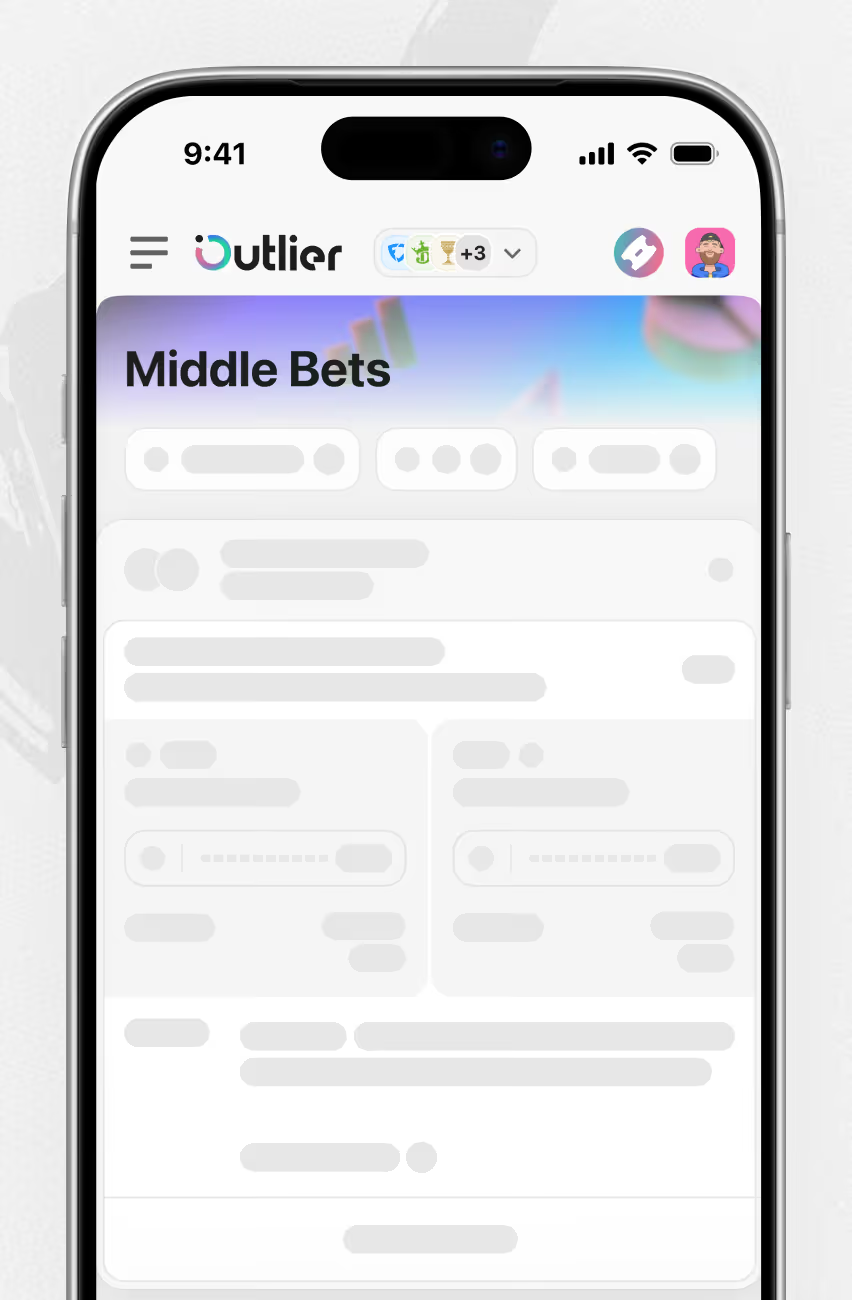
Wireframes mapping the grid behind the sportsbook dashboard, built for developers implementing dense odds tables. Column widths are measured in pixels and held consistent across EV+, Props, and Middle Bets on desktop and mobile.
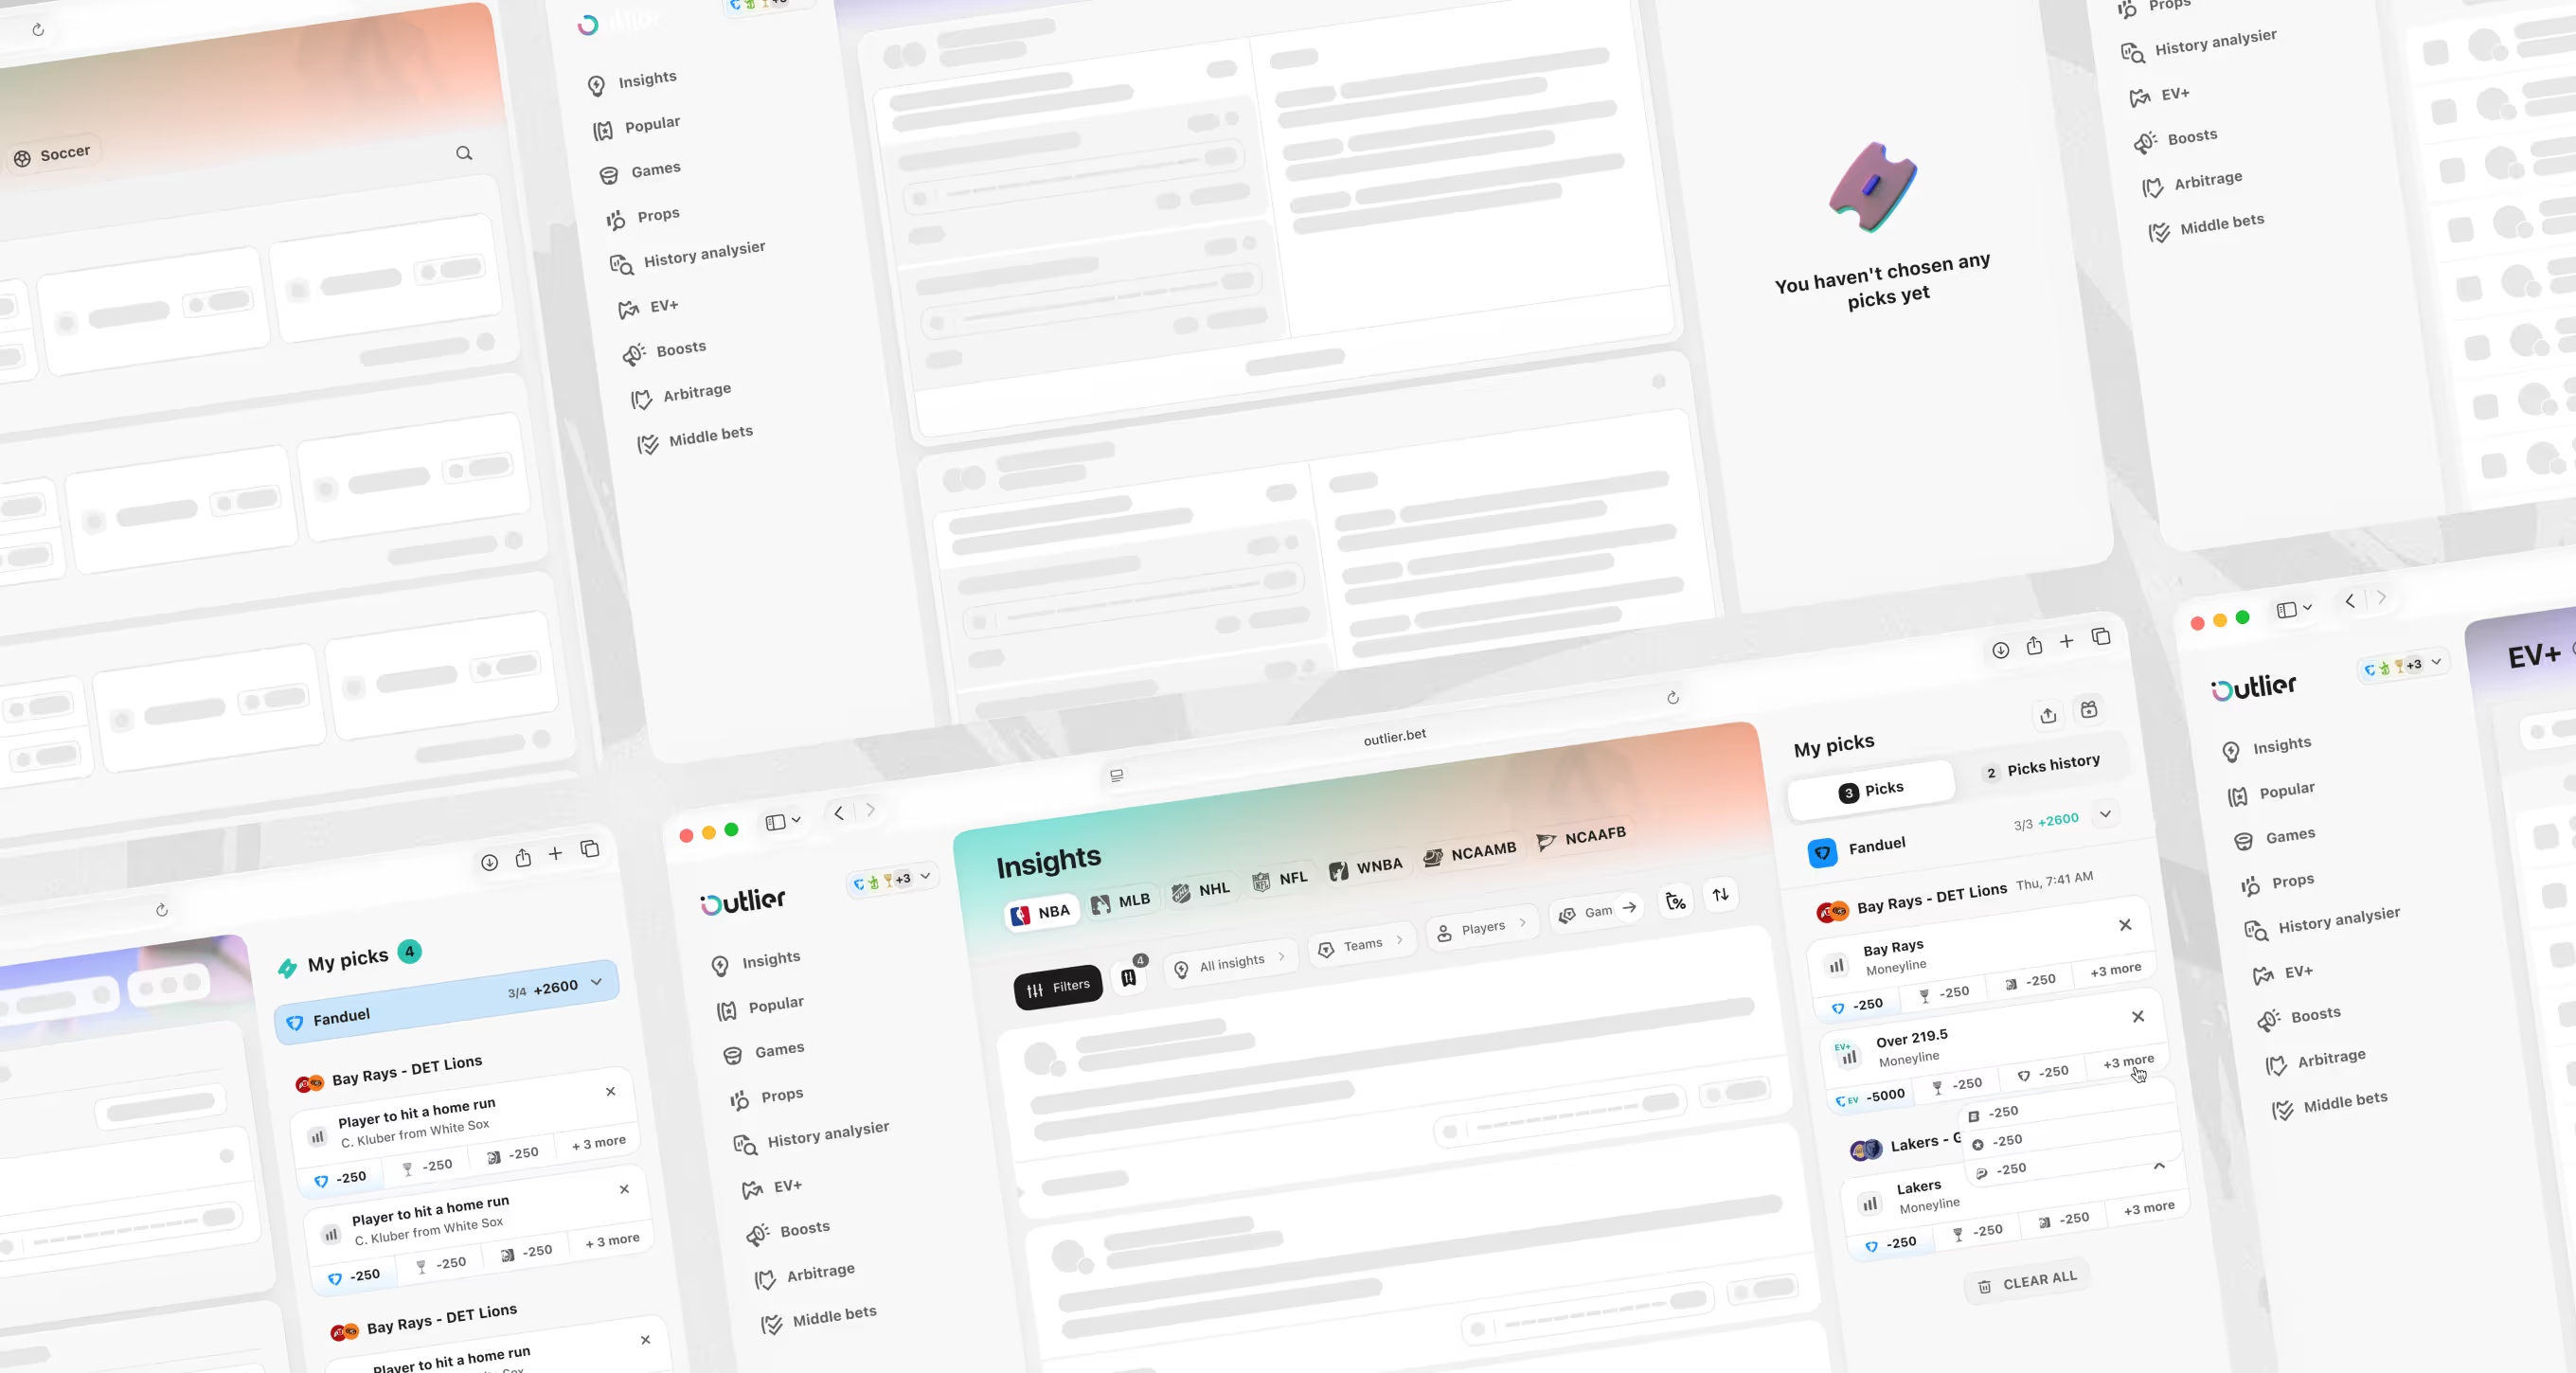
A custom icon library built for the sports betting dashboard, covering bookmarks, alerts, percentages, and calculations. A separate 3D icon set supports marketing and empty-state screens.



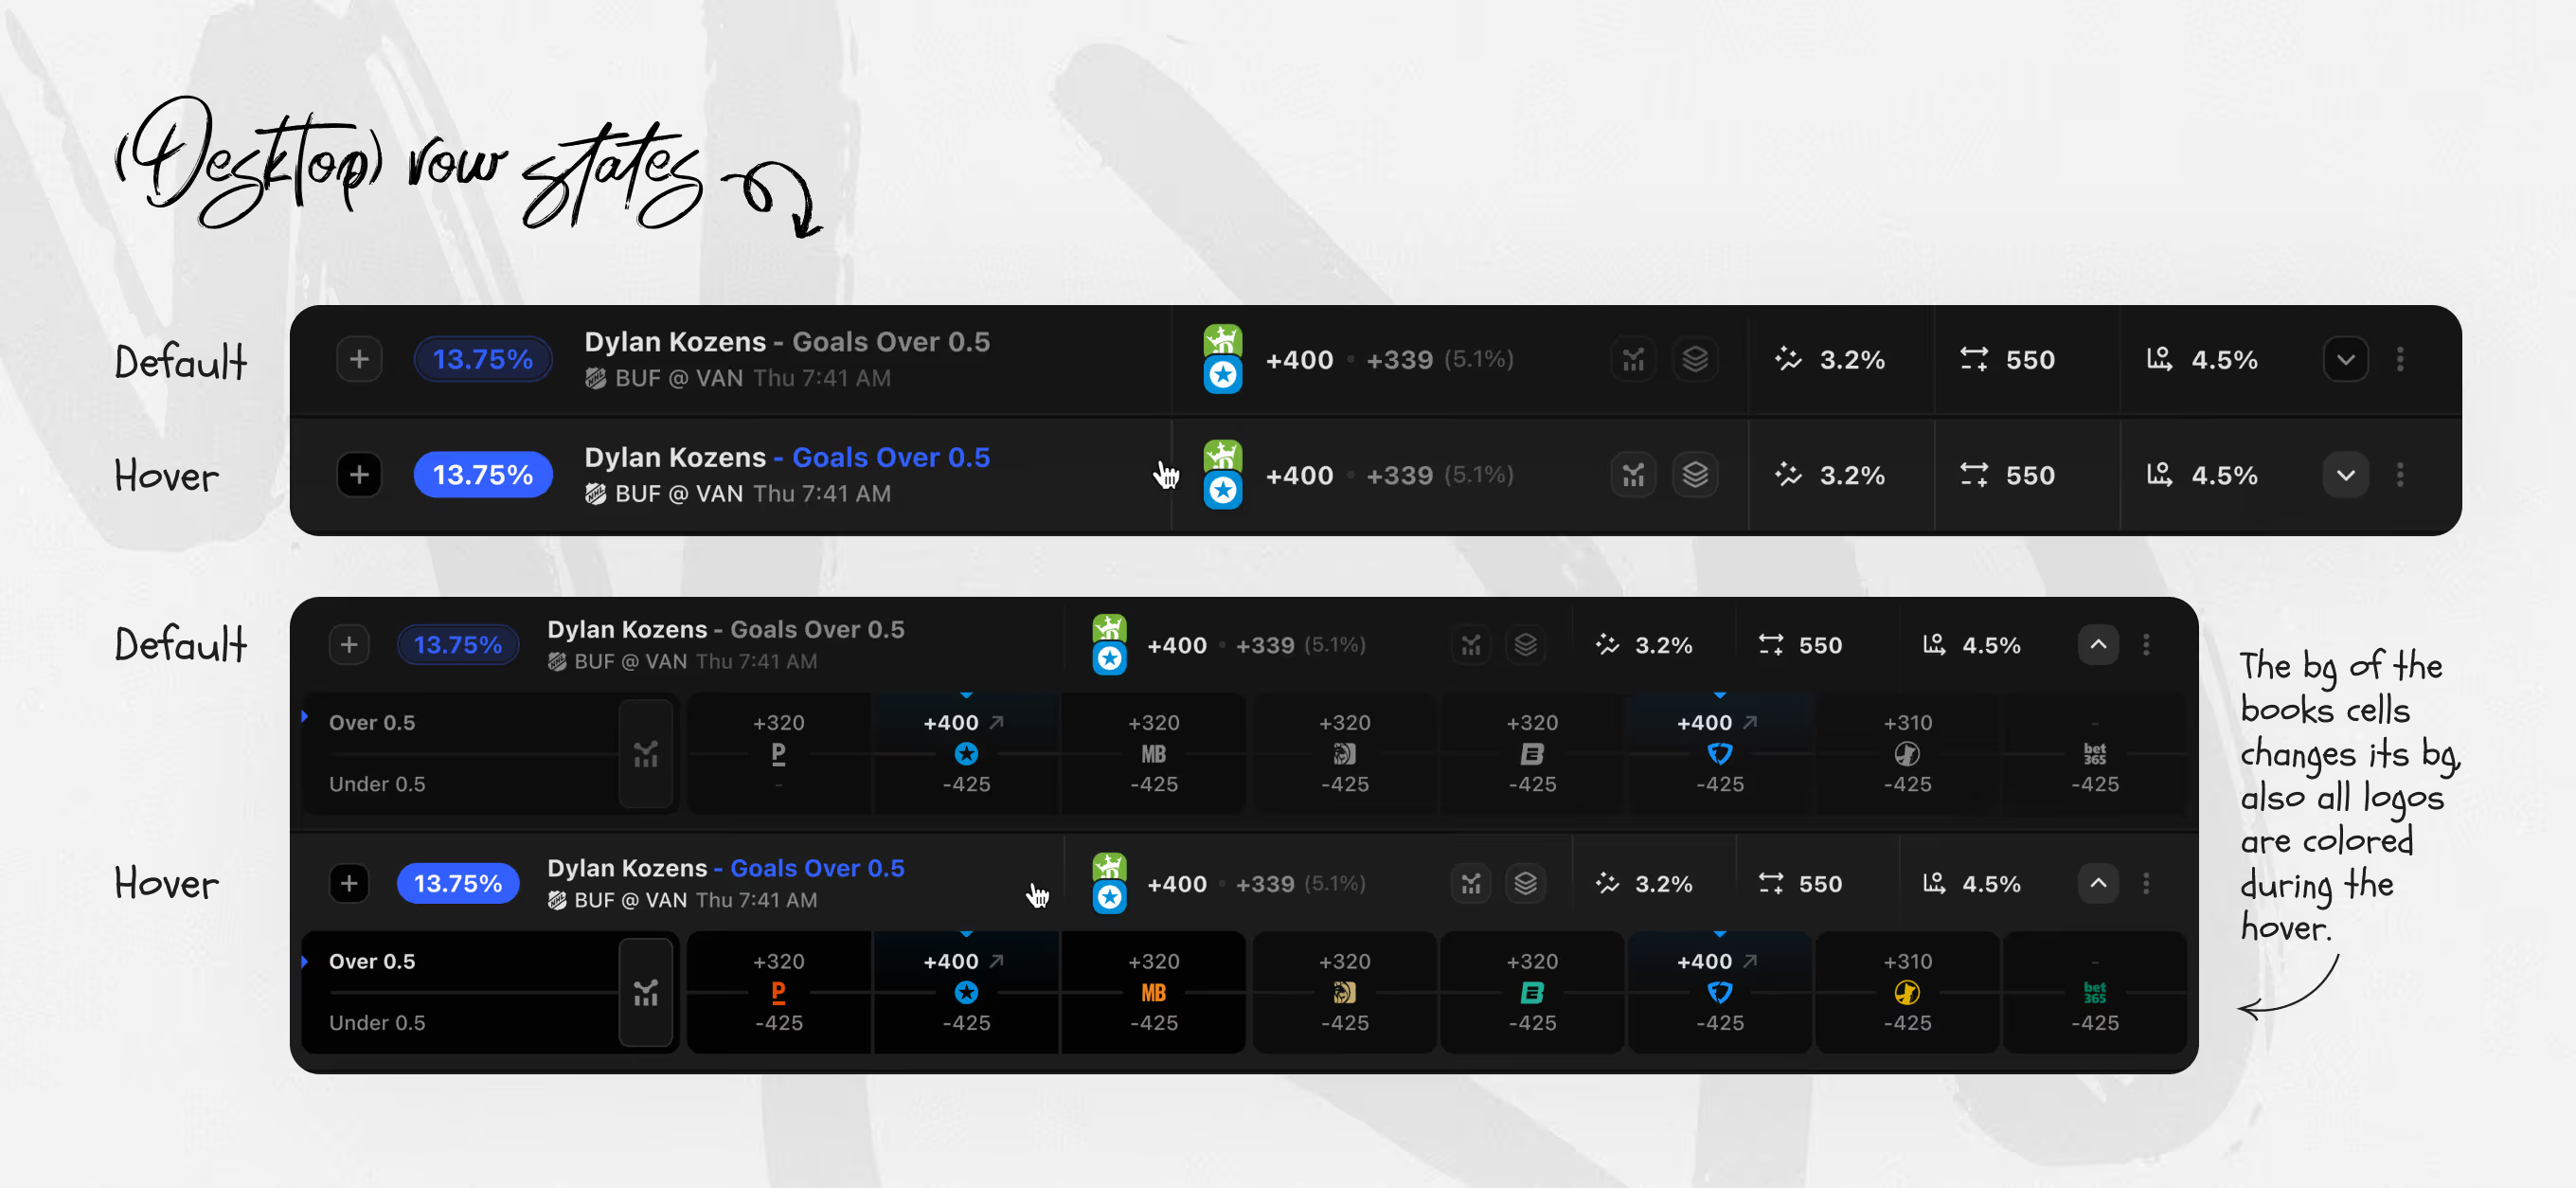
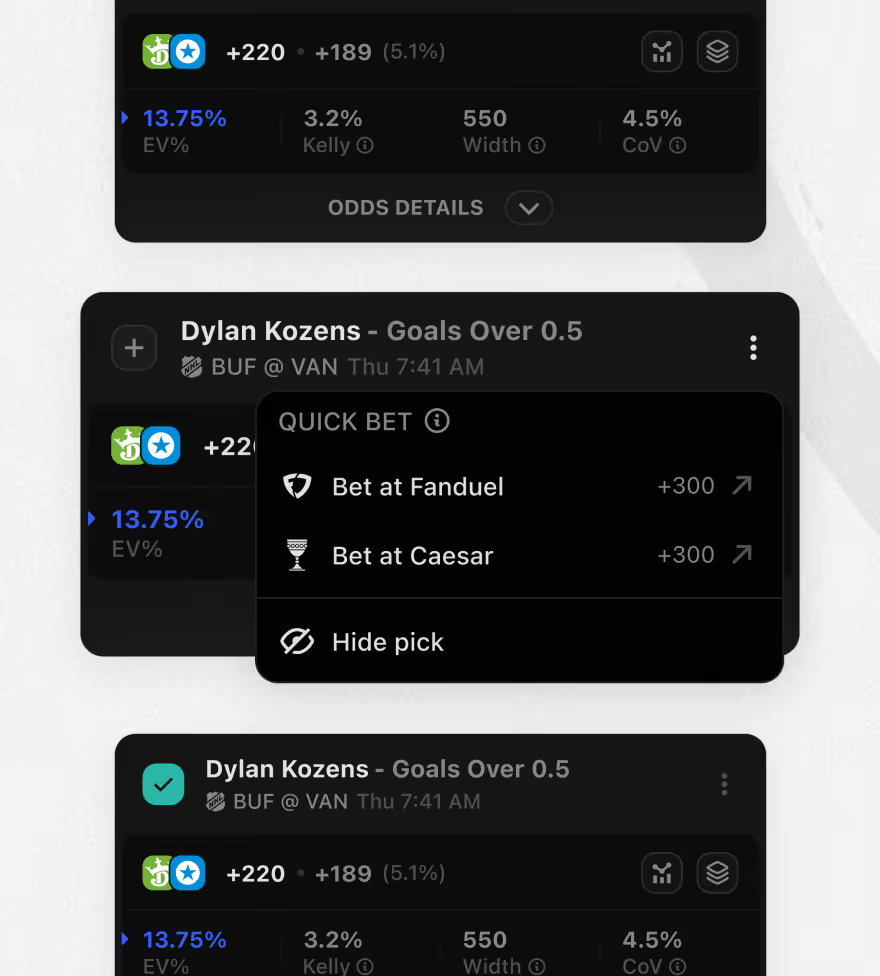
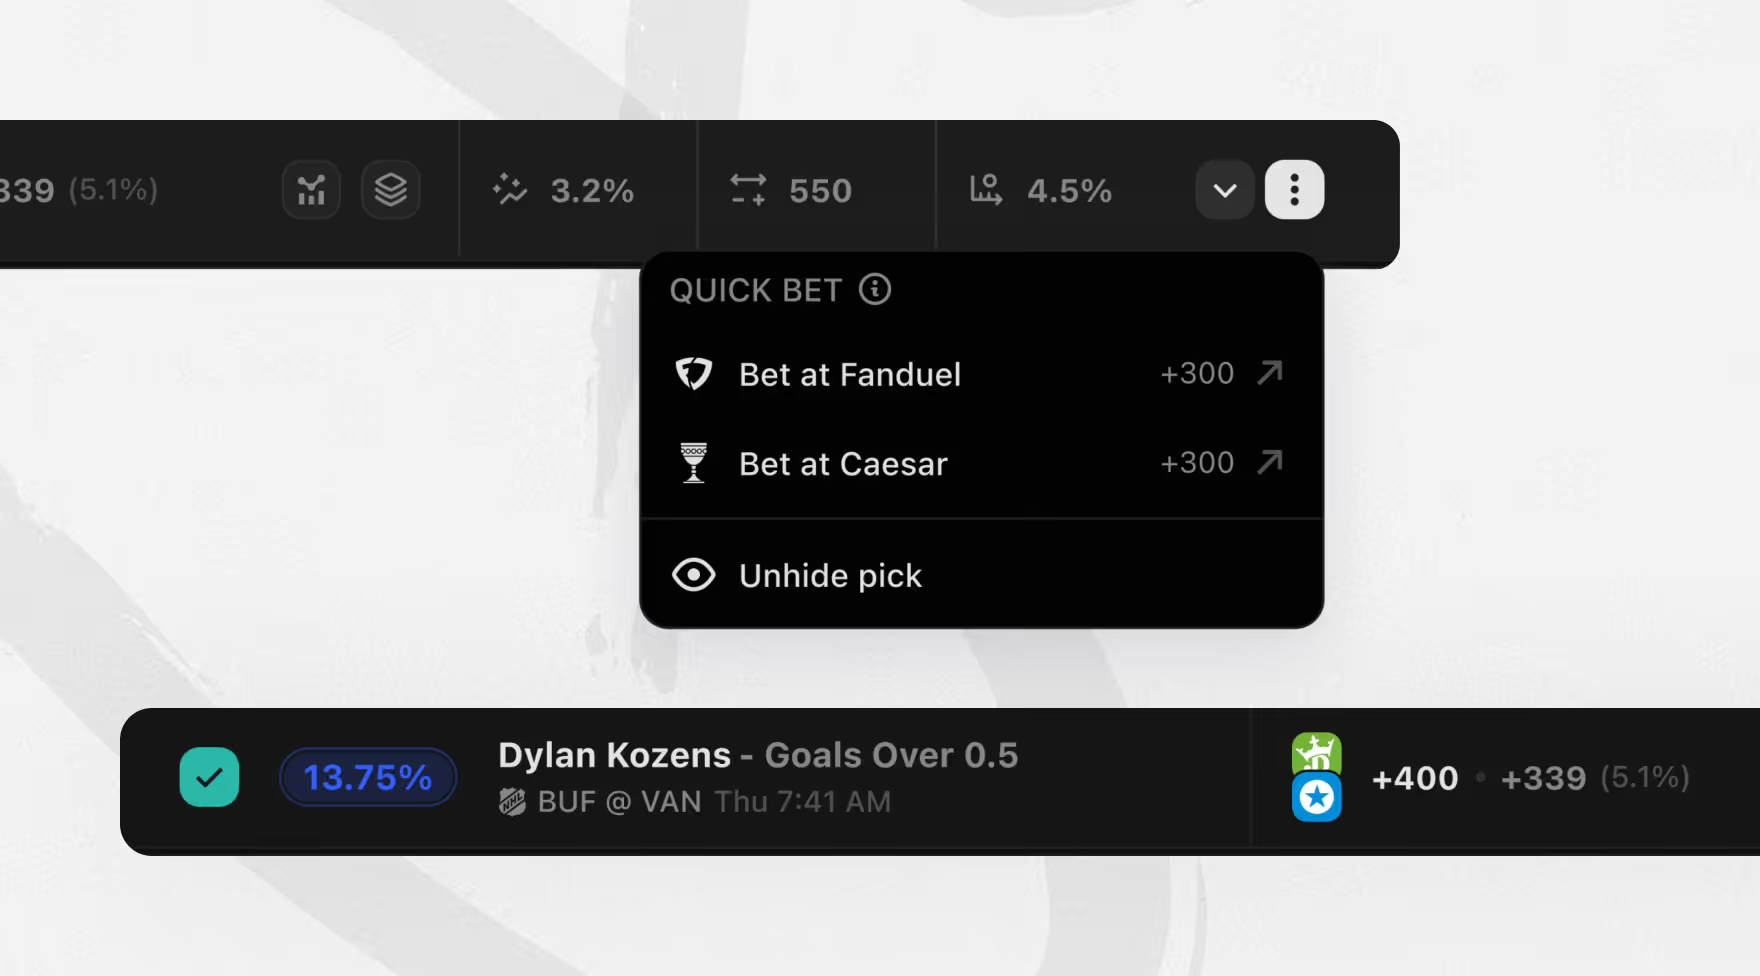
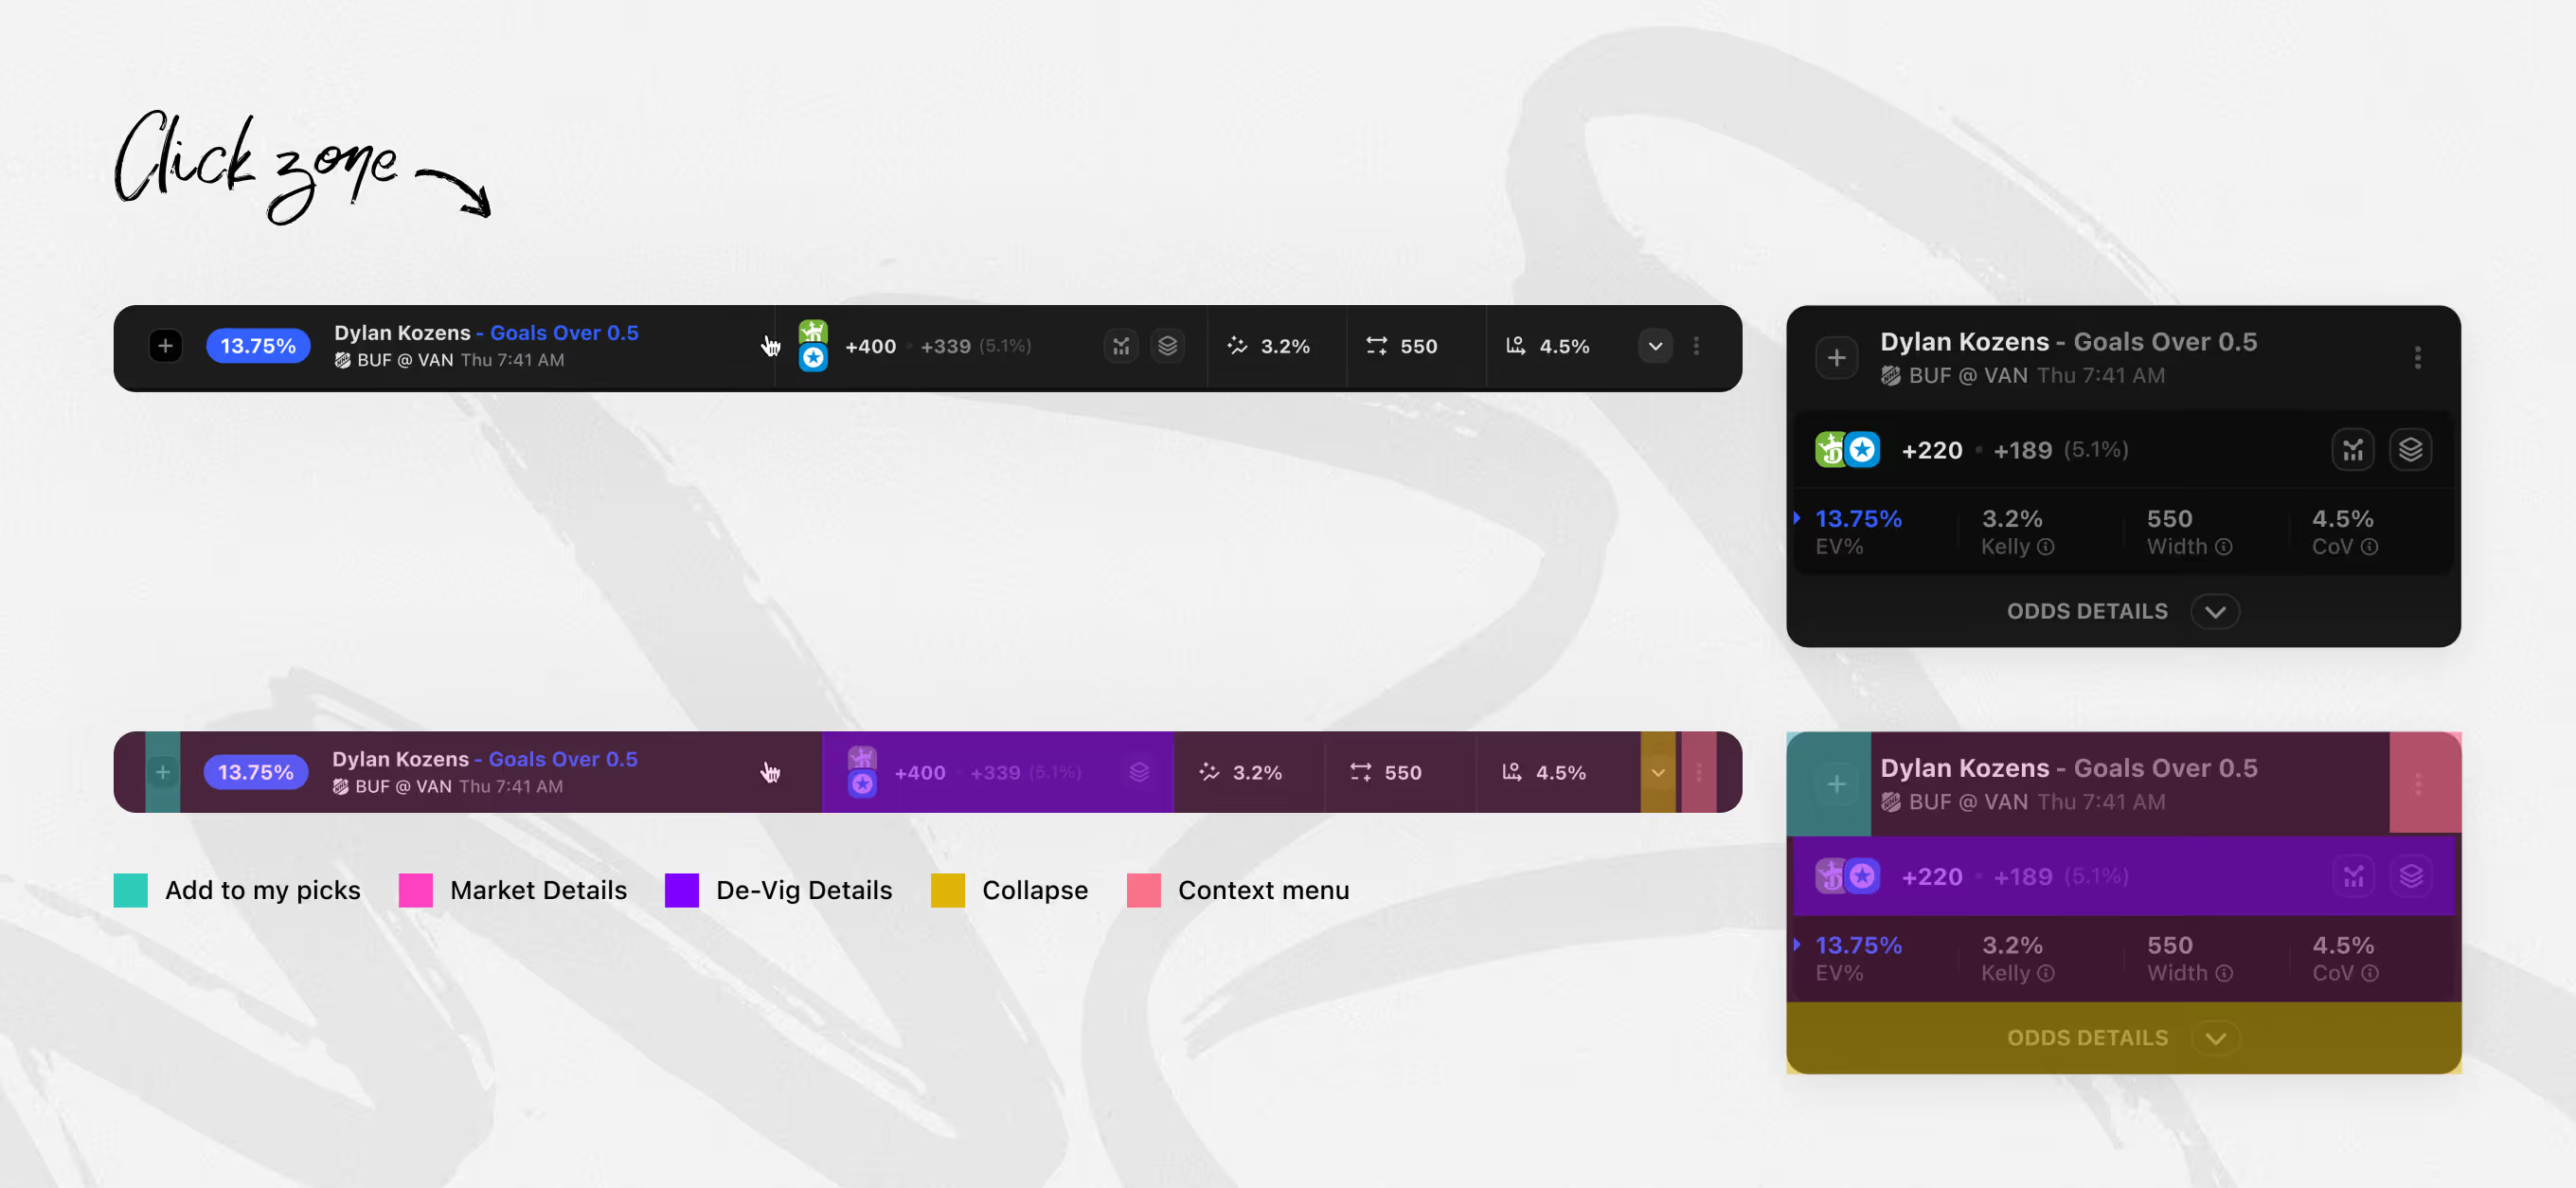
Interaction states for each odds row, built so bettors can compare sportsbooks without missing a click. Hover recolors rows and logos; a Quick Bet menu links to bookmakers; click zones separate De-Vig and Market Details.
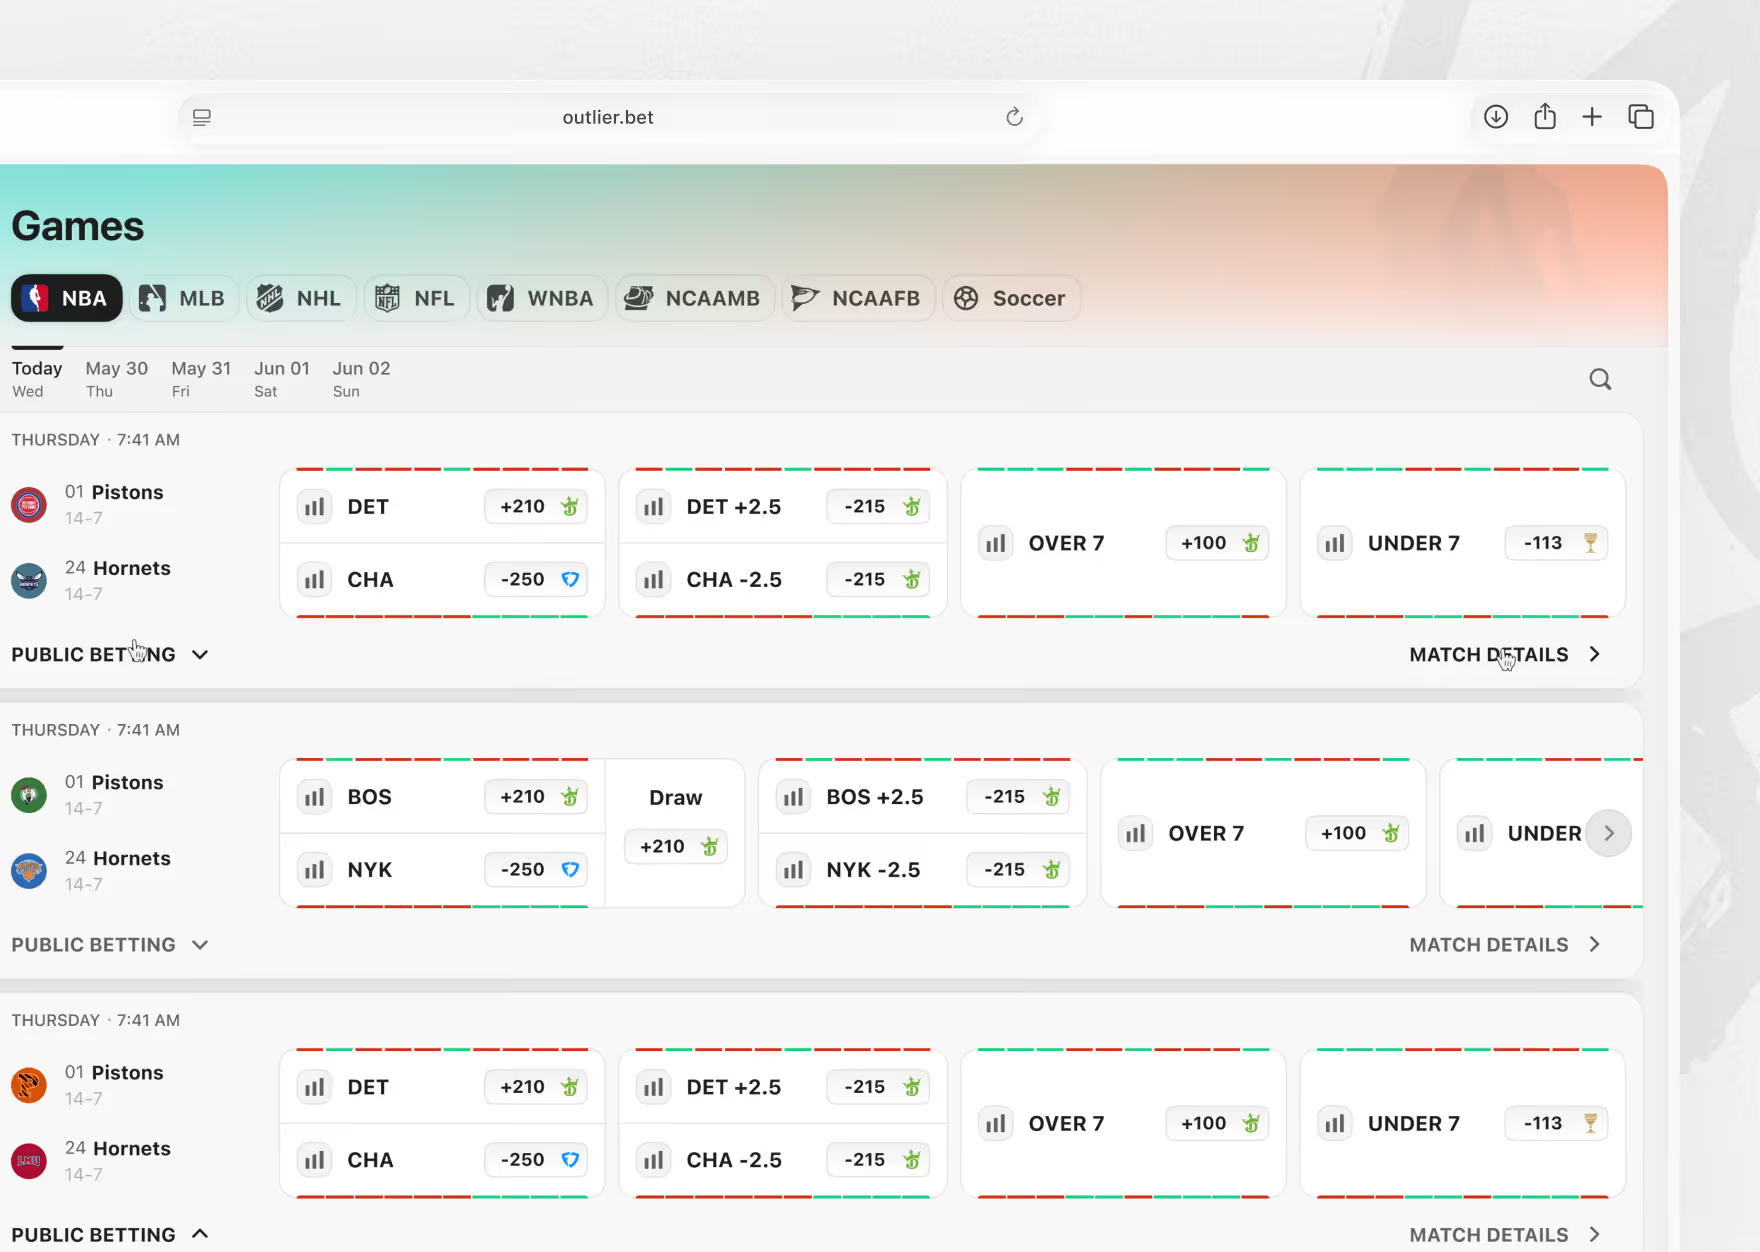
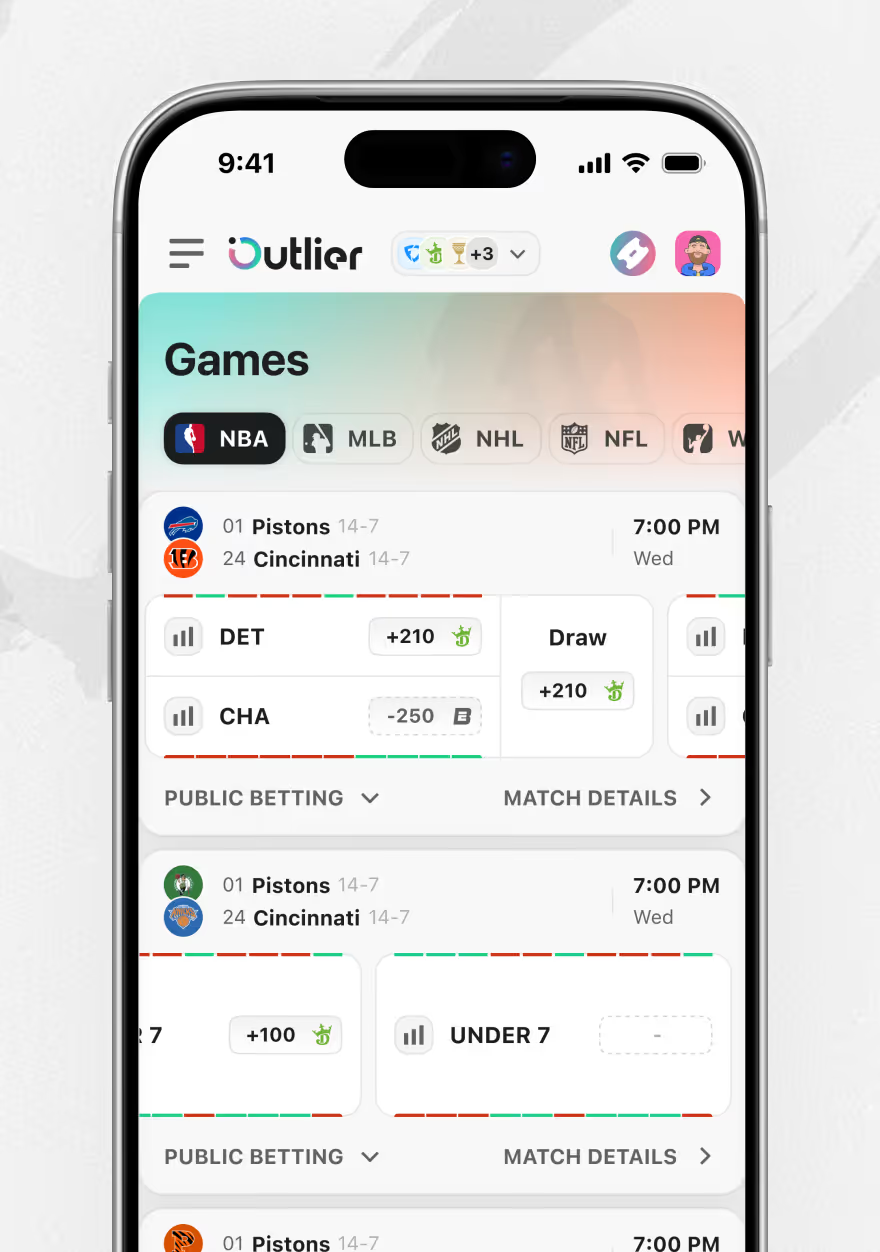
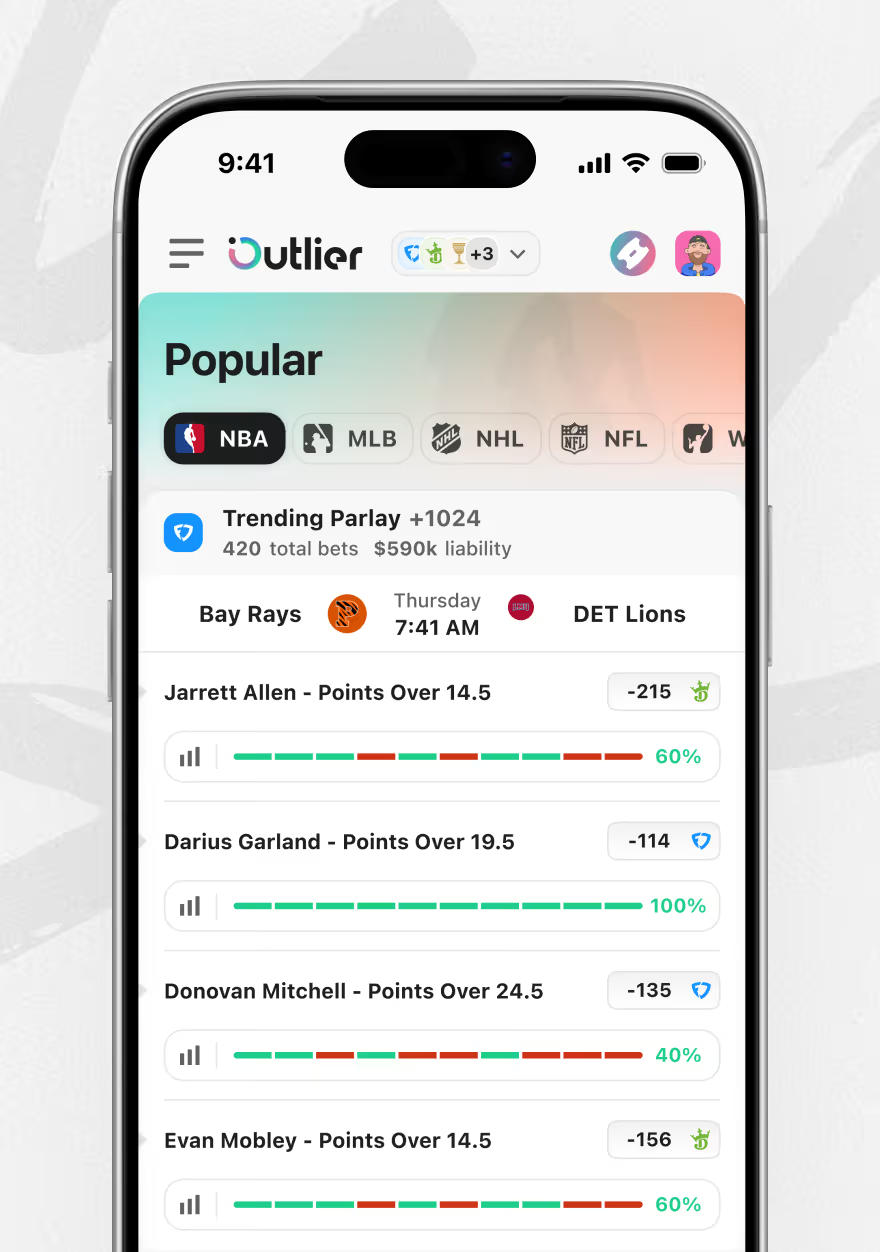
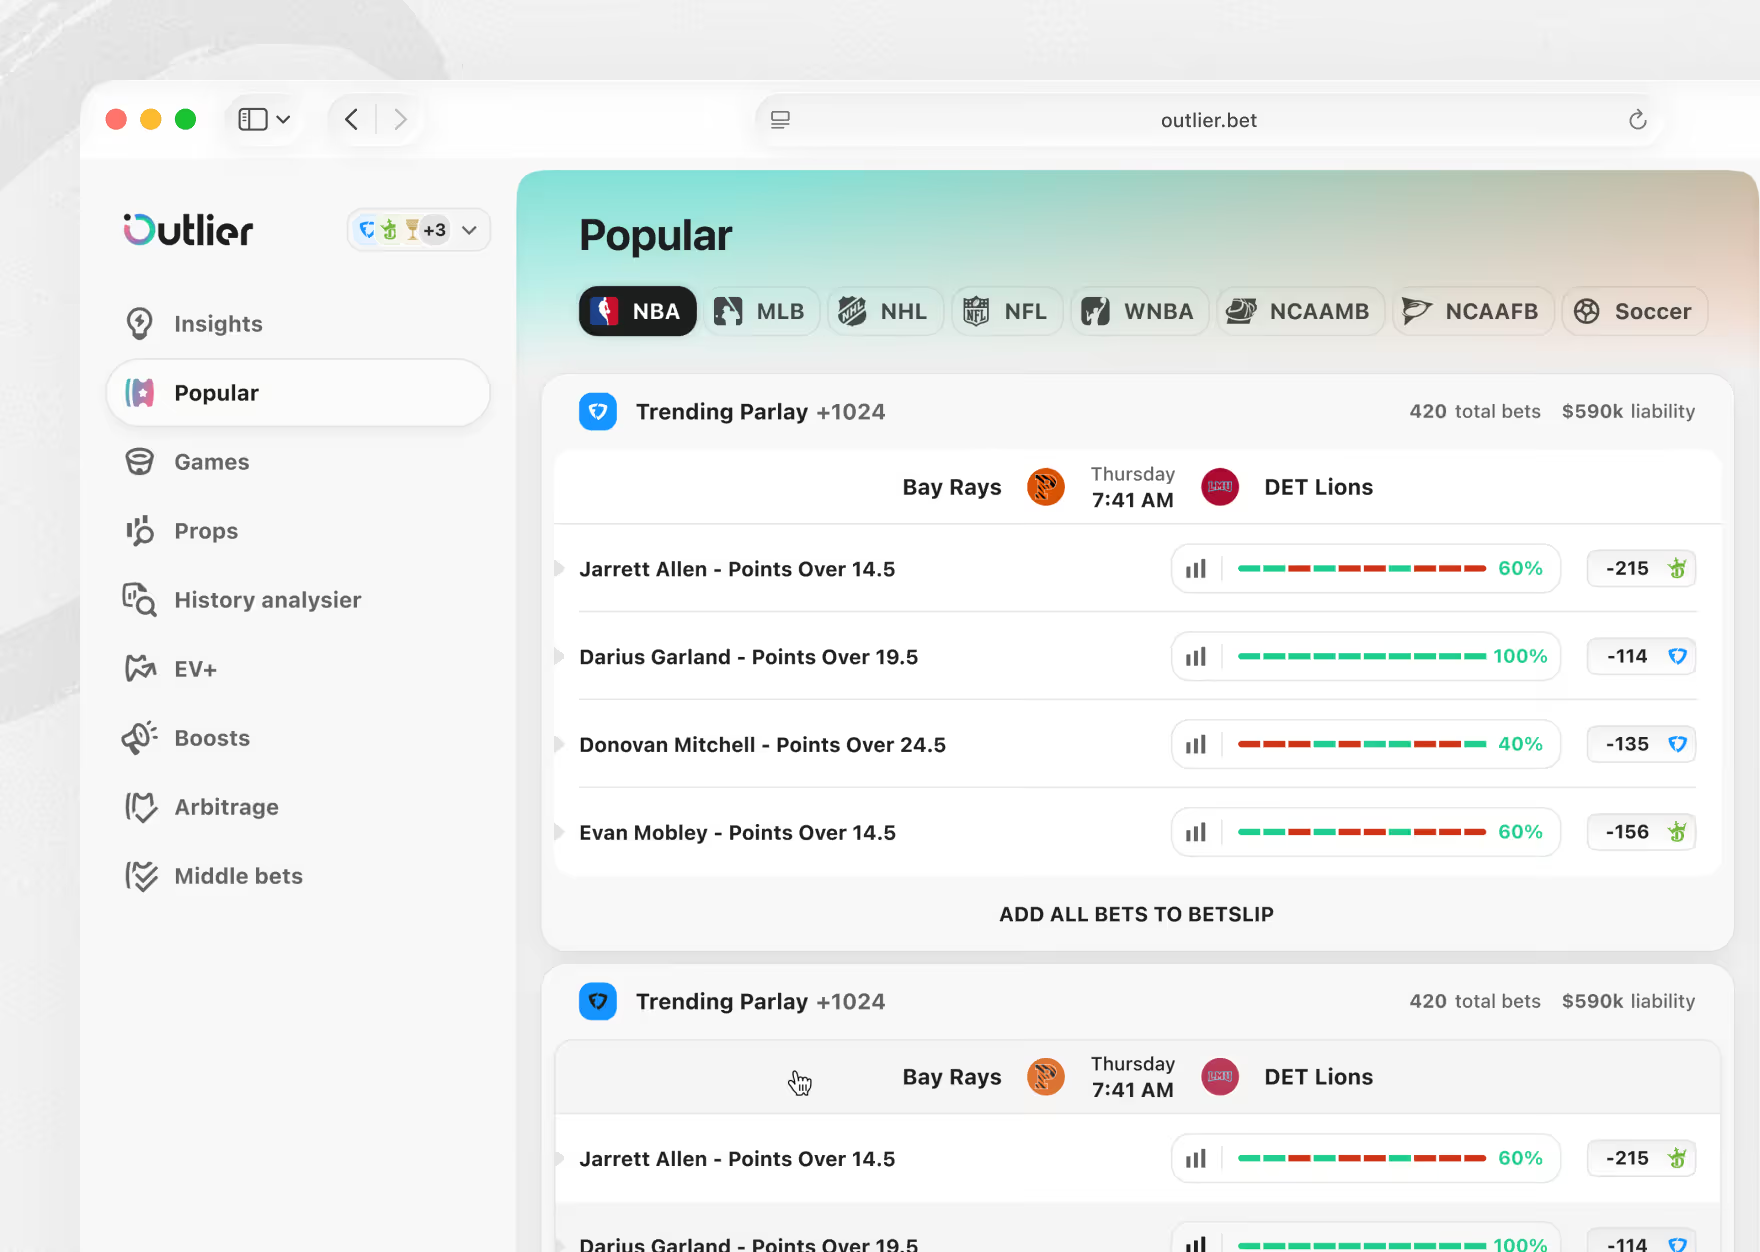
A cross-sport games list inside the sports betting analytics platform,covering multiple sports and leagues. Each row surfaces moneyline, spread, and total odds, plus public betting splits.
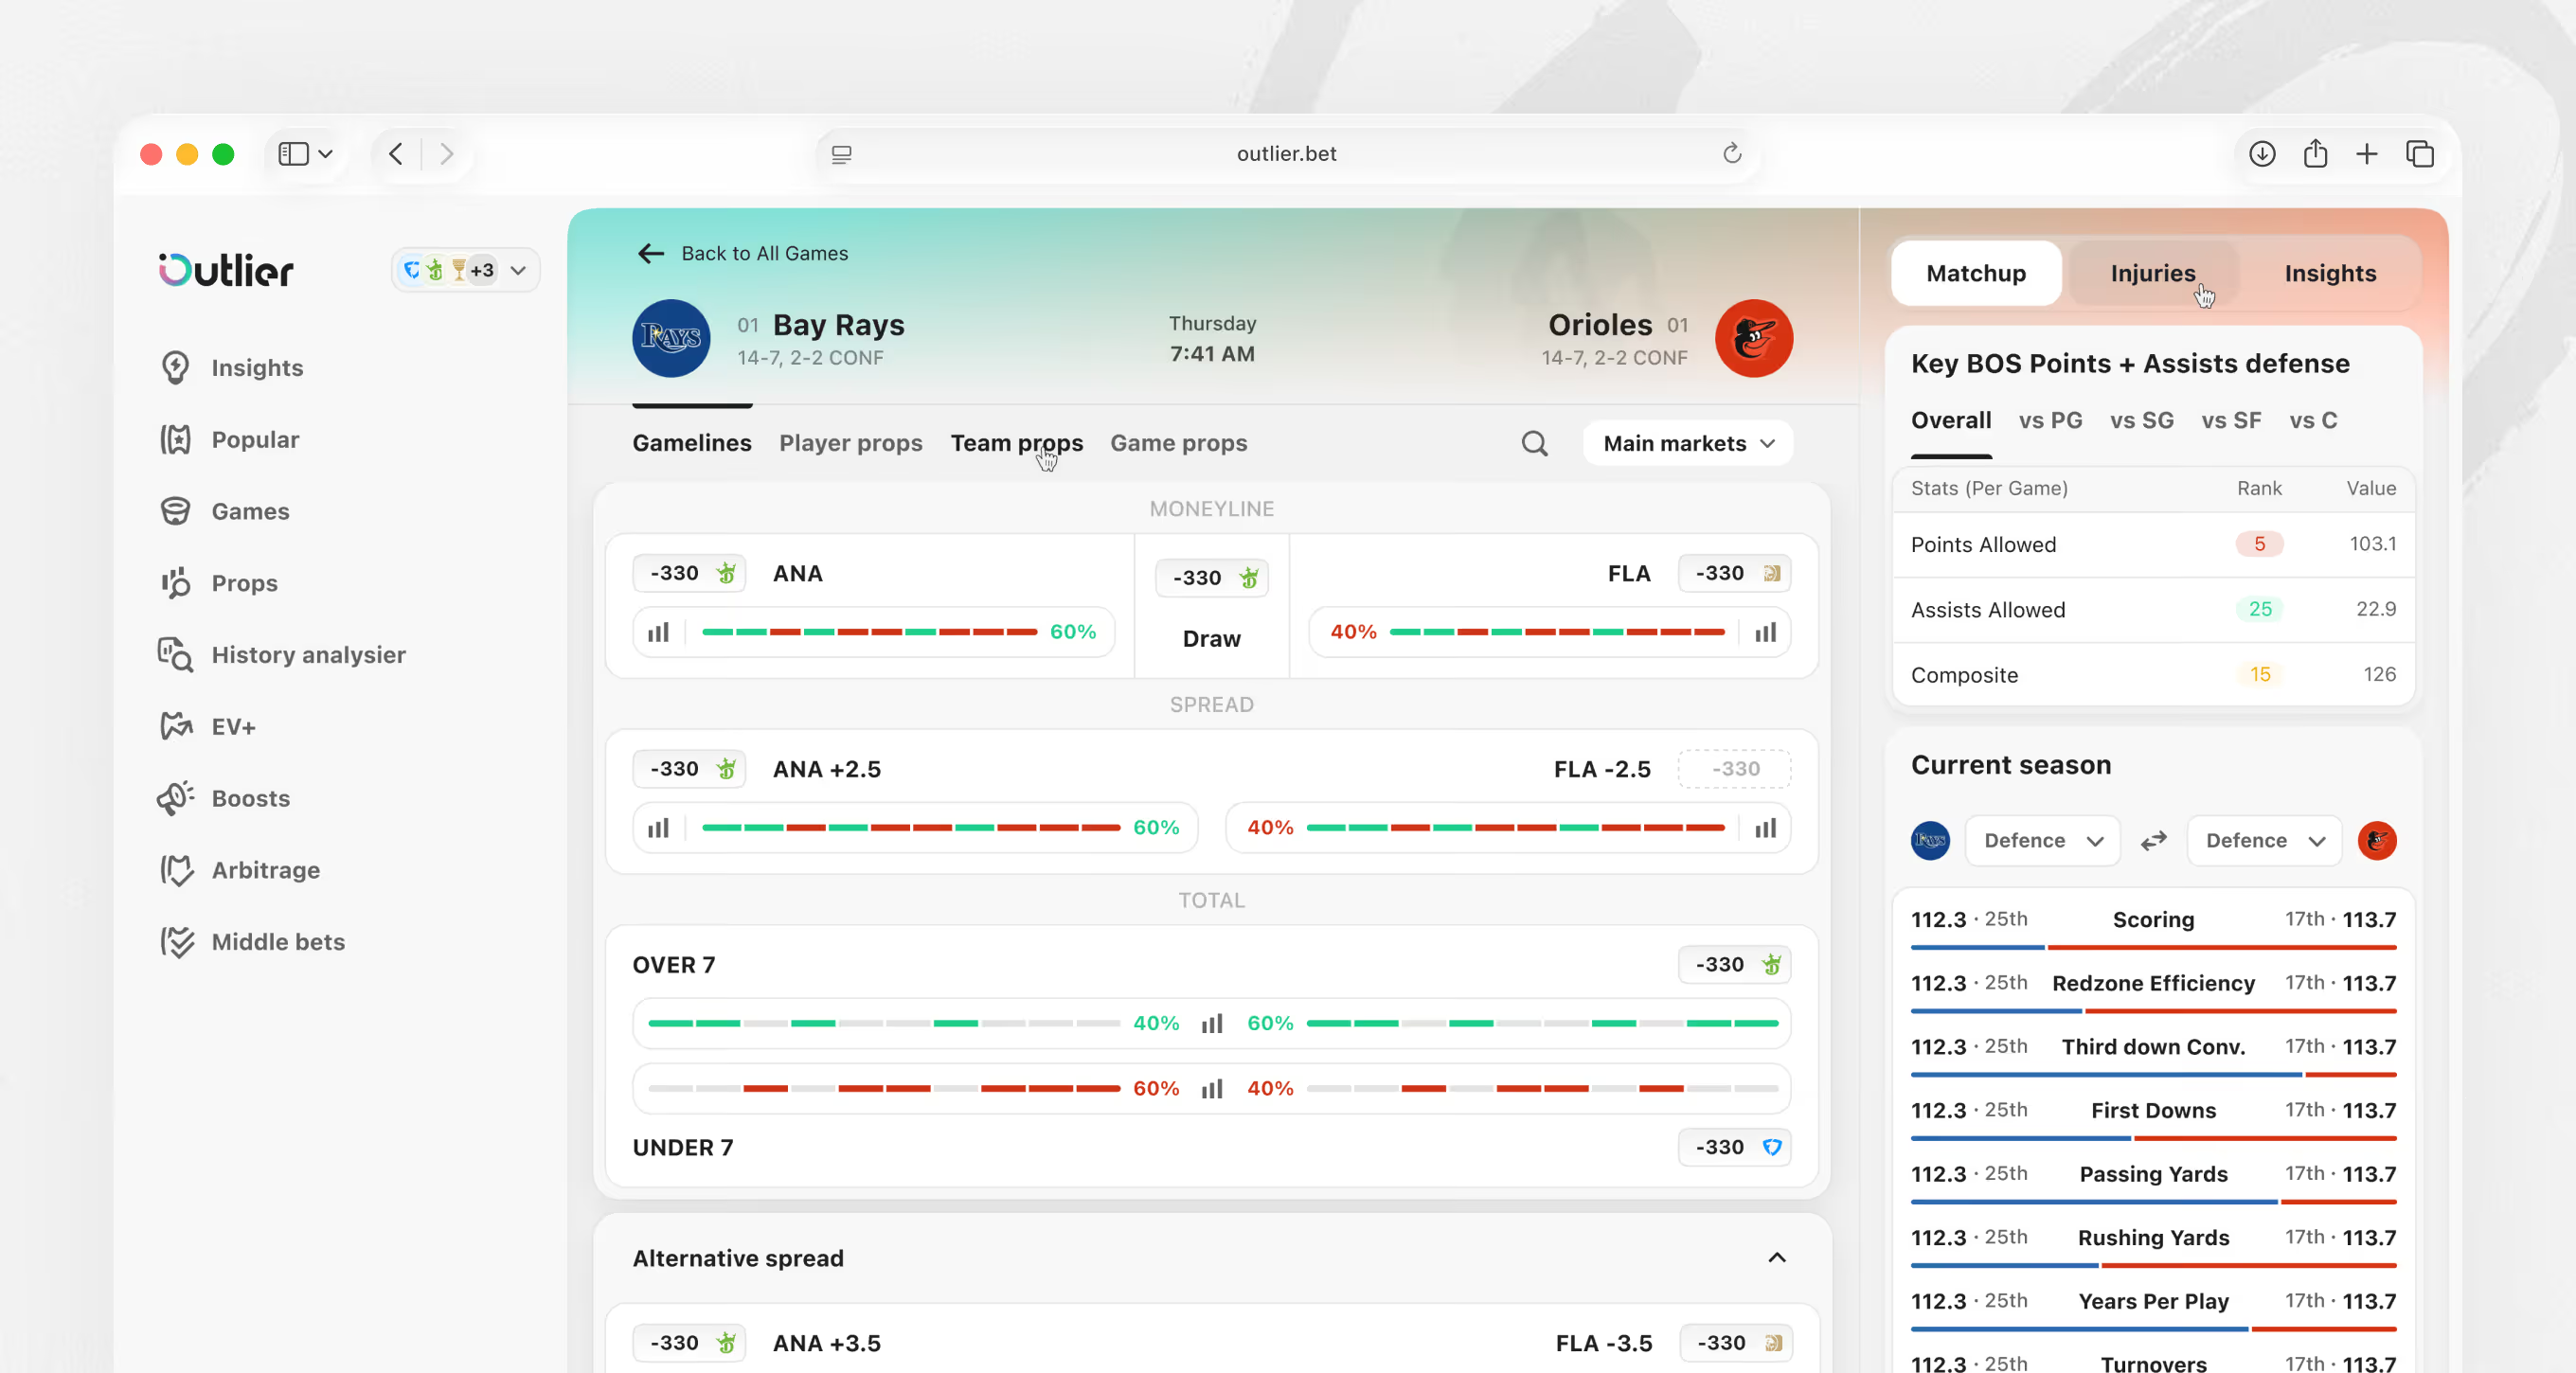
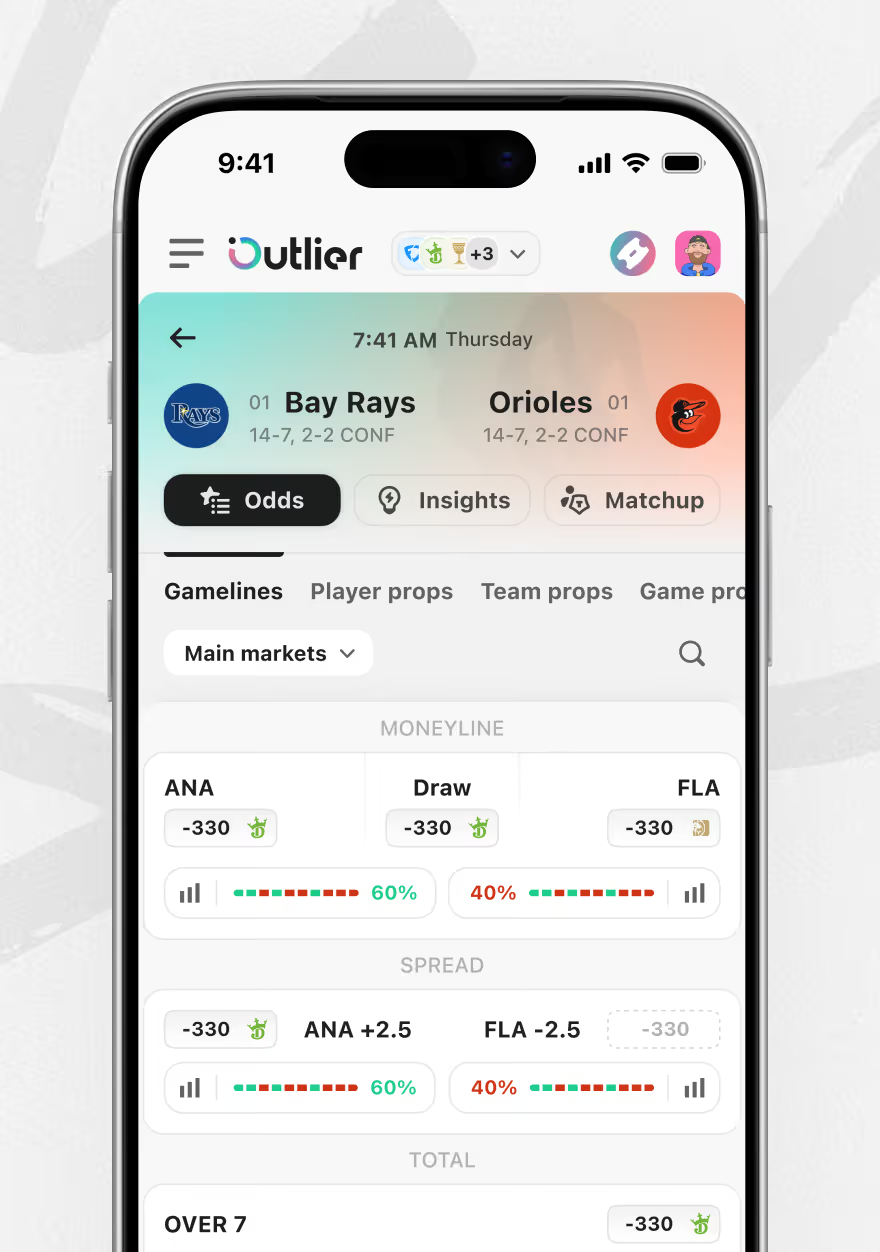
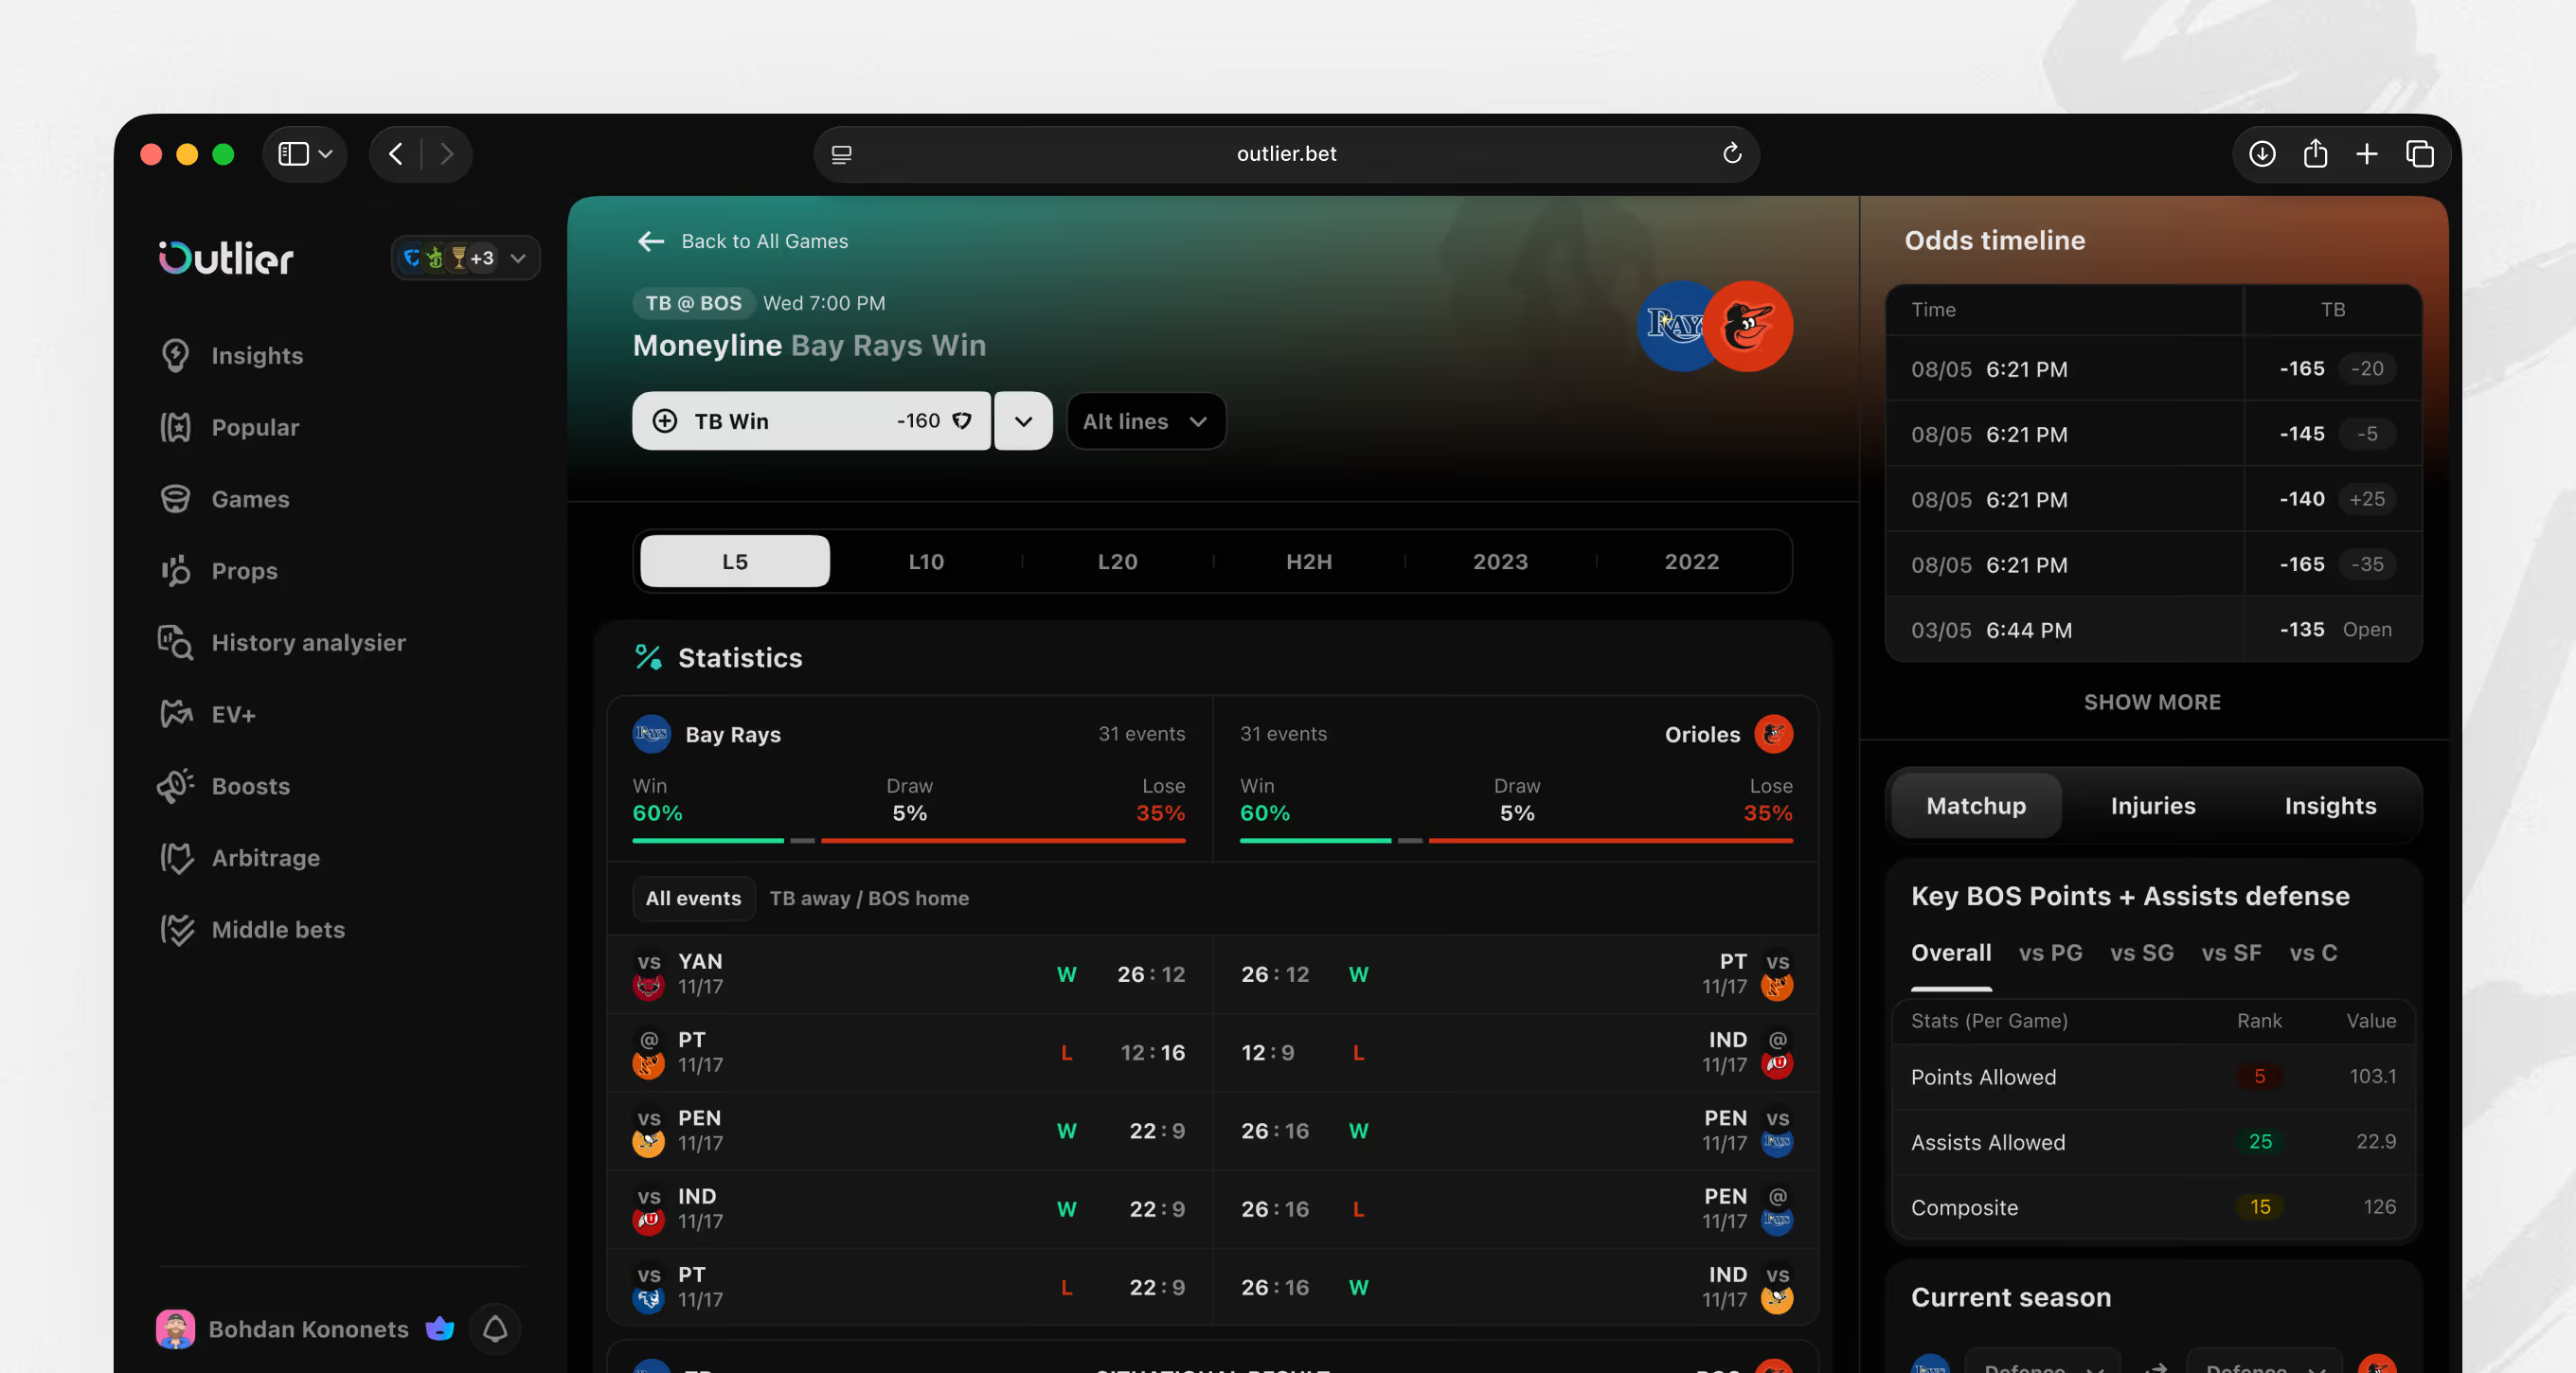
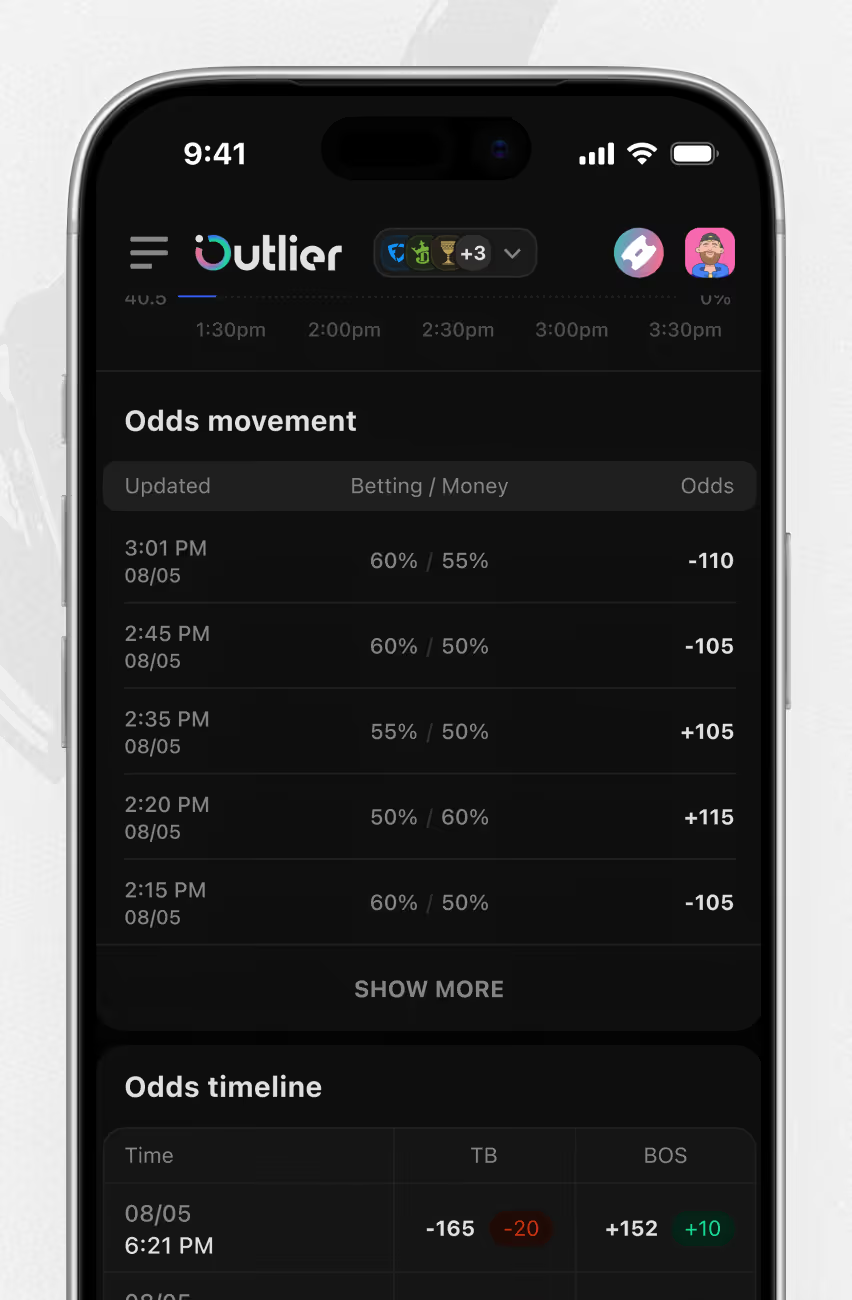
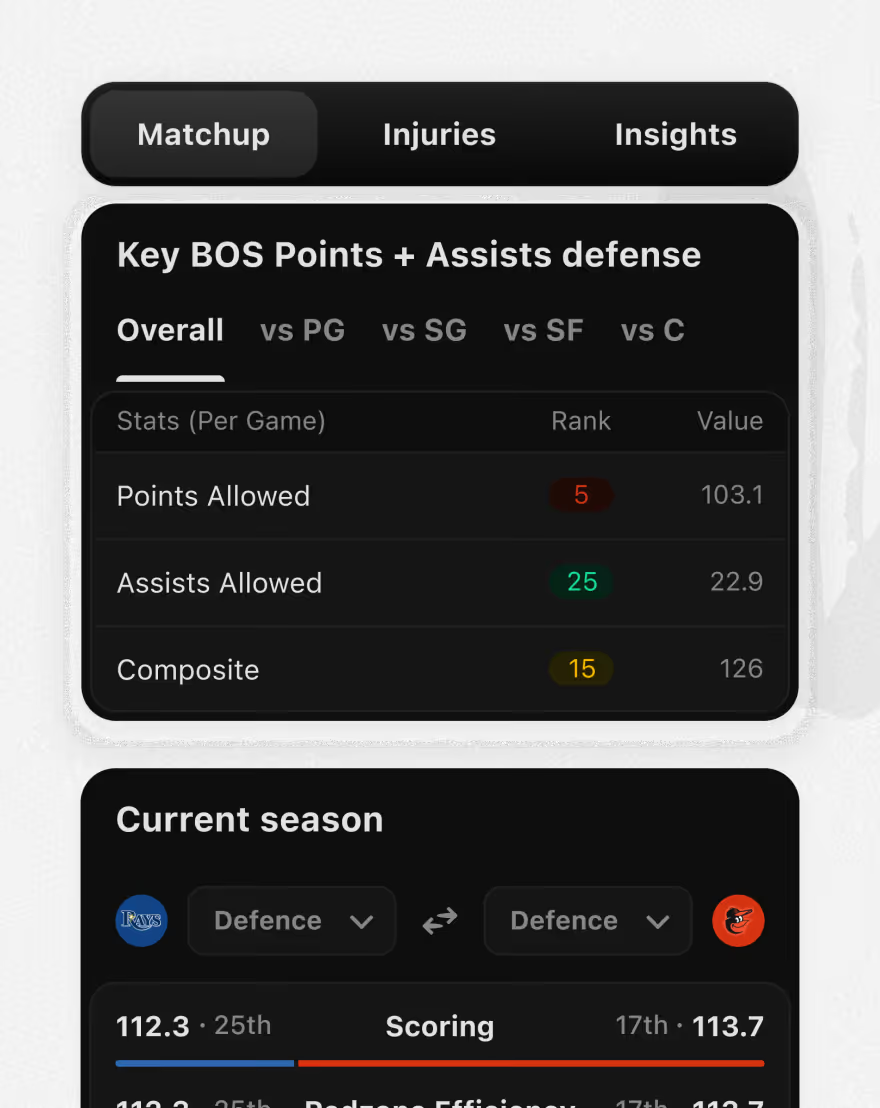
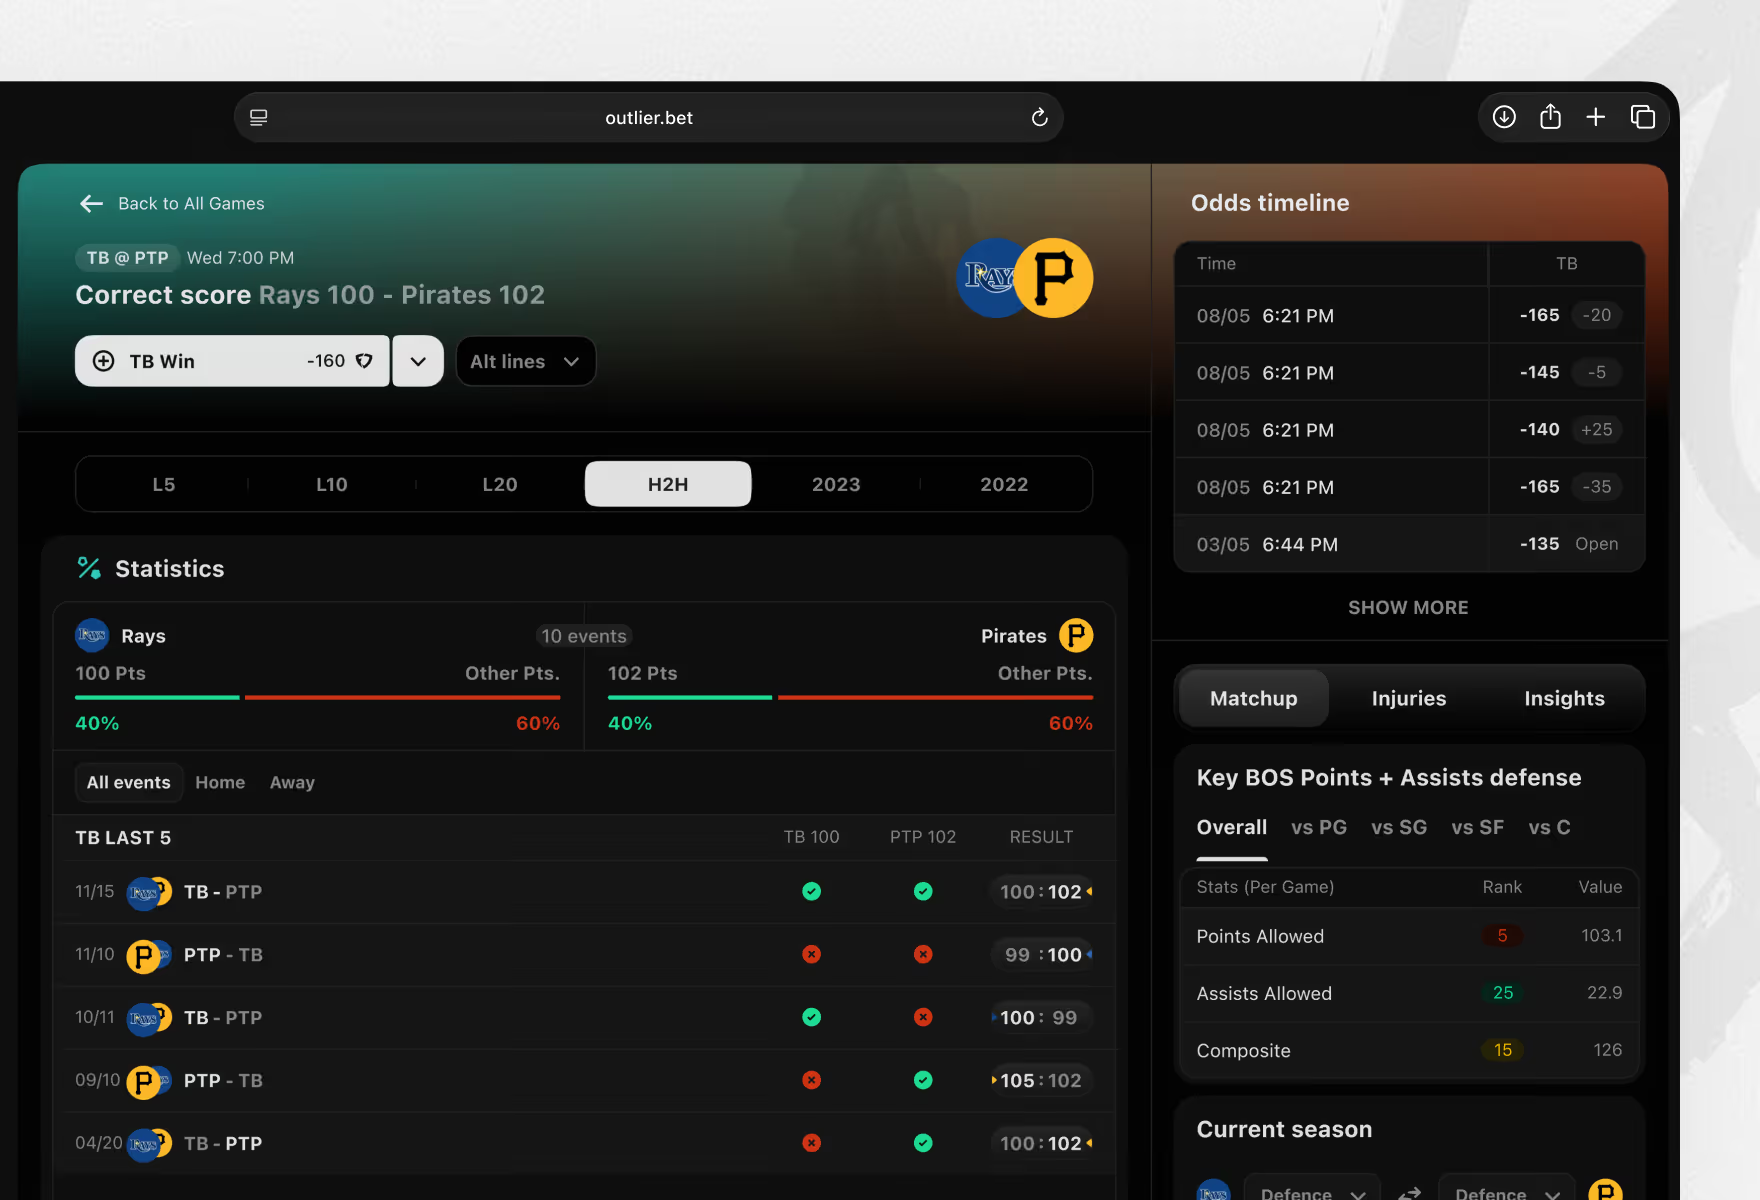
The single-game view a bettor opens before placing a bet, covering one matchup at a time. Gamelines, Player Props, Team Props, and Game Props sit in tabs, next to a panel with injury and position-based defense stats.
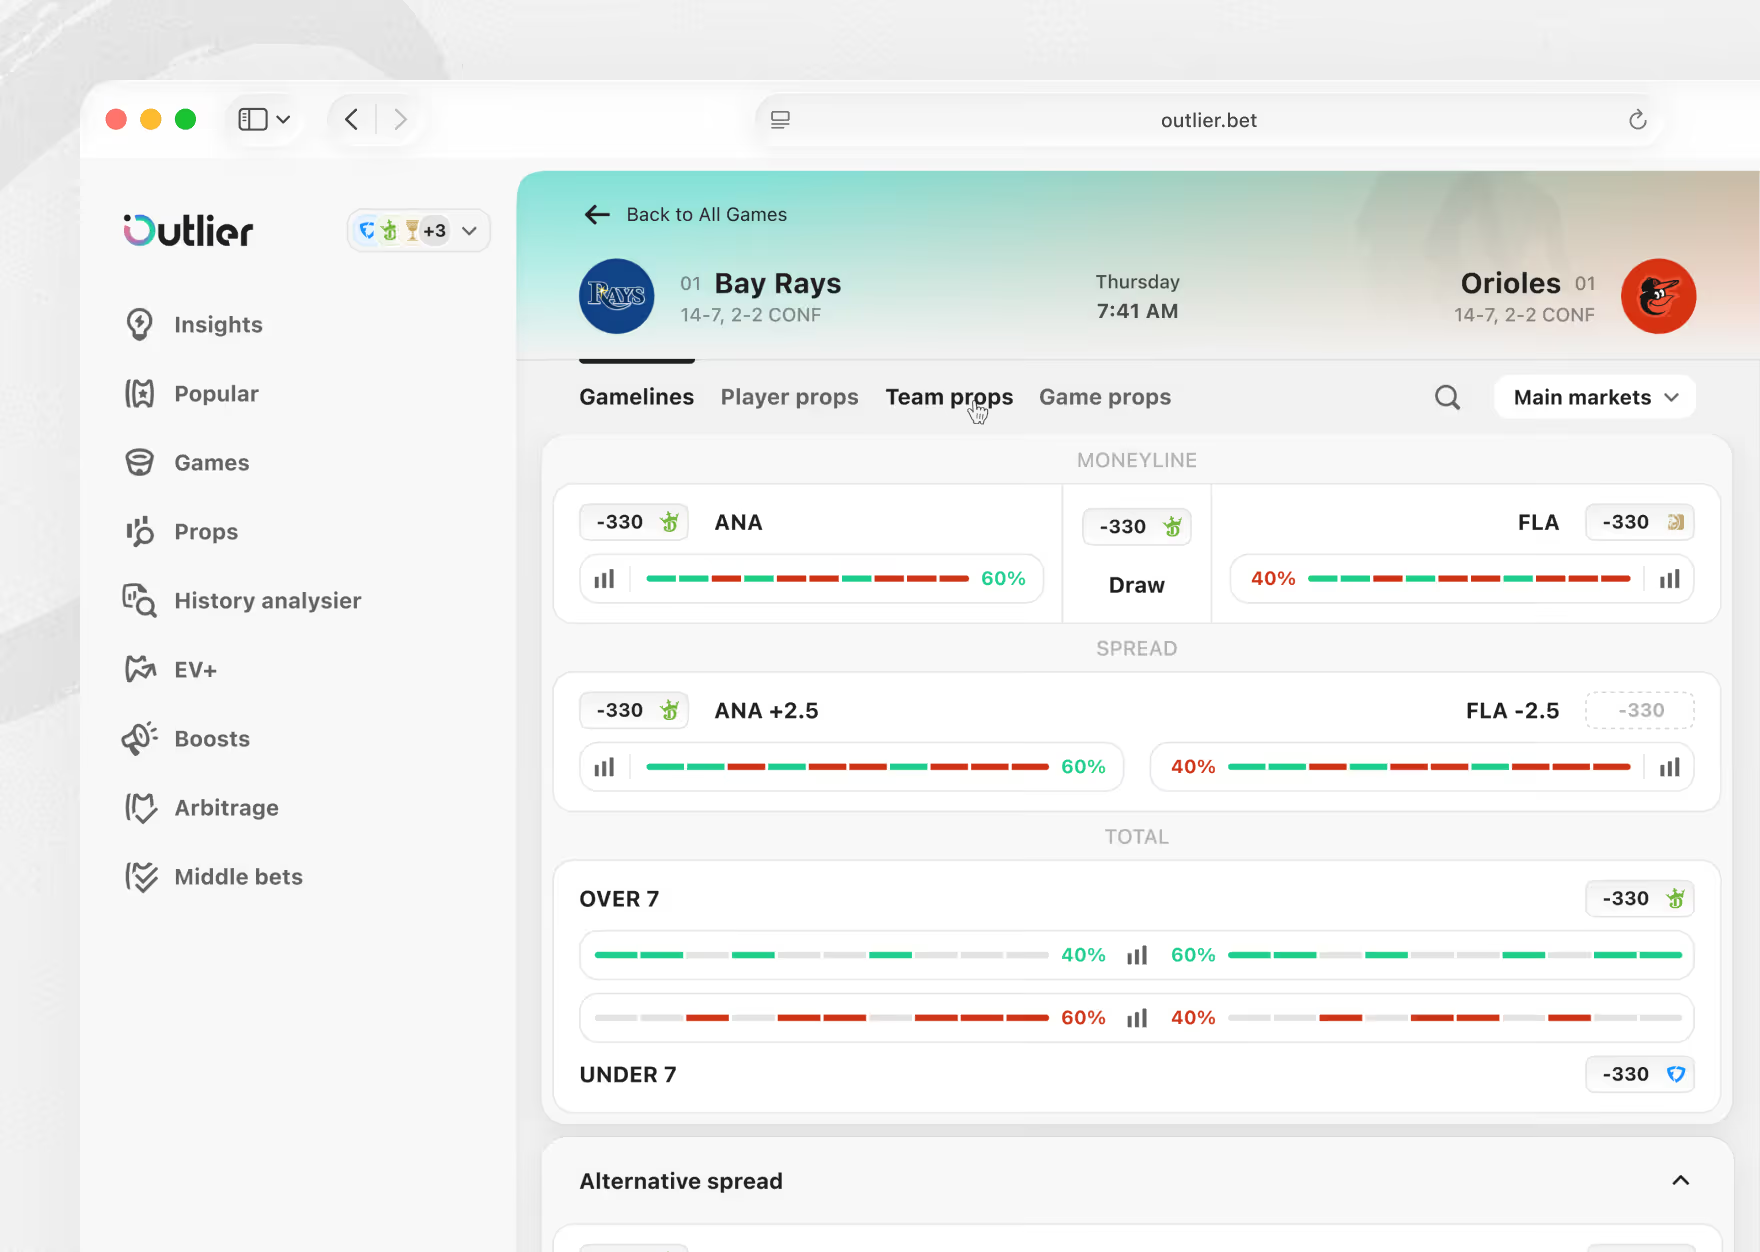
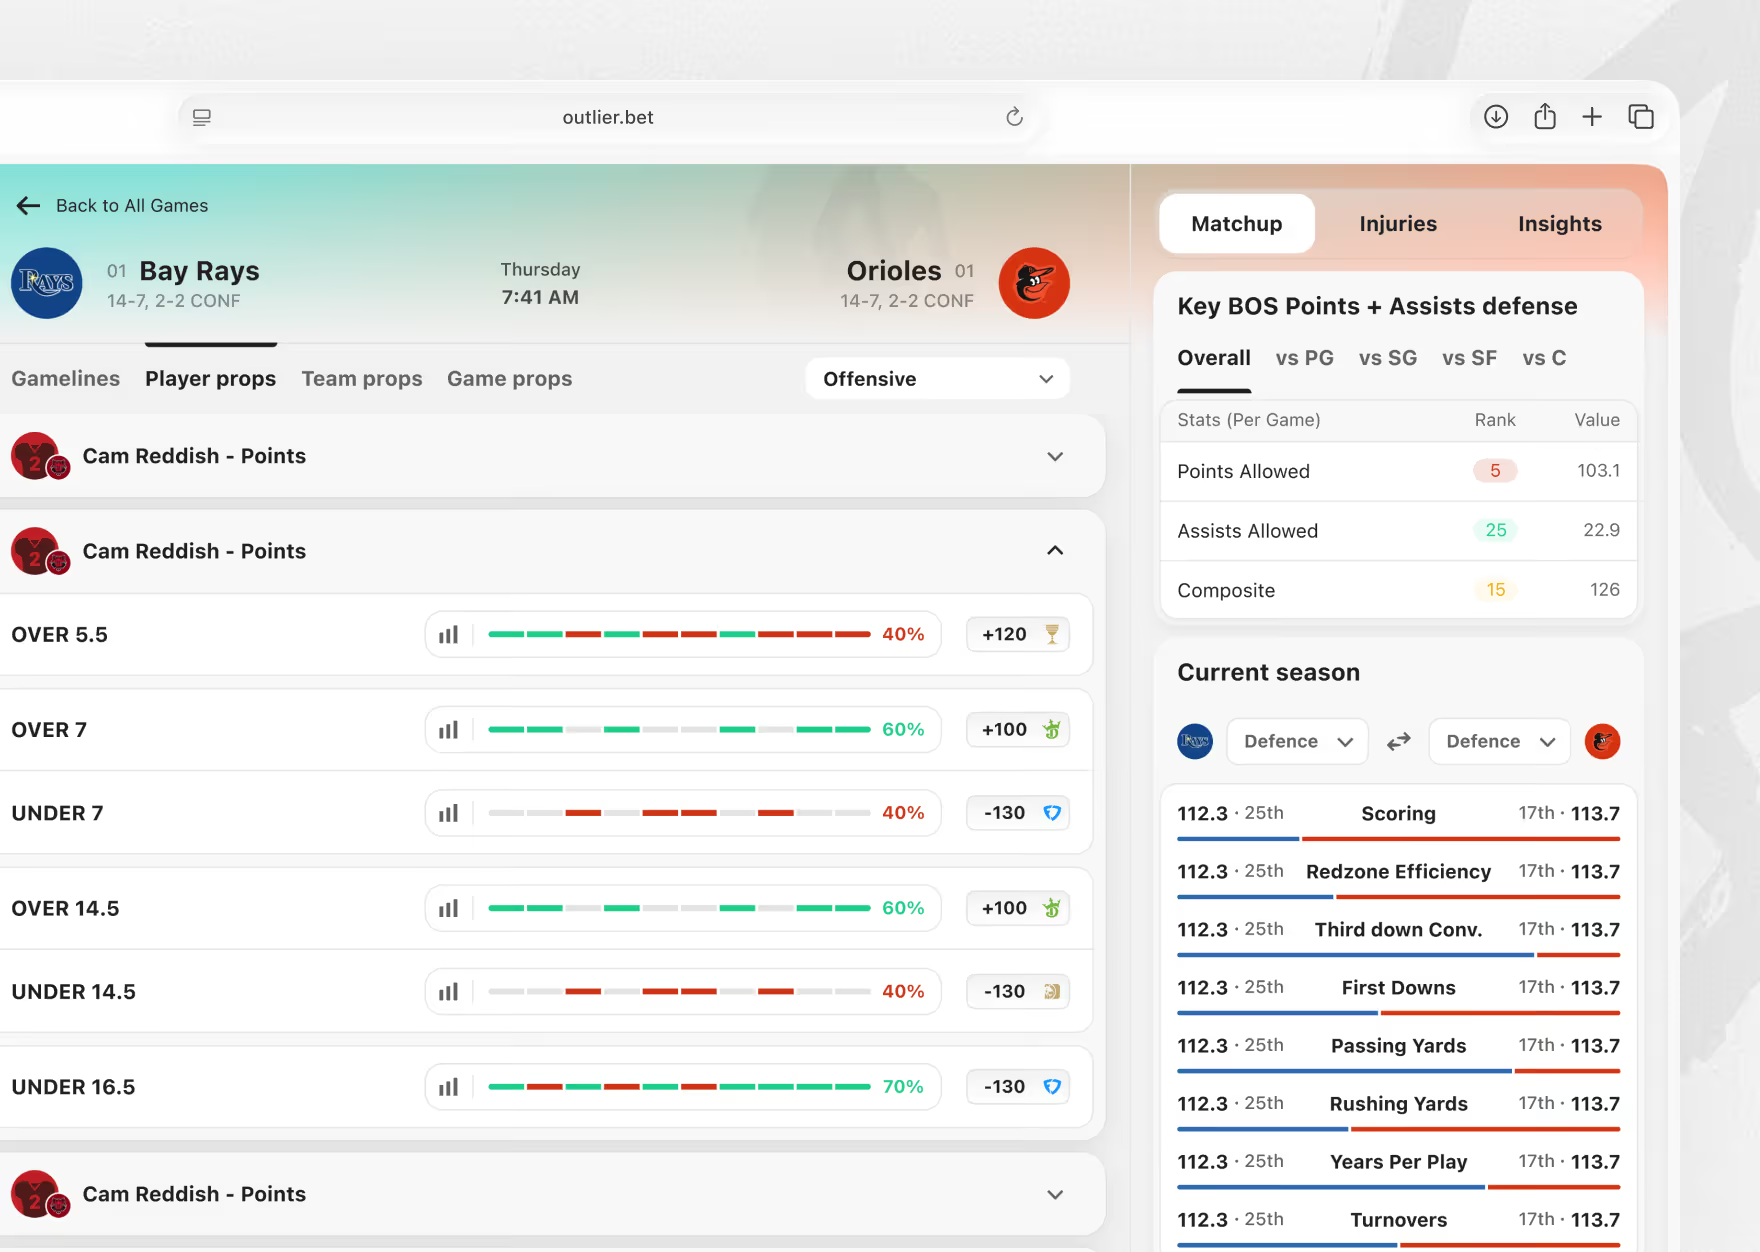
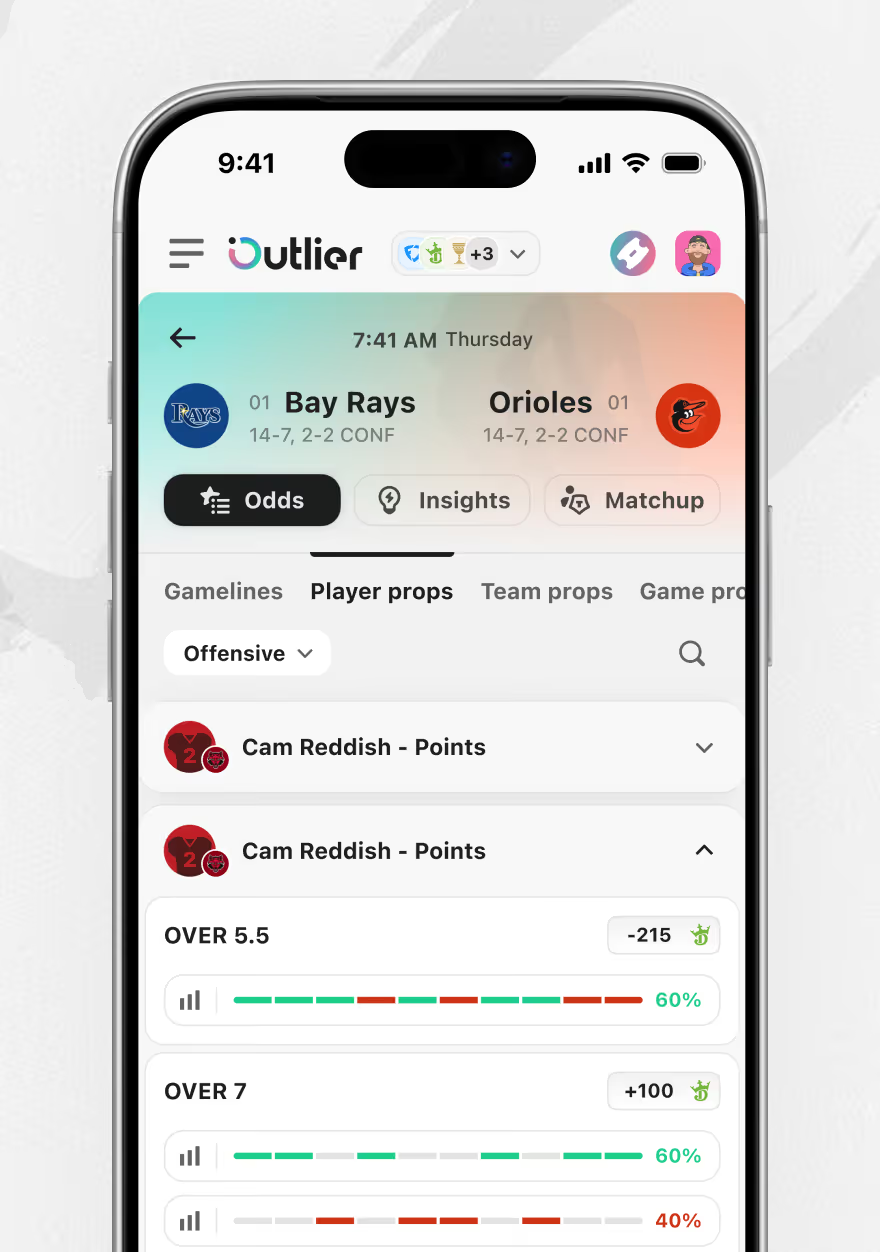
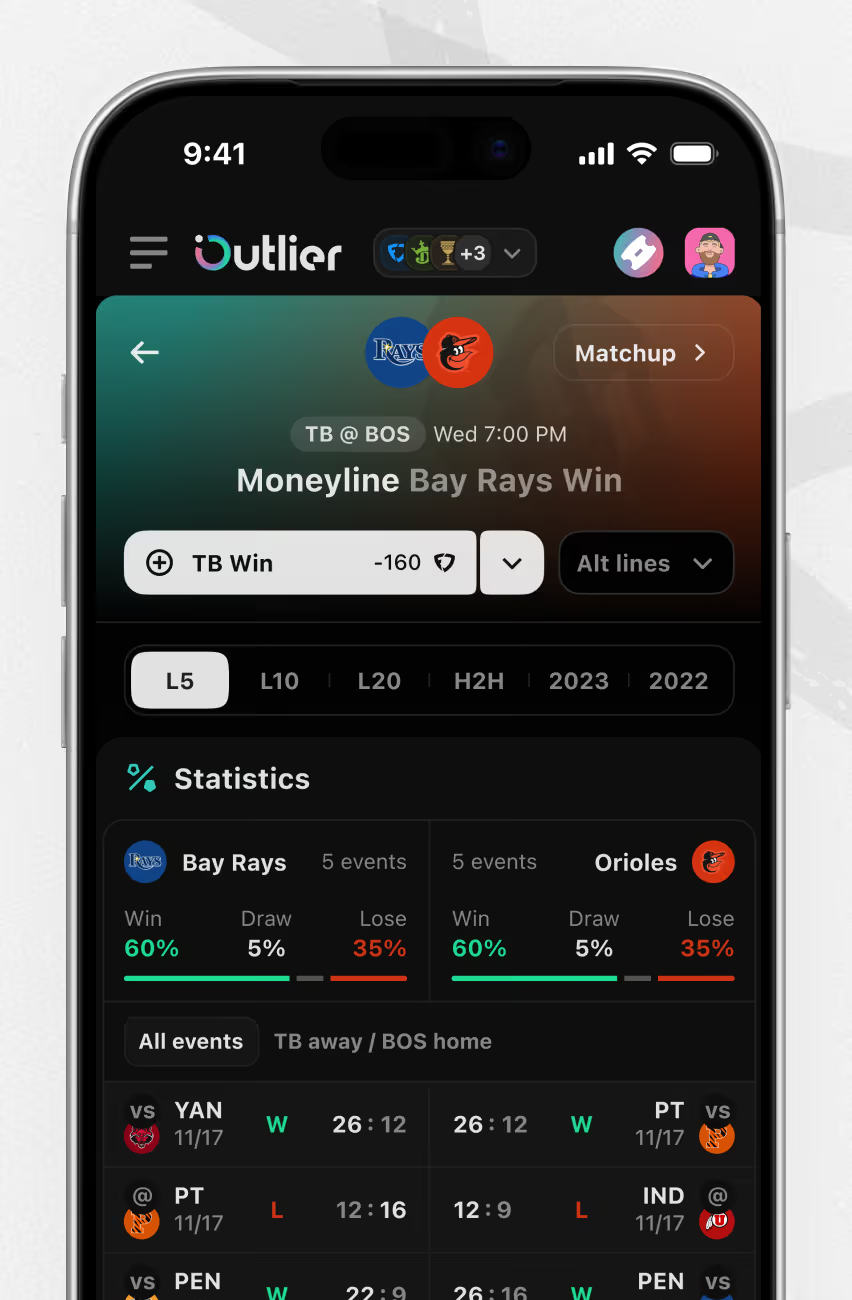
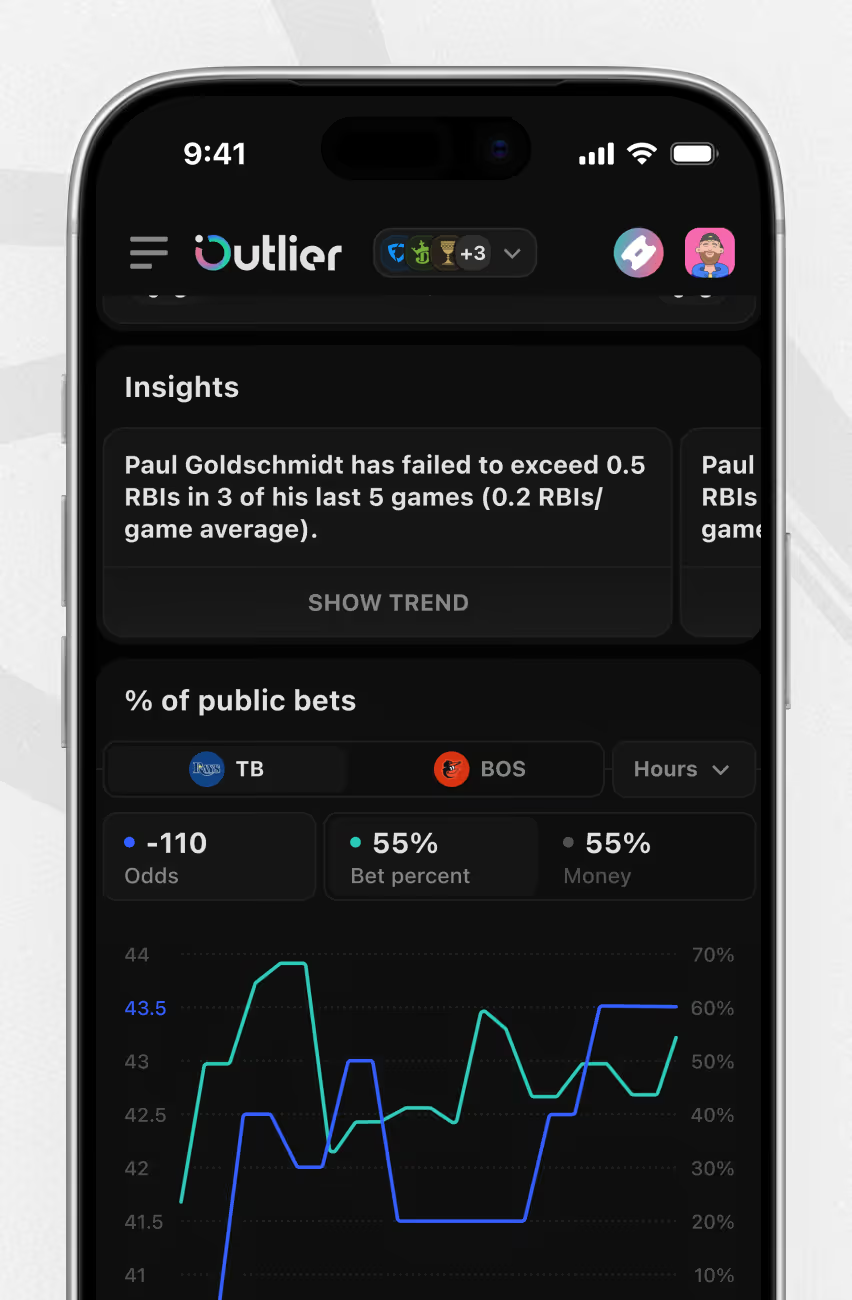
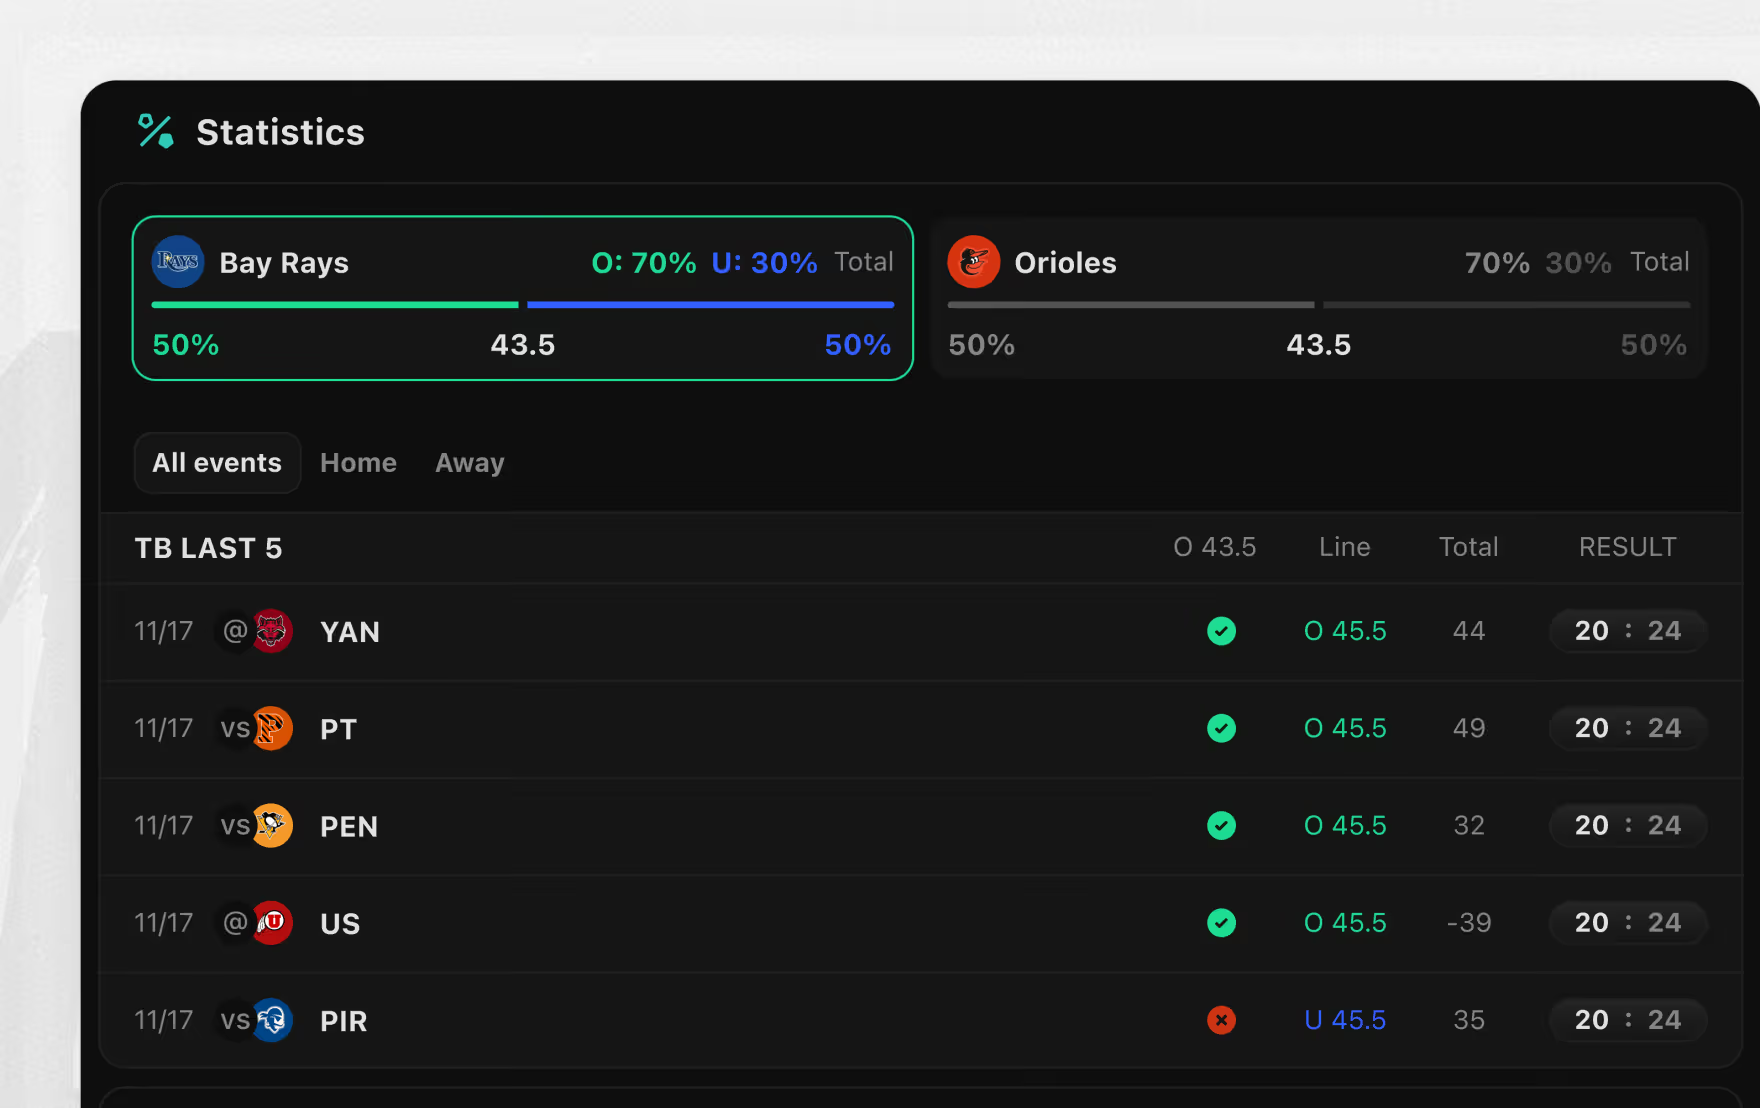
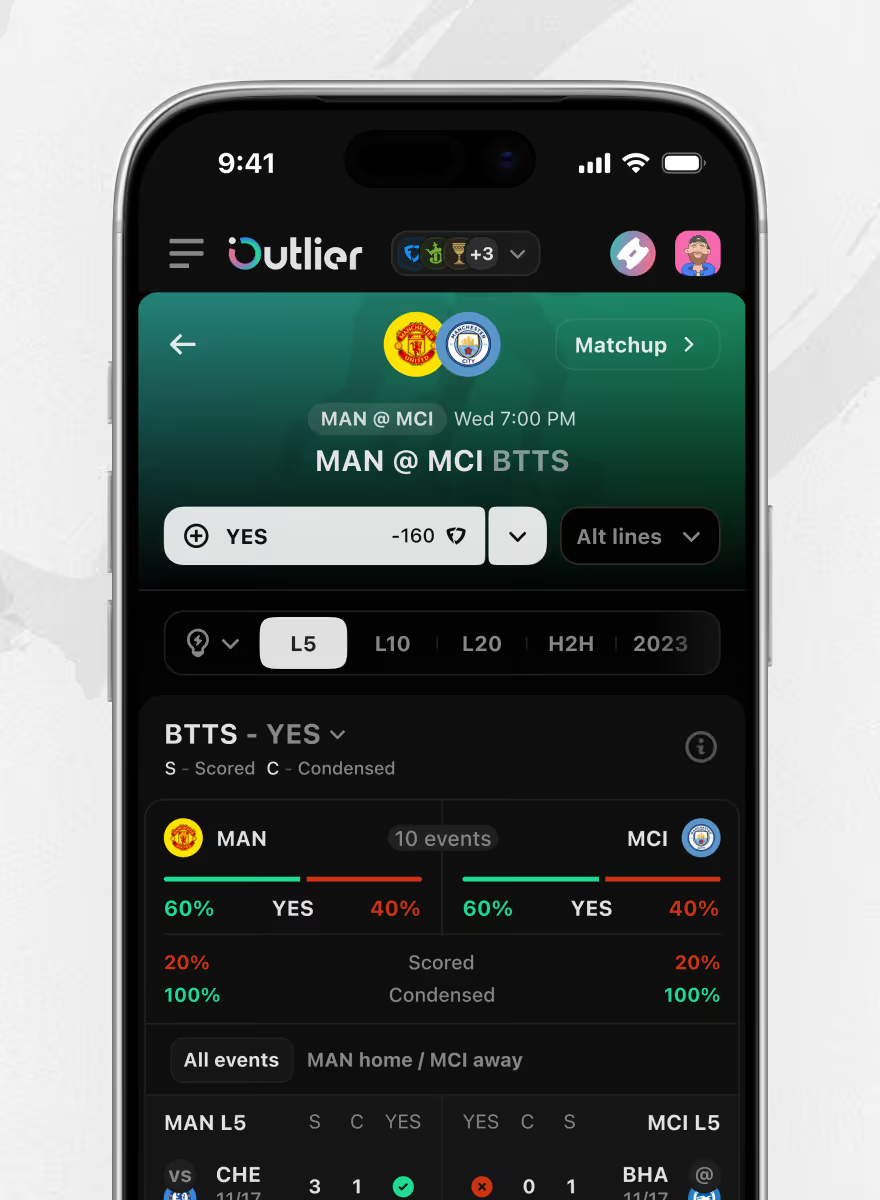
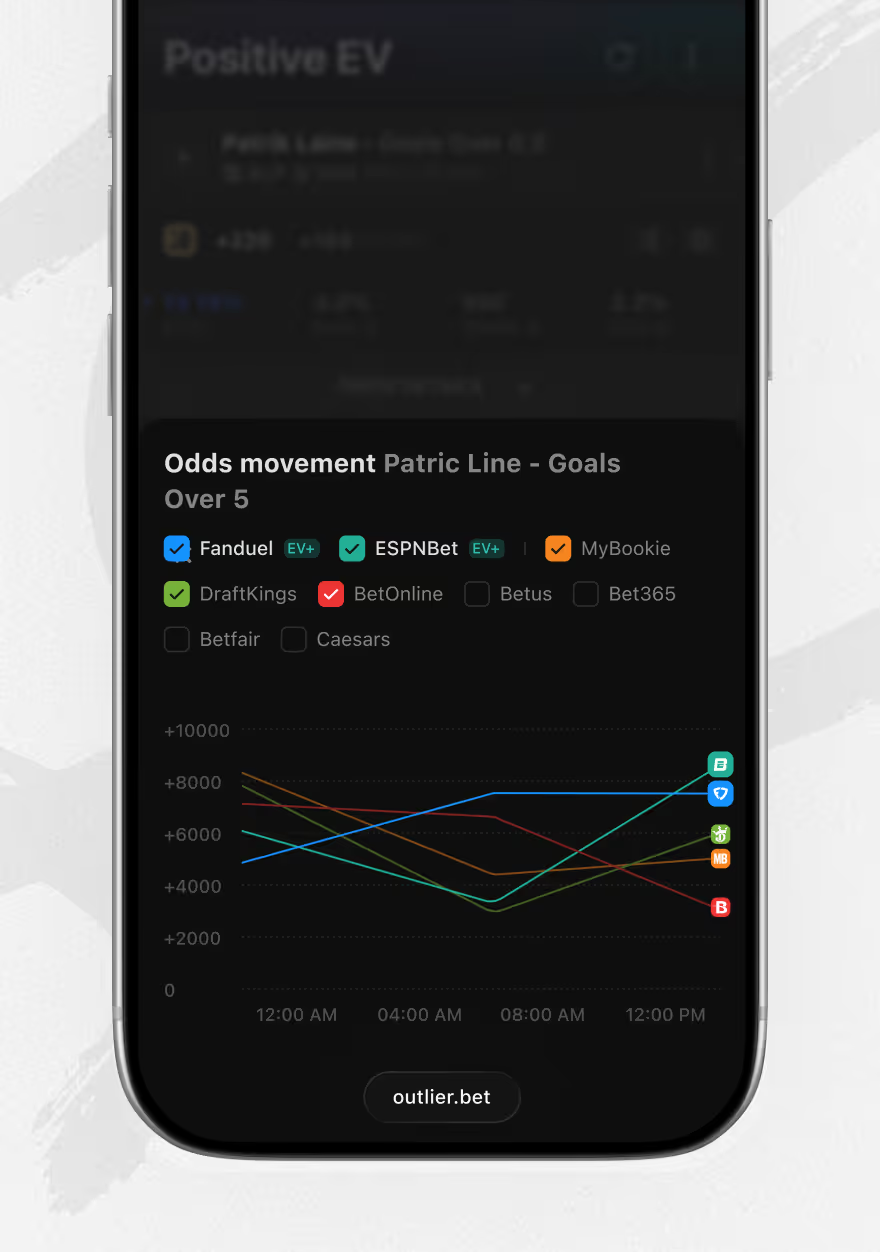
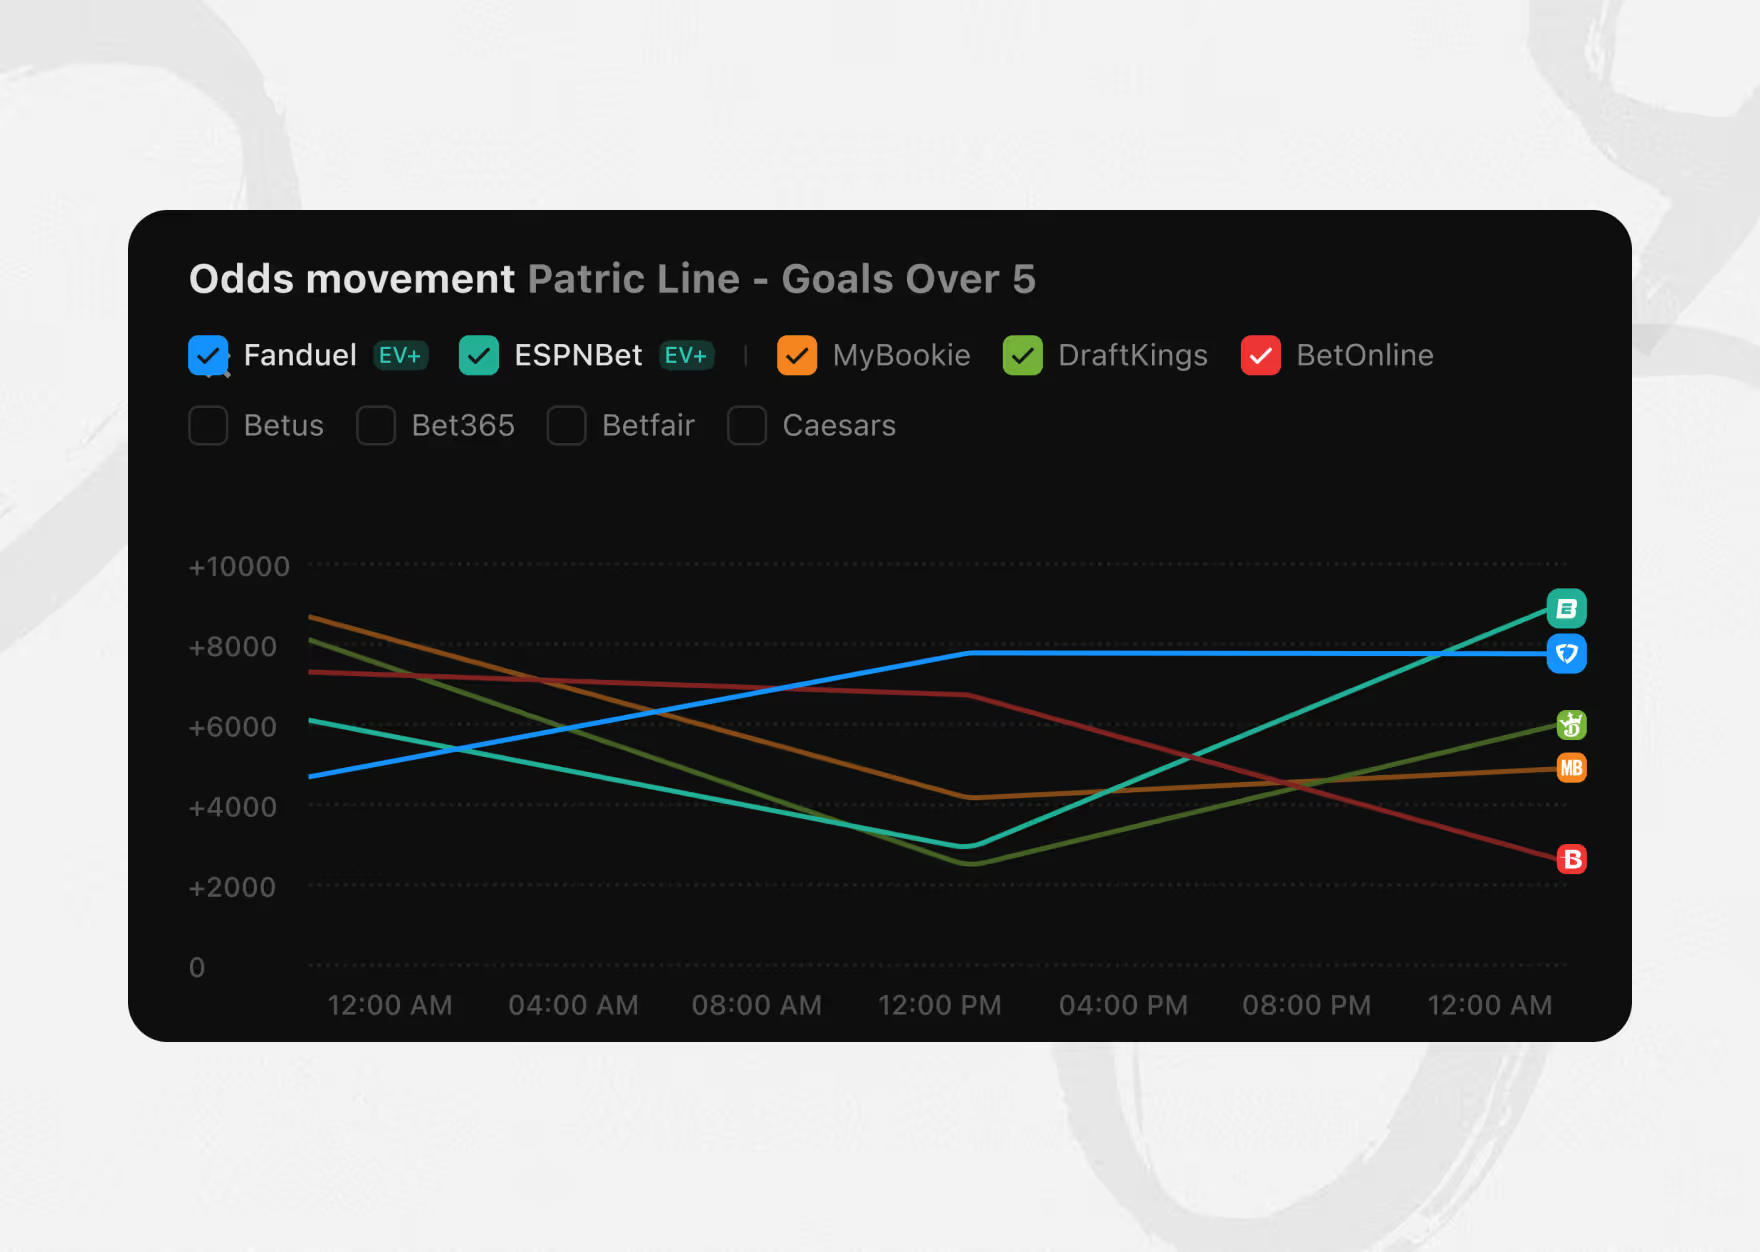
The Team Markets tab isn't limited to moneyline and total – it also covers Correct Score, Tri-bet, and Both Teams to Score. Each market carries an odds timeline, L5/L10/L20/H2H filters, and a public-bets chart.
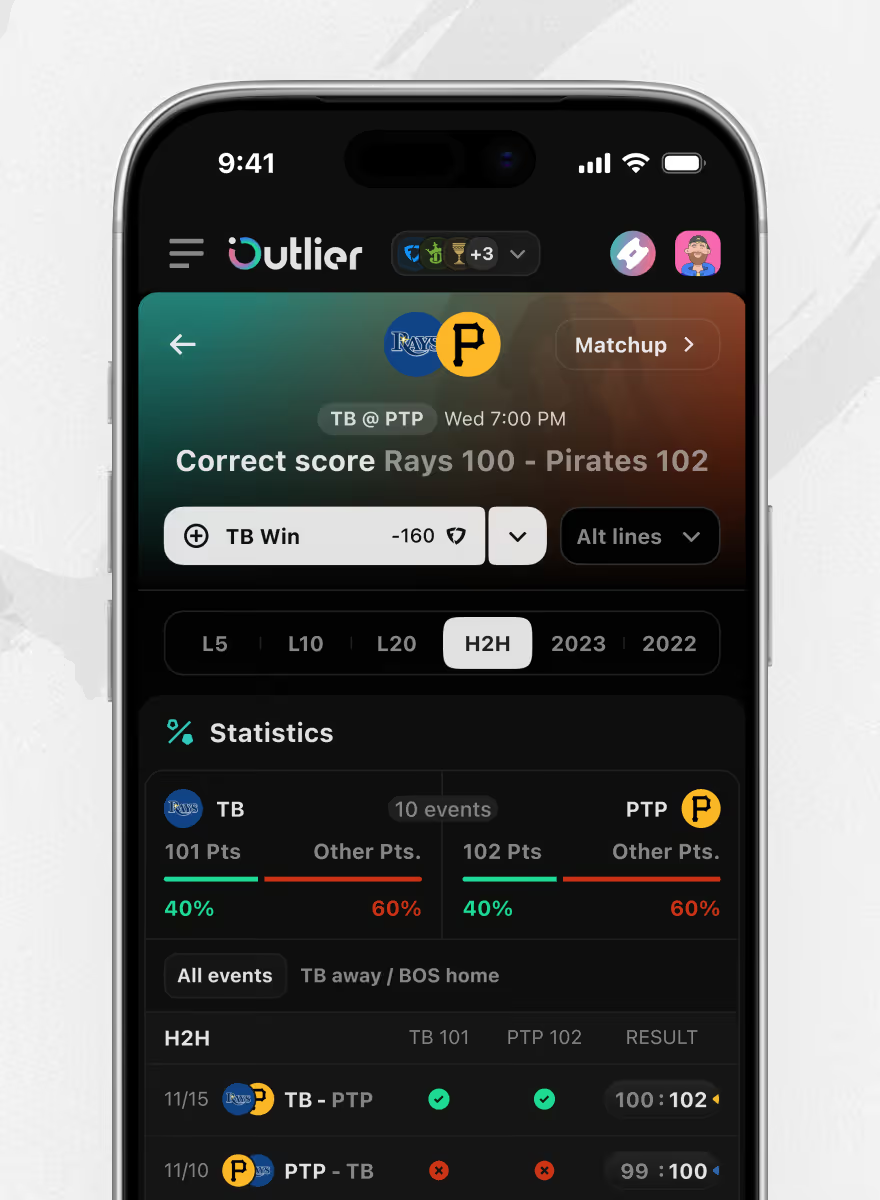
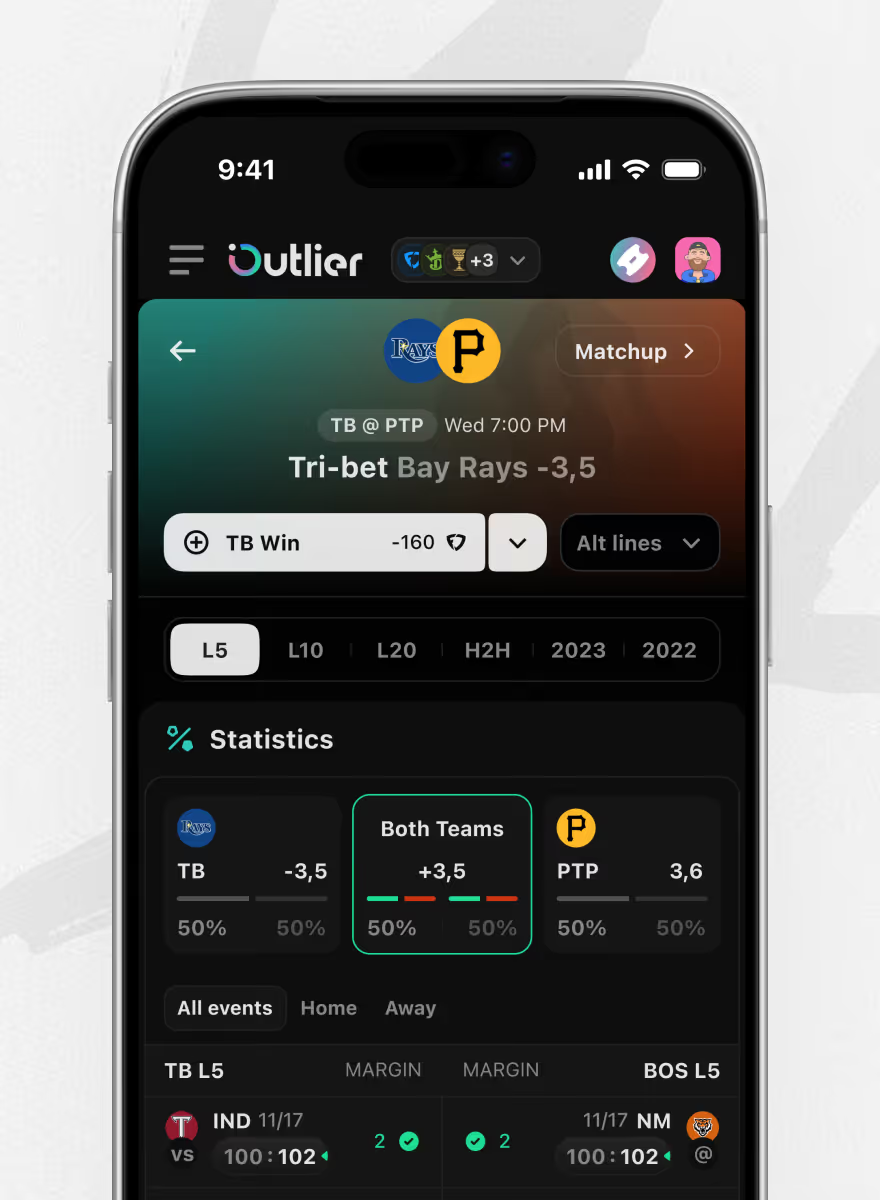
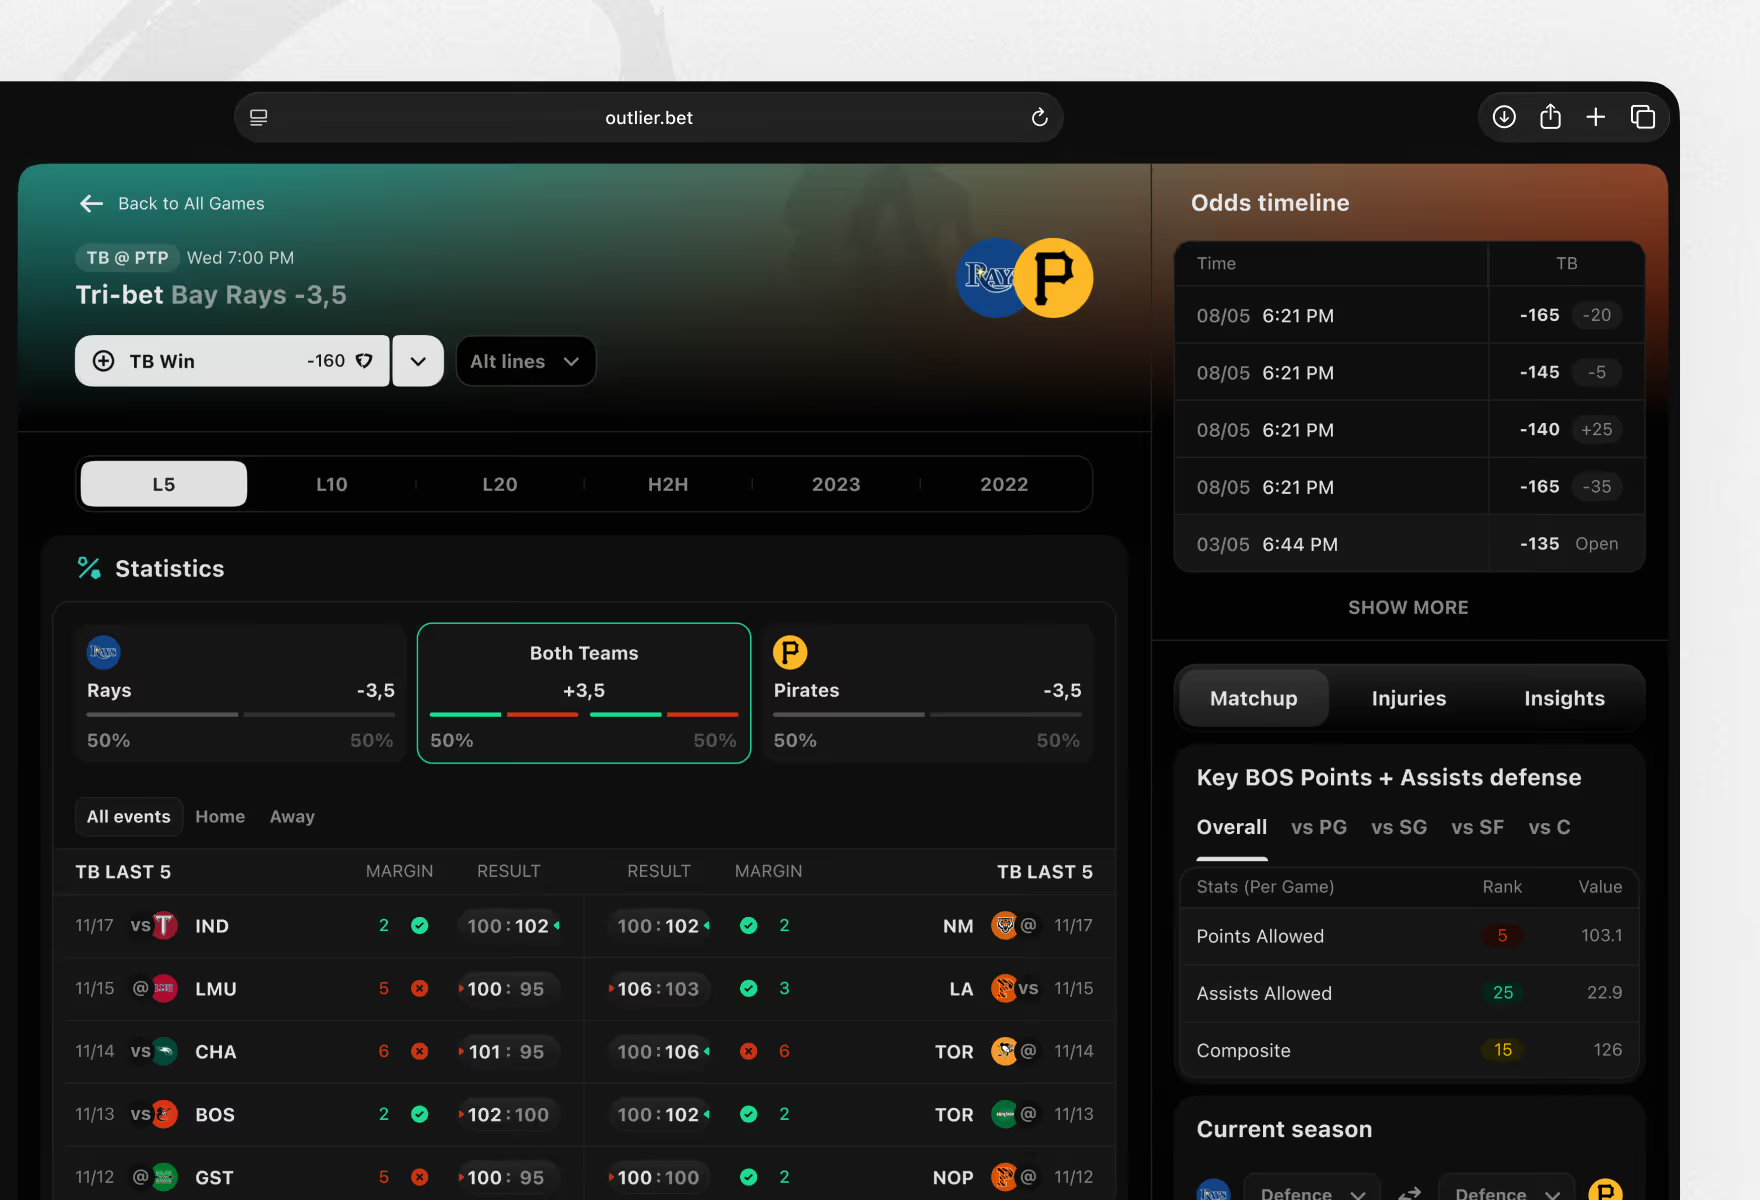
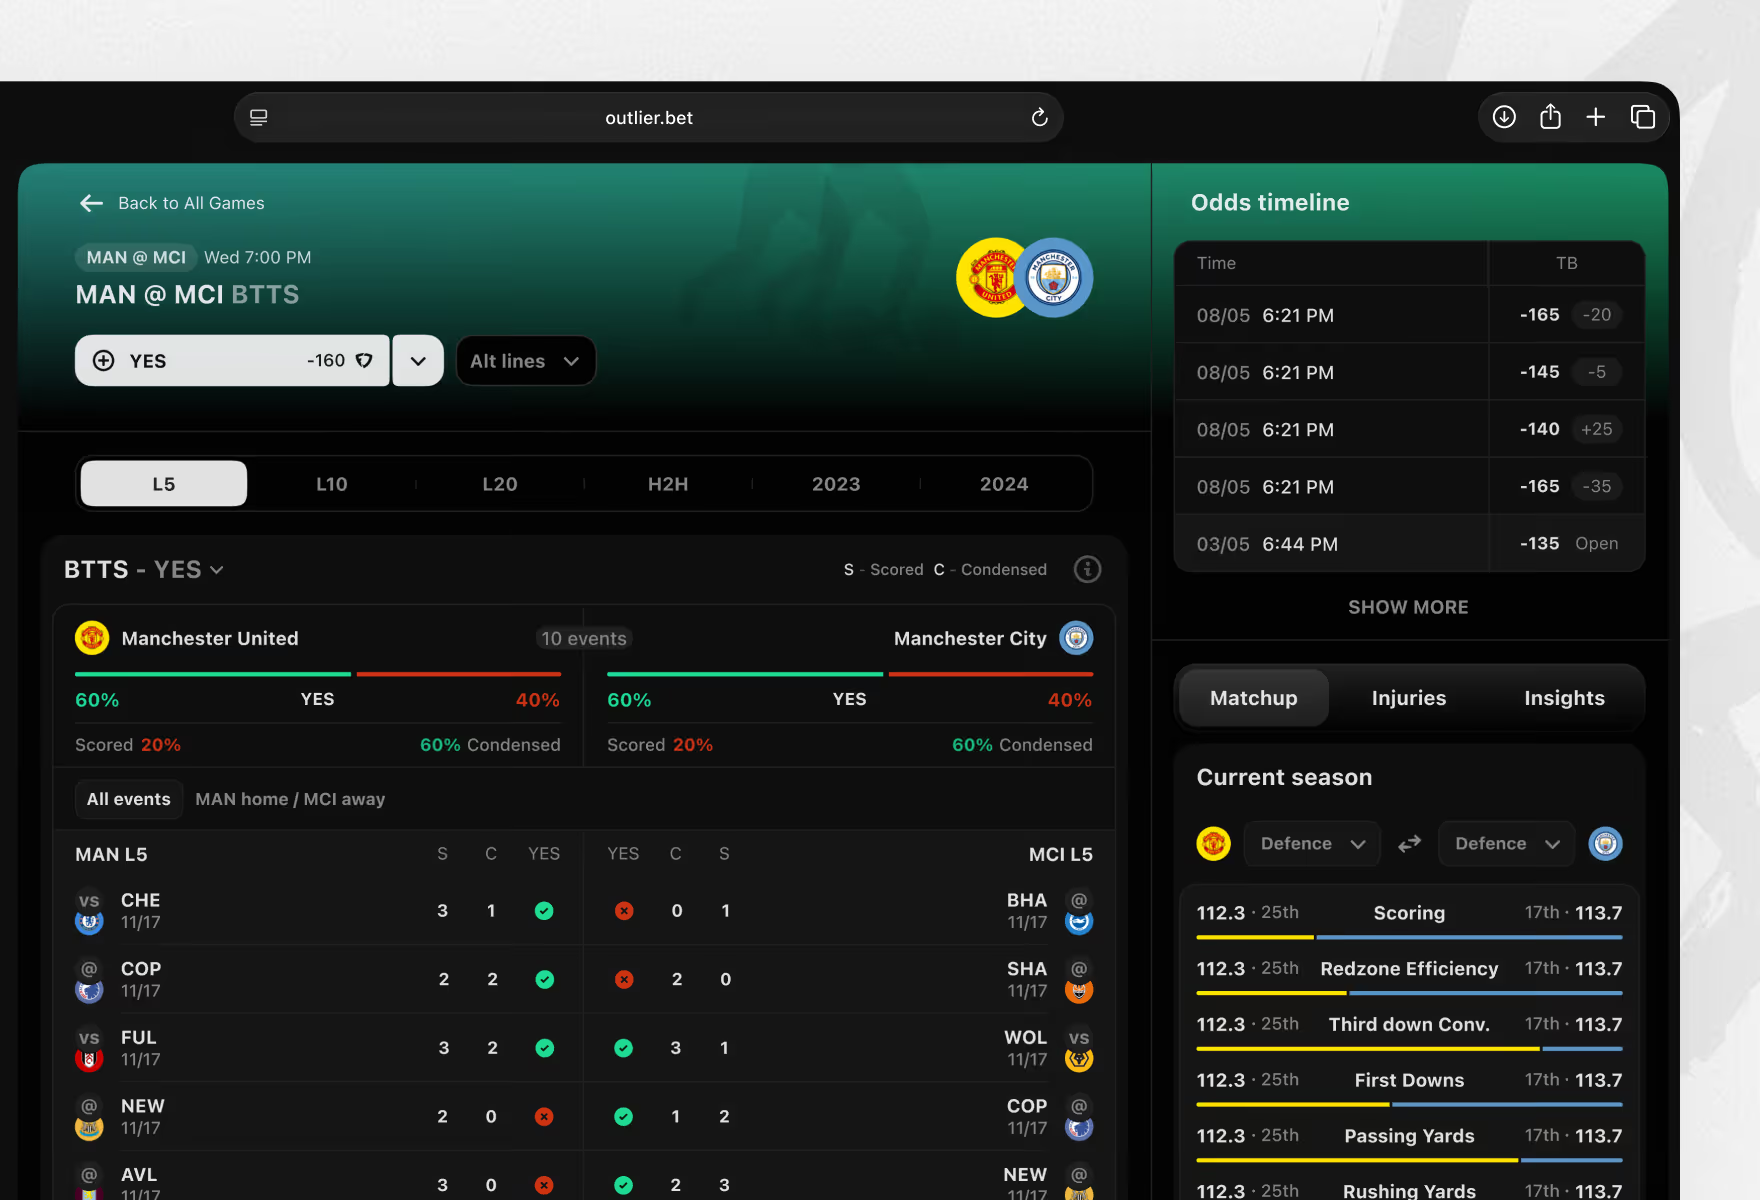
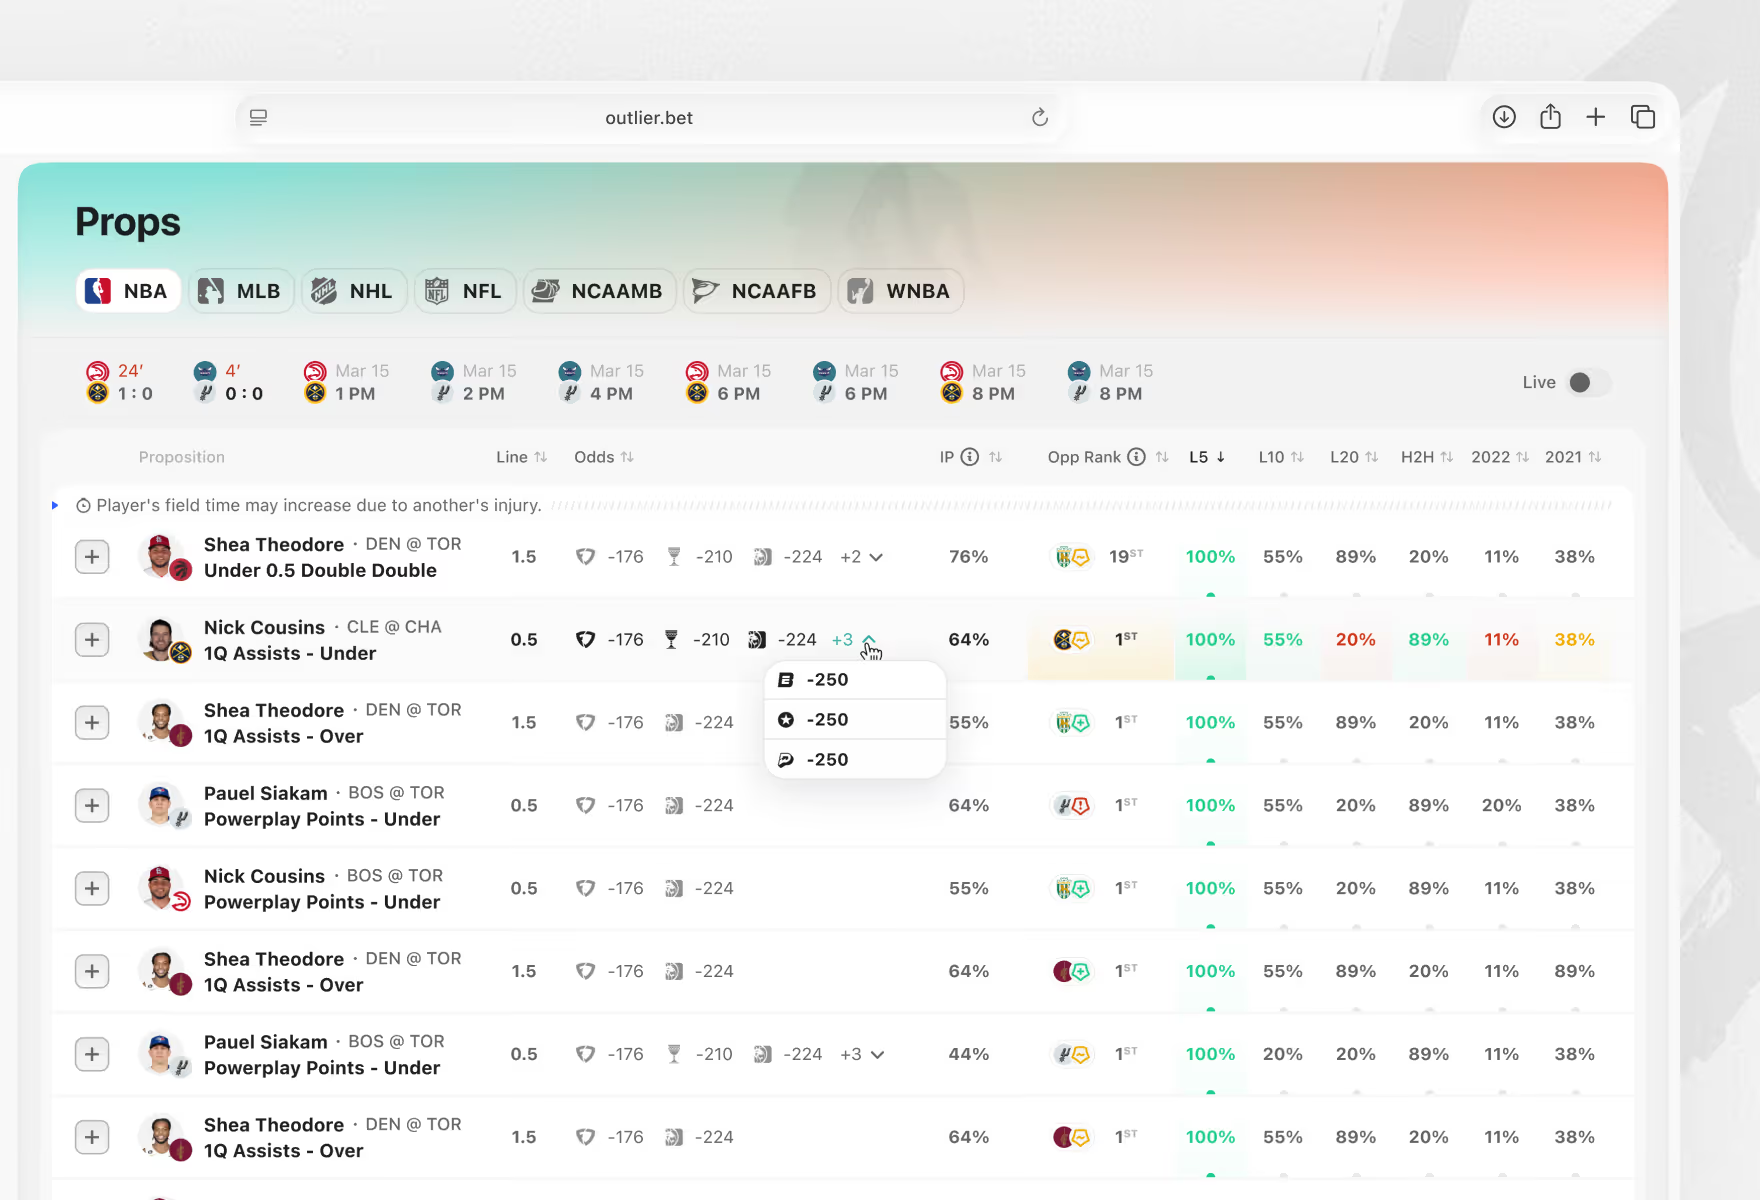
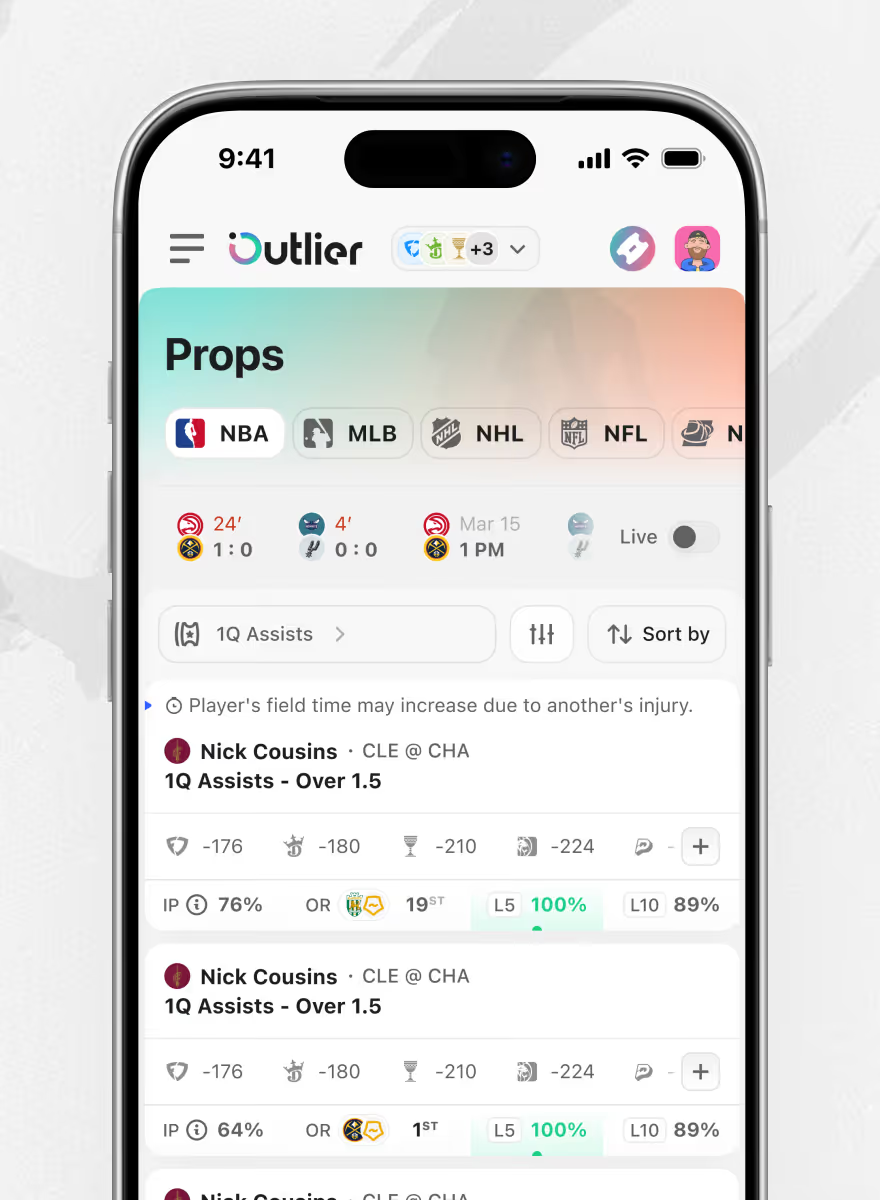
A player props table across multiple sports and leagues, updated live with in-game scores and clocks. Each row shows line, odds, implied probability, opponent rank, and hit rate.
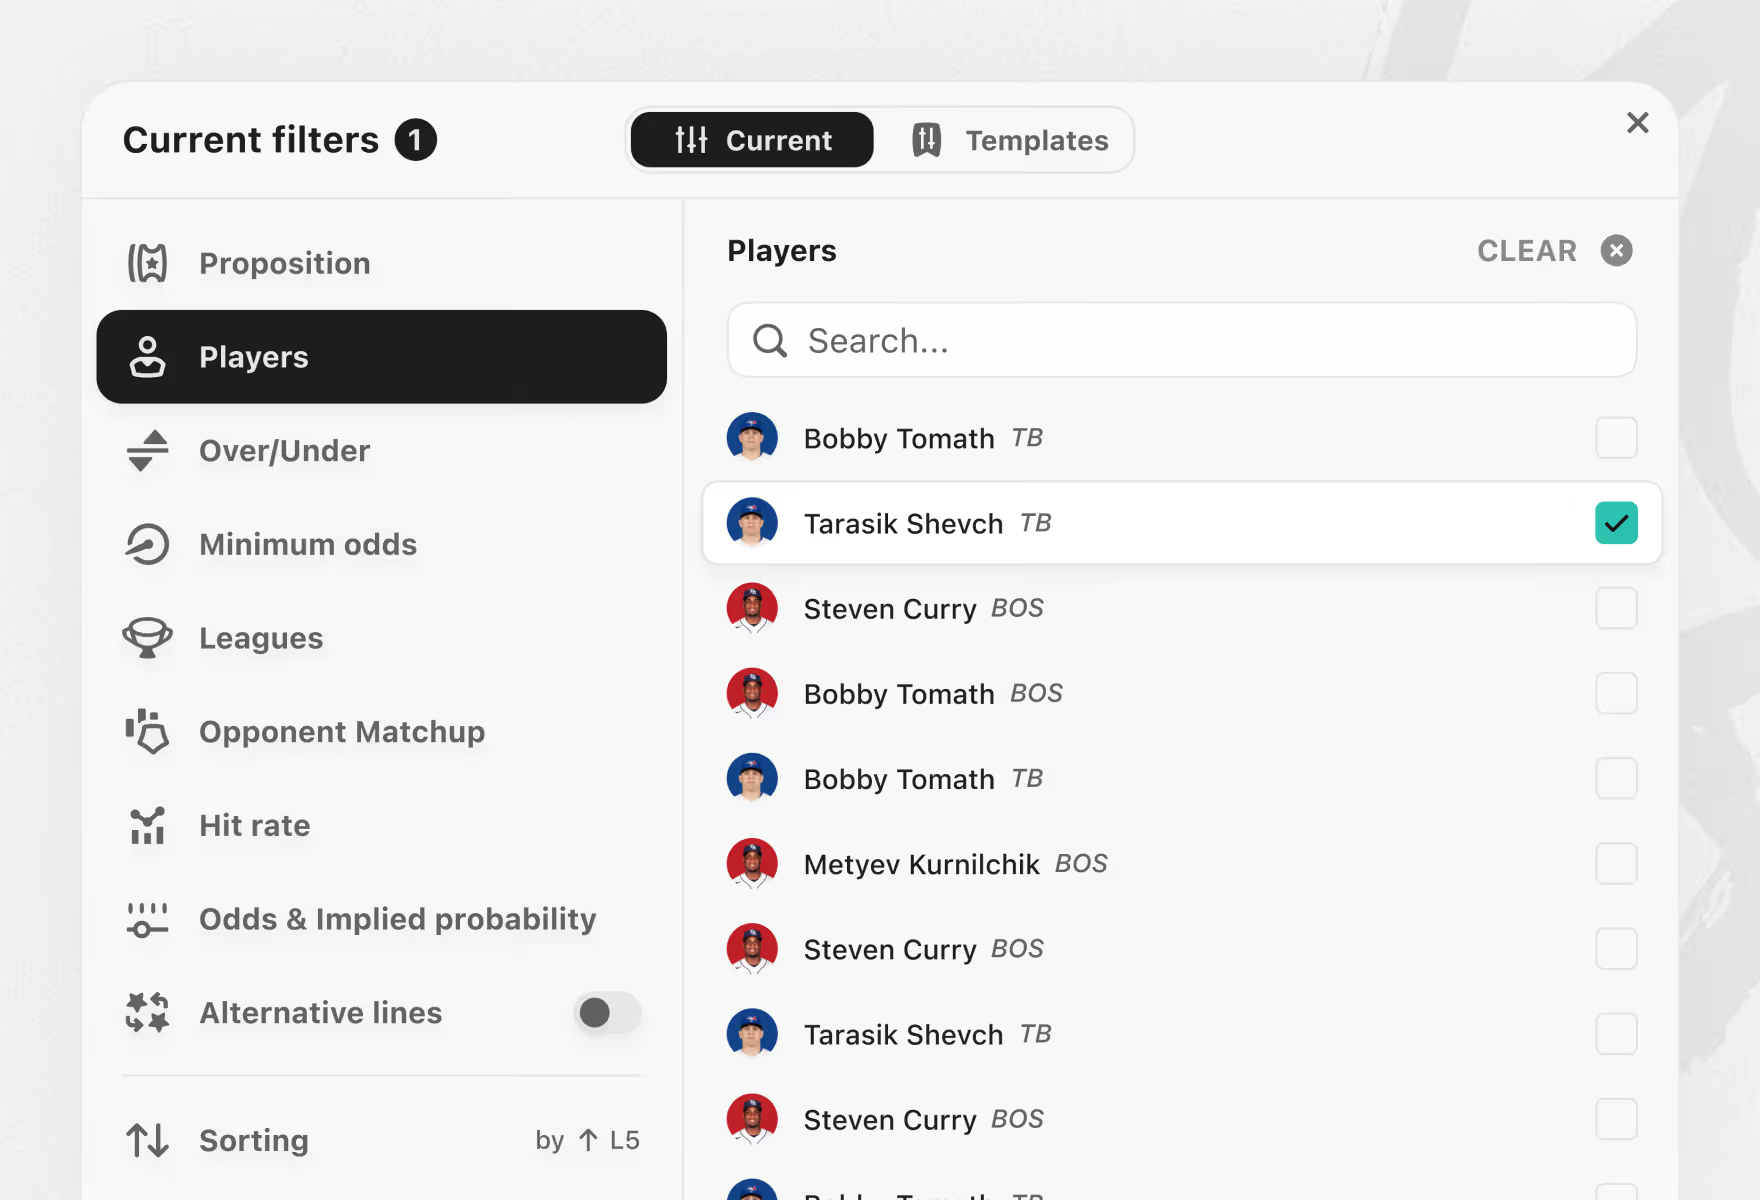
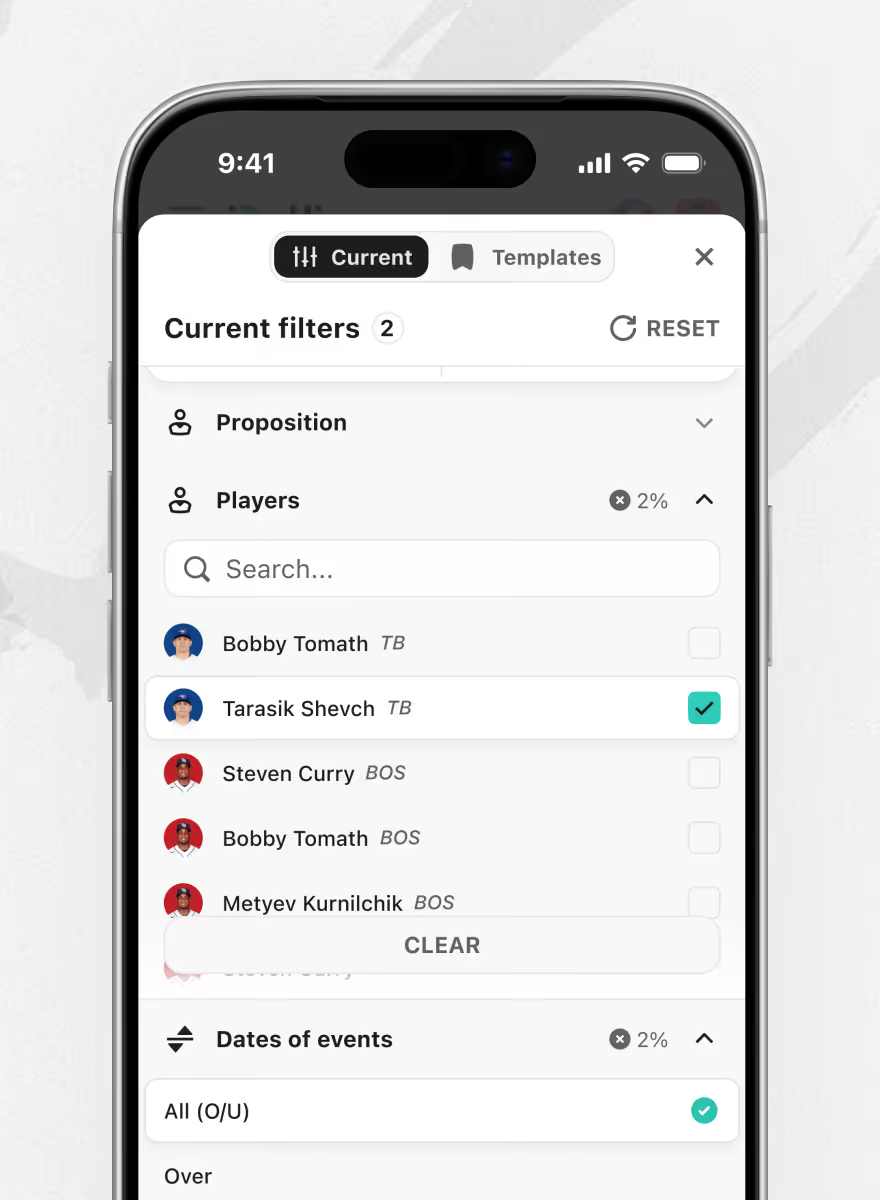
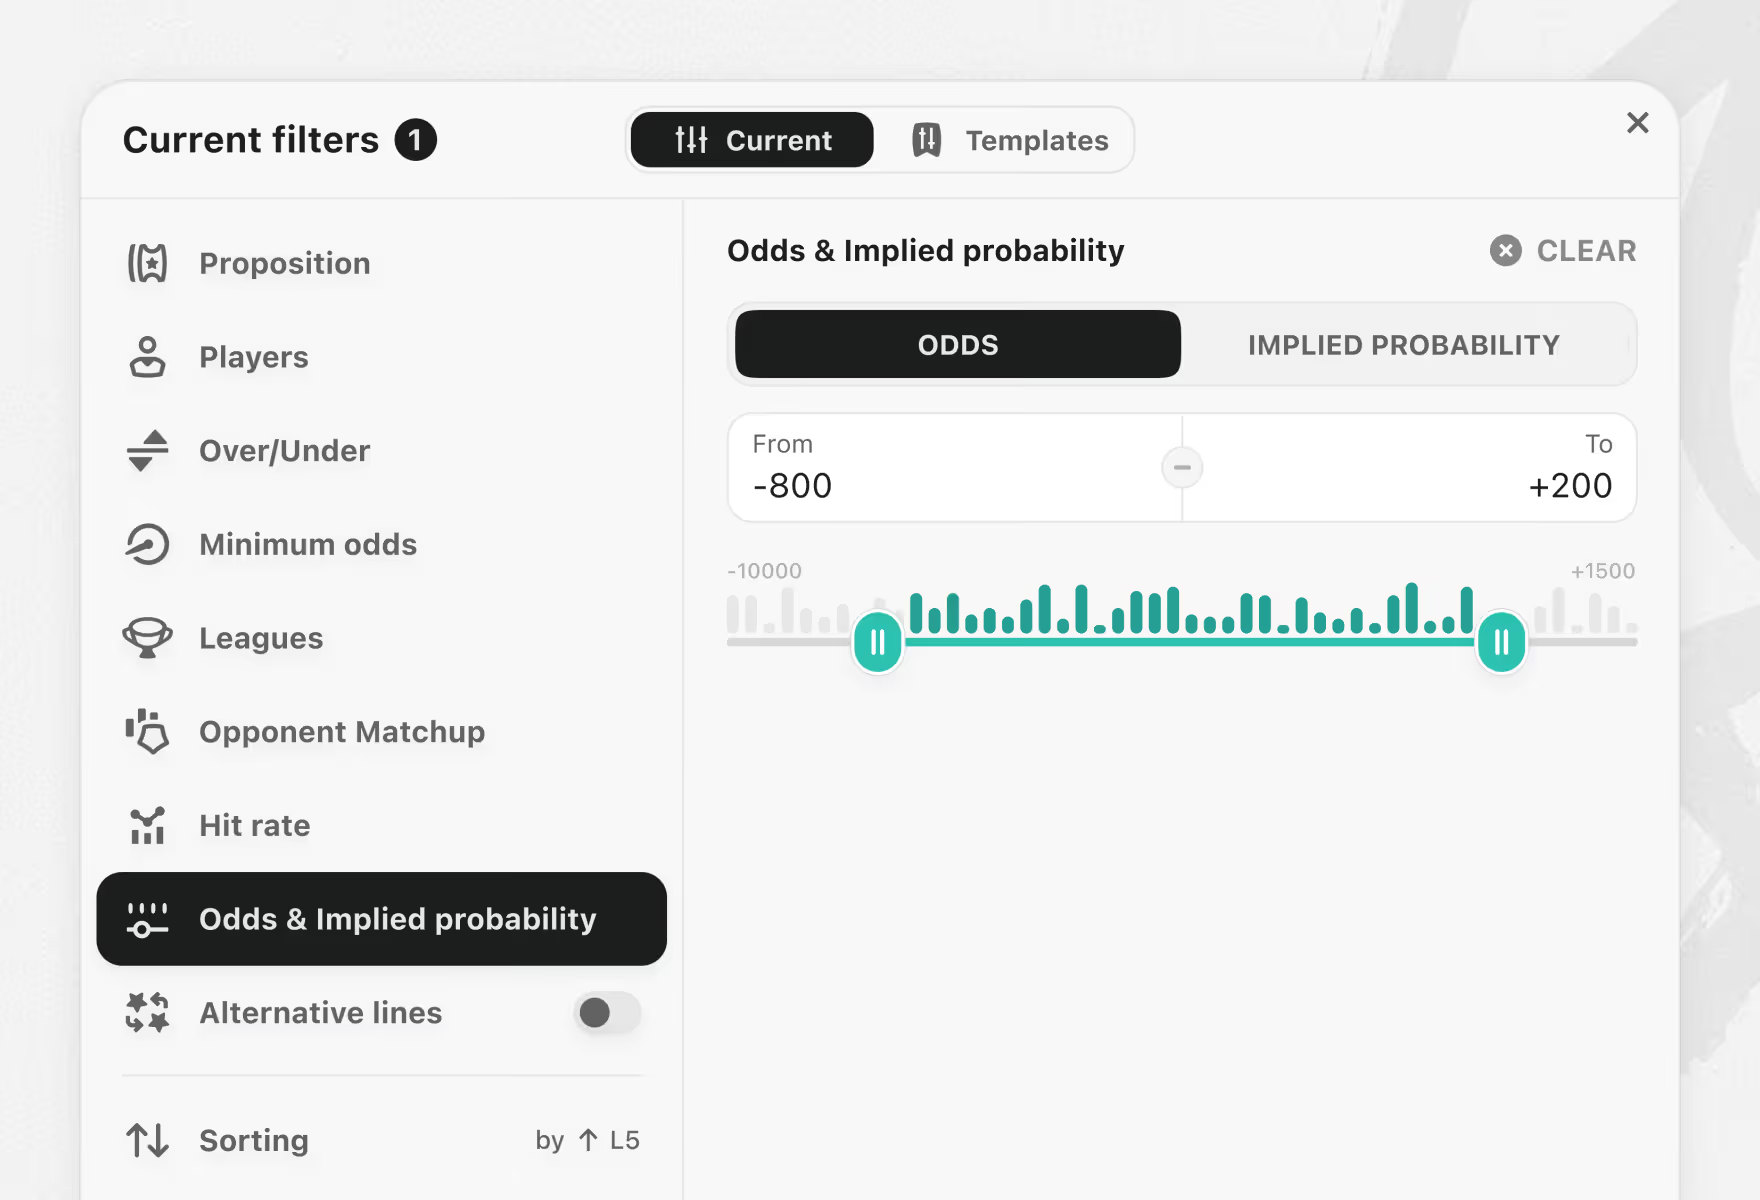
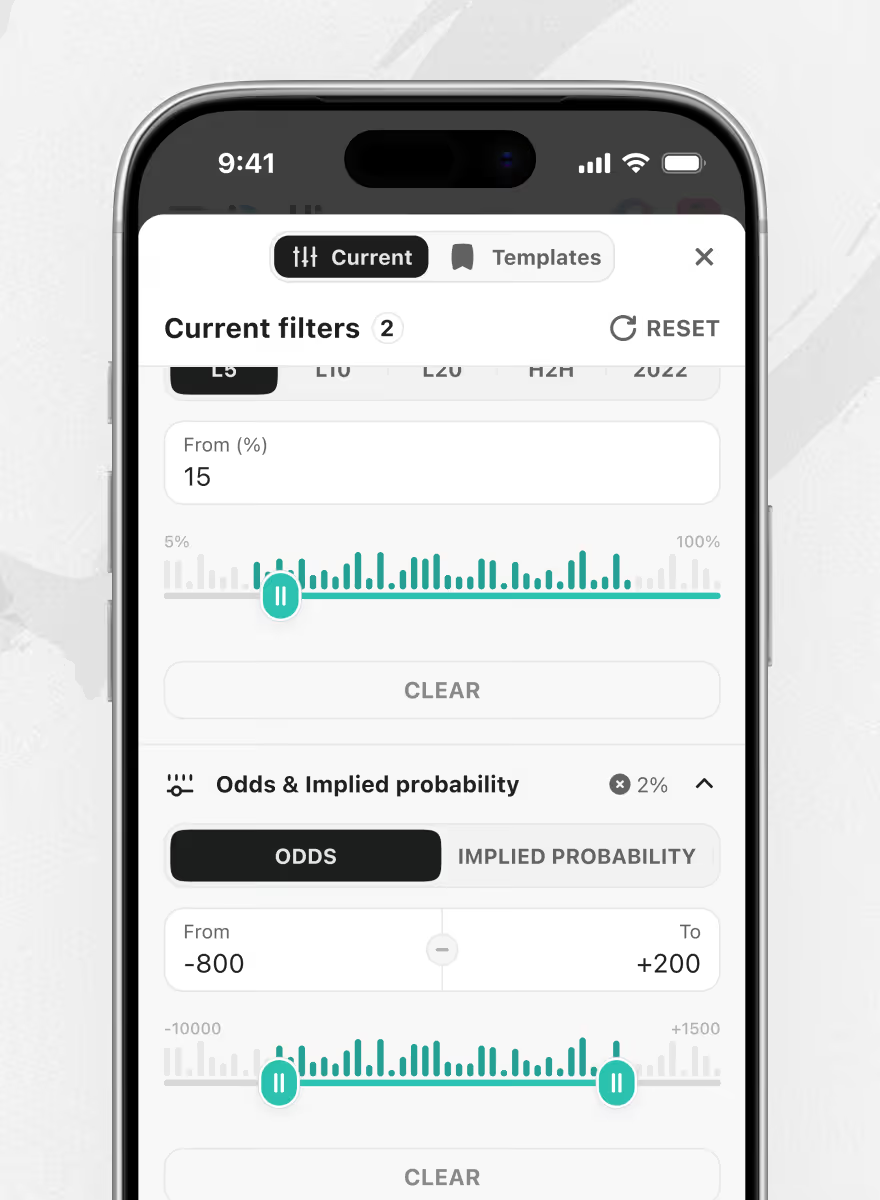
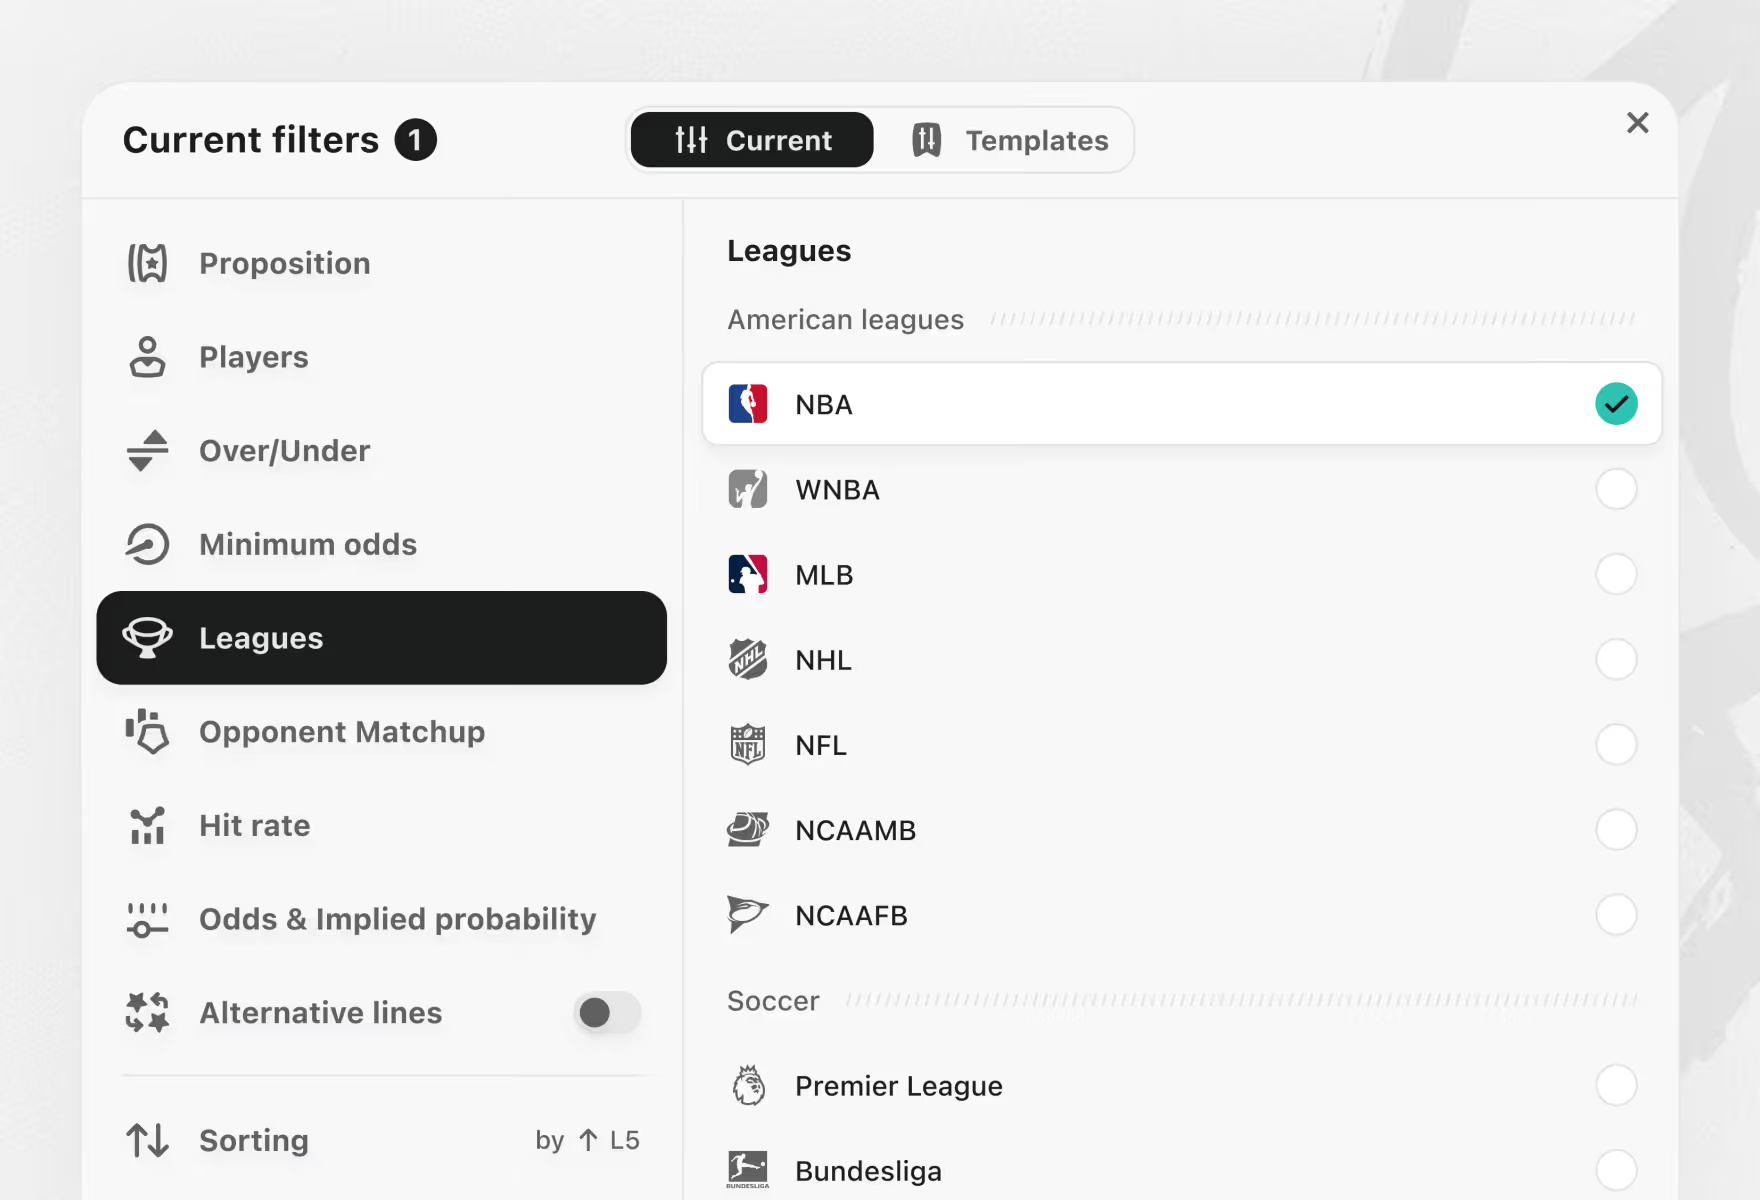
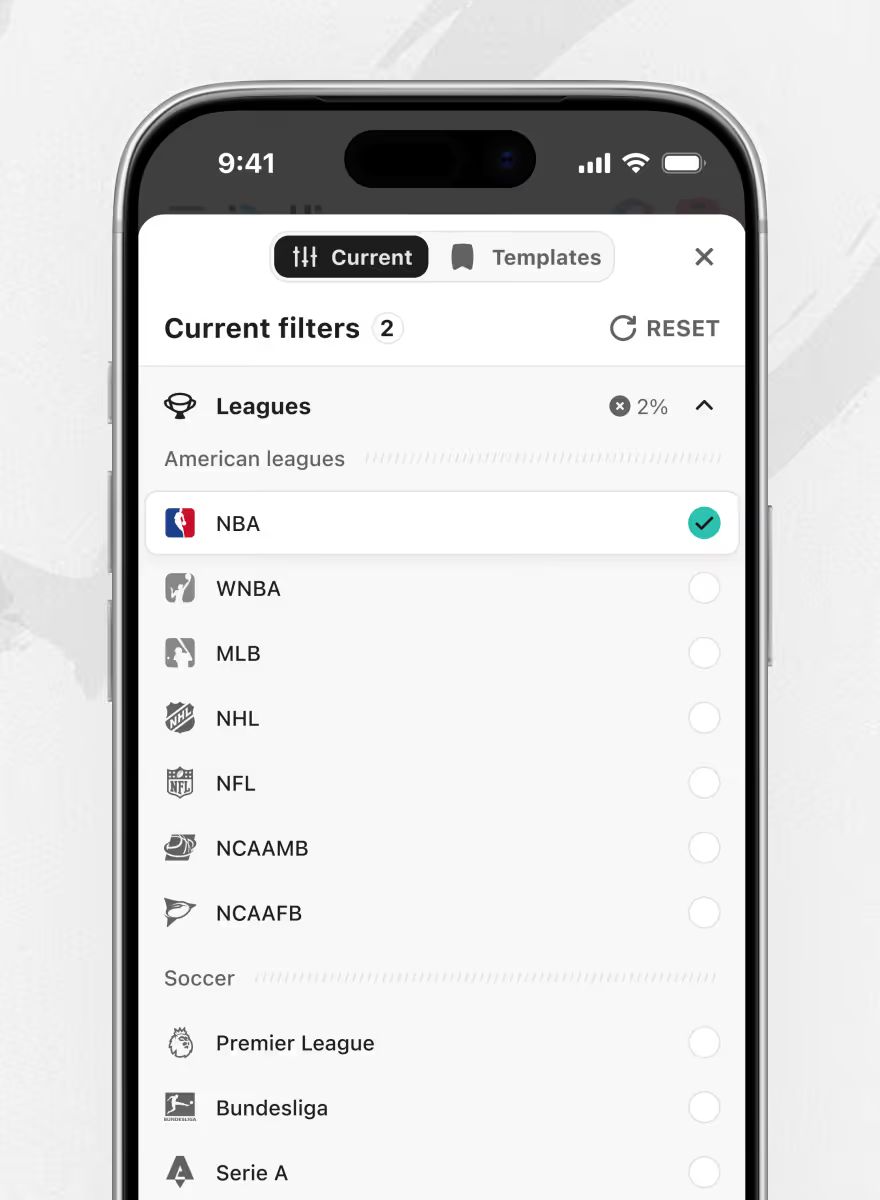
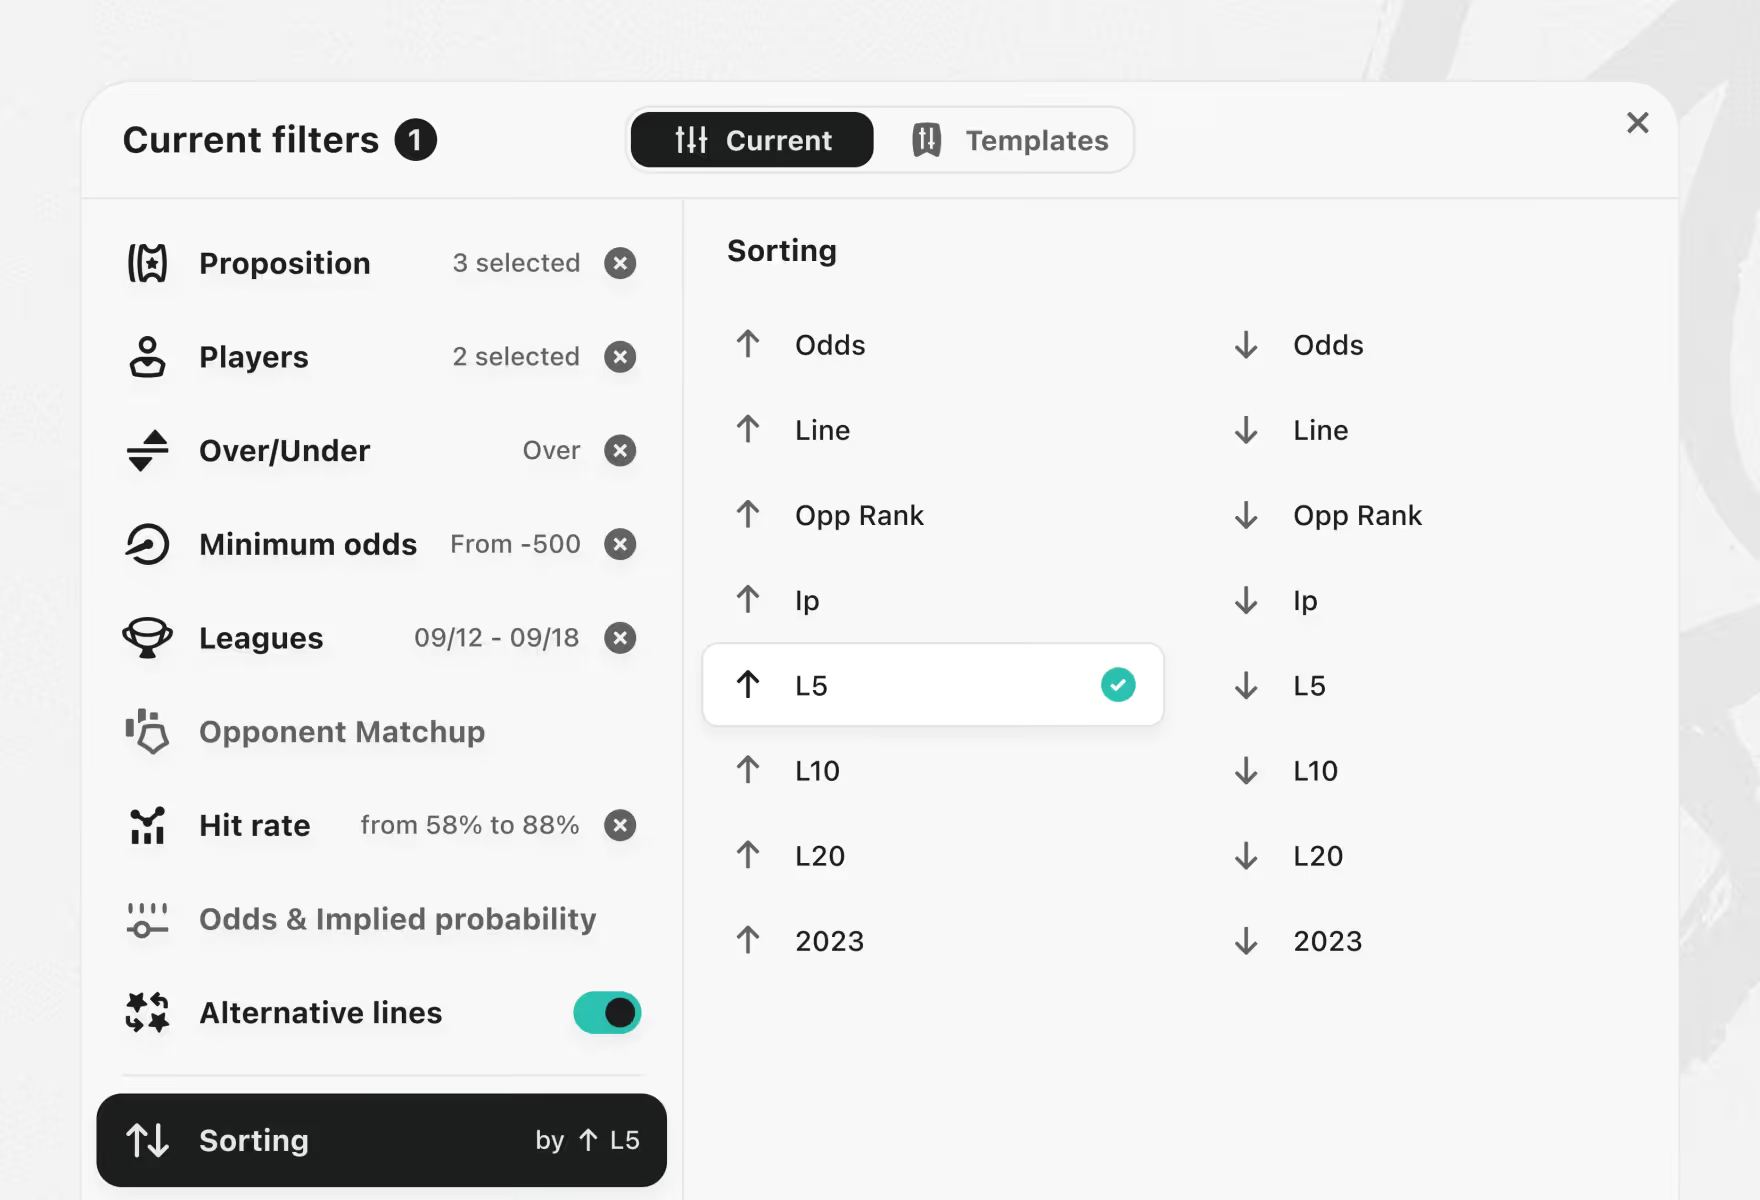
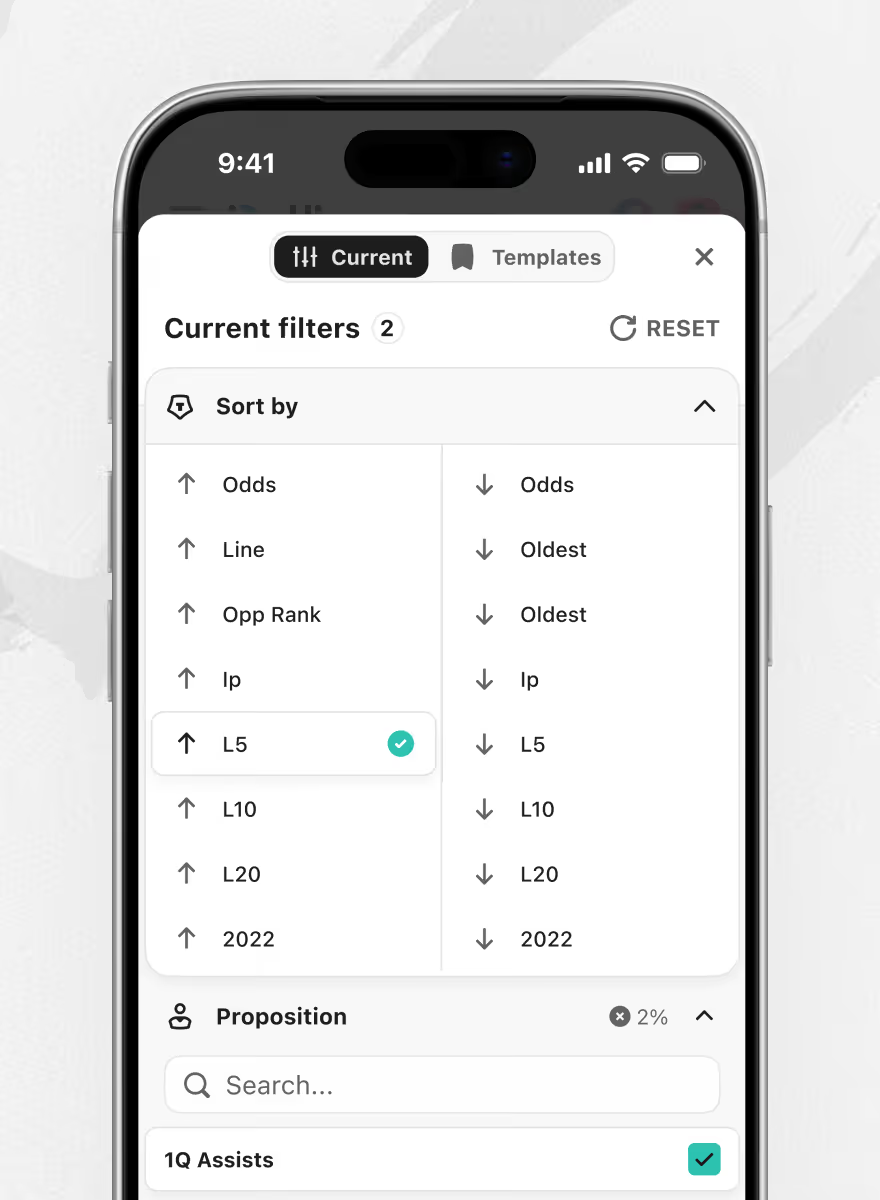
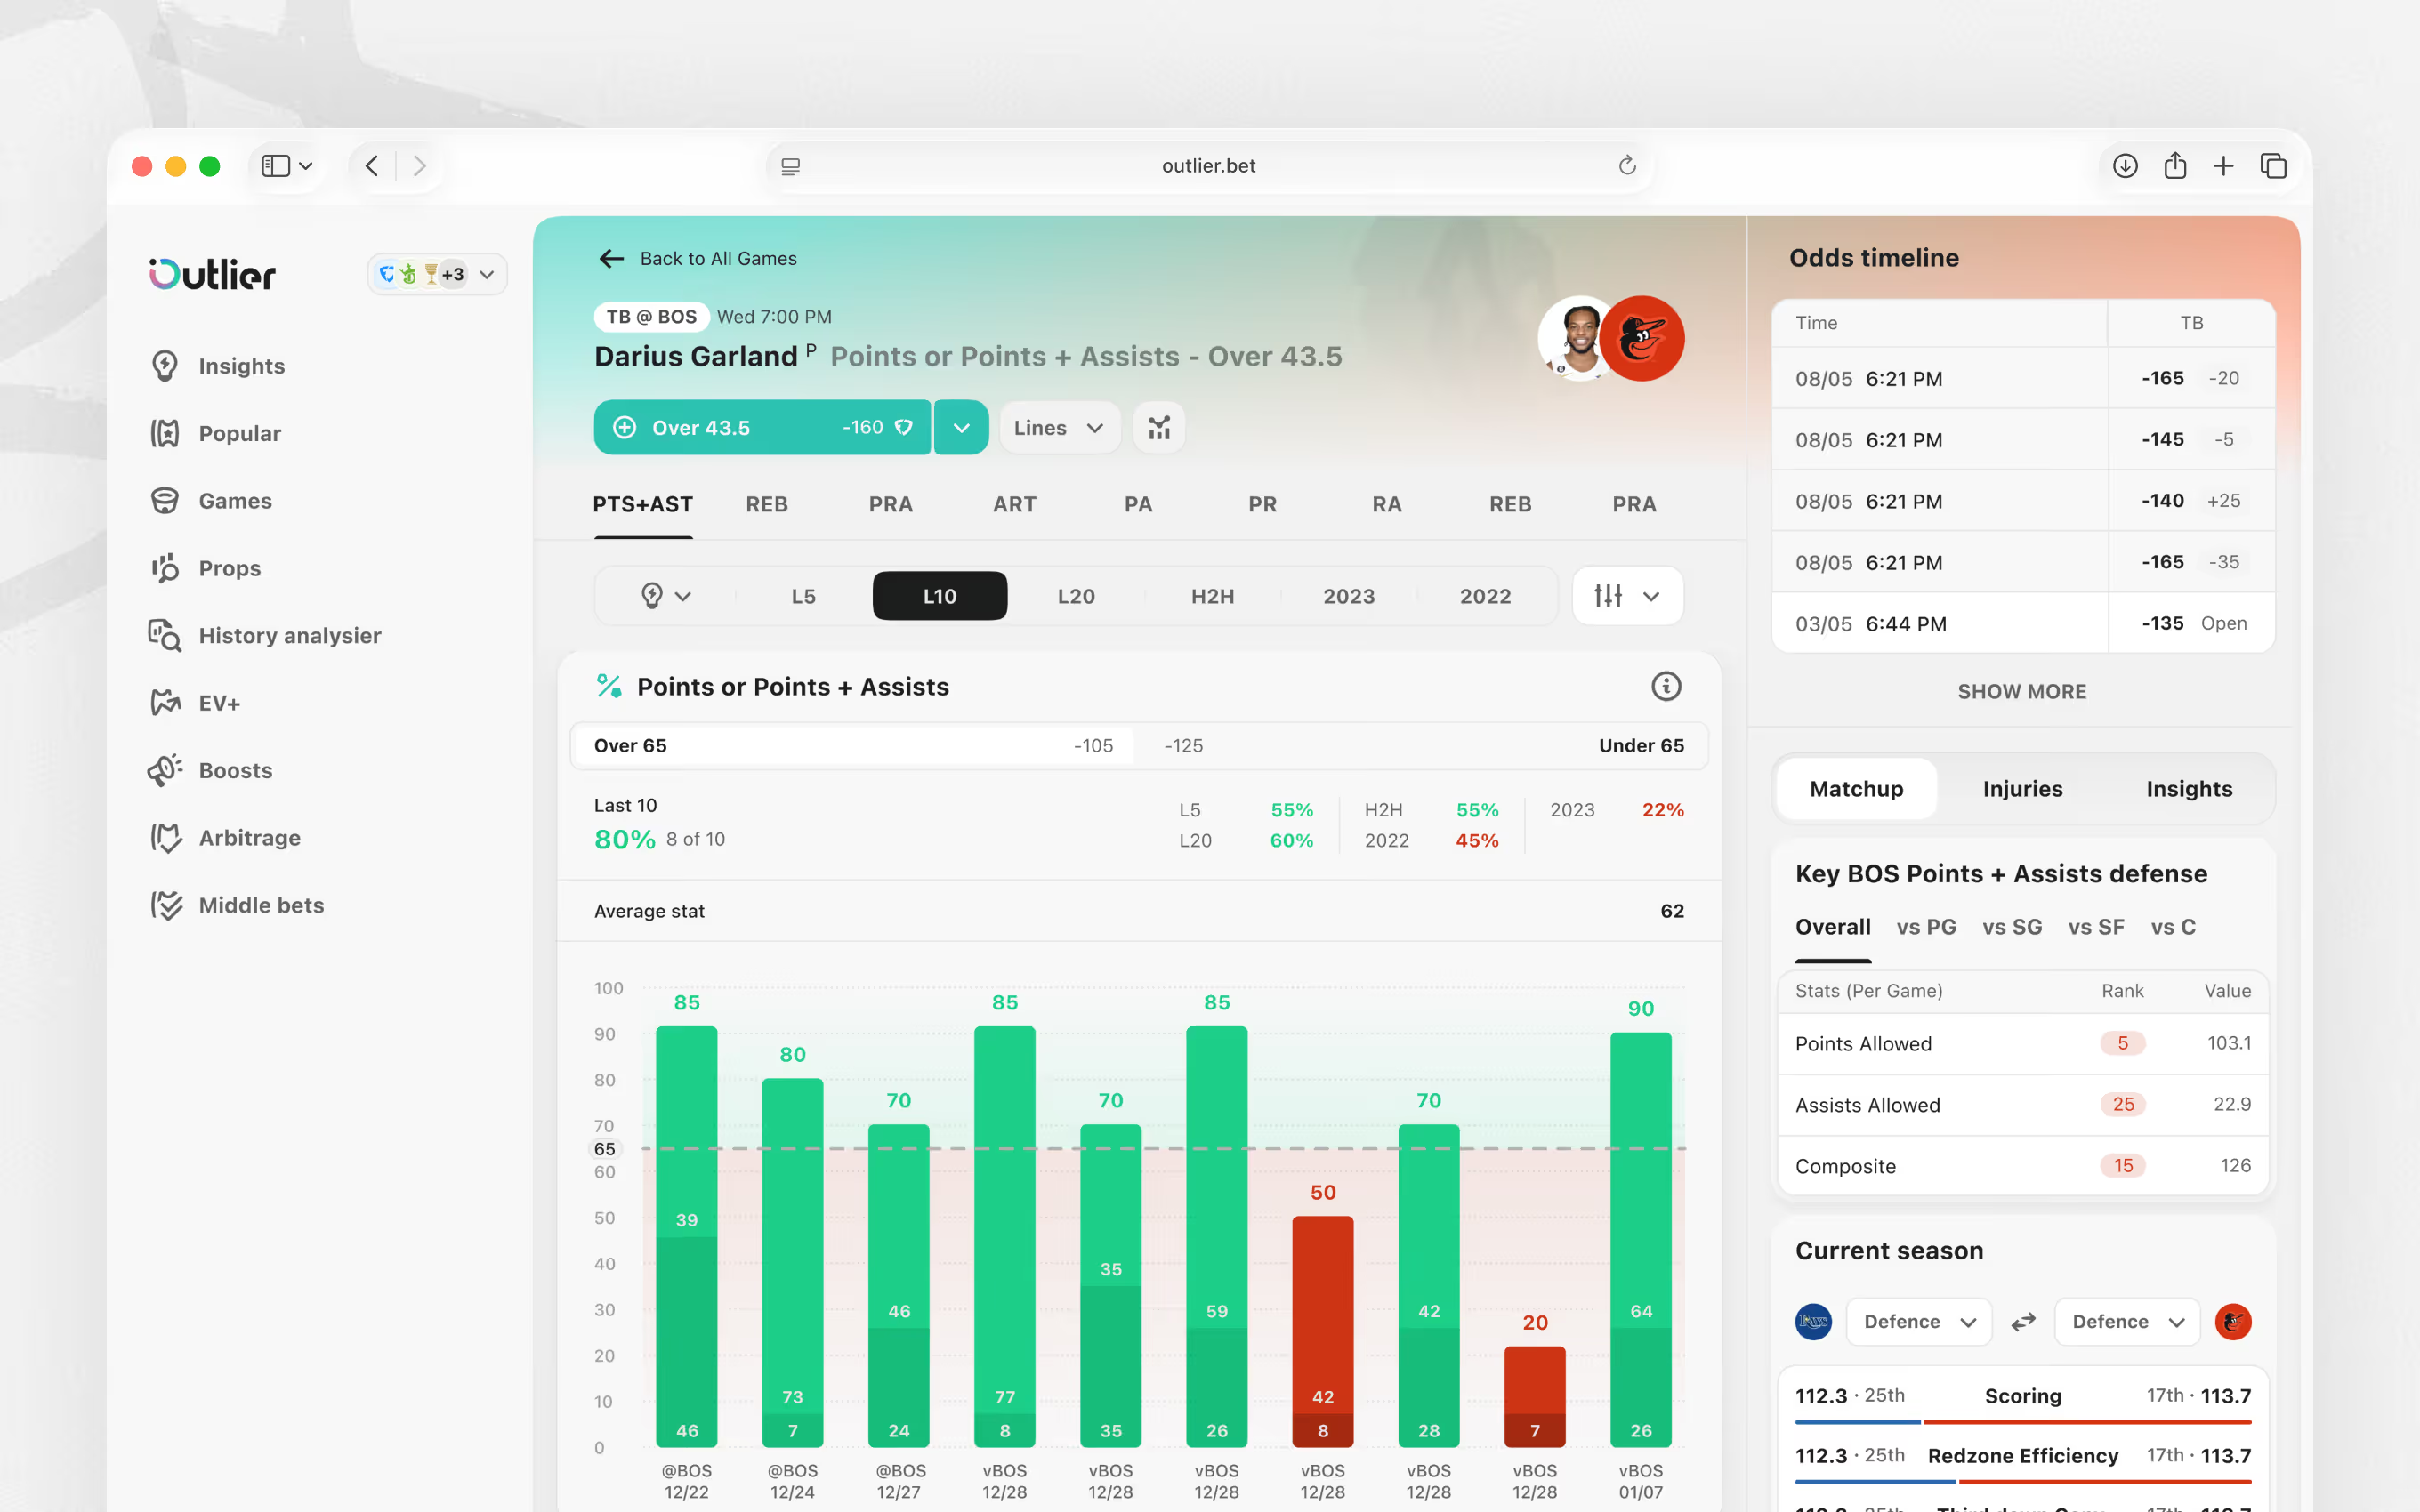
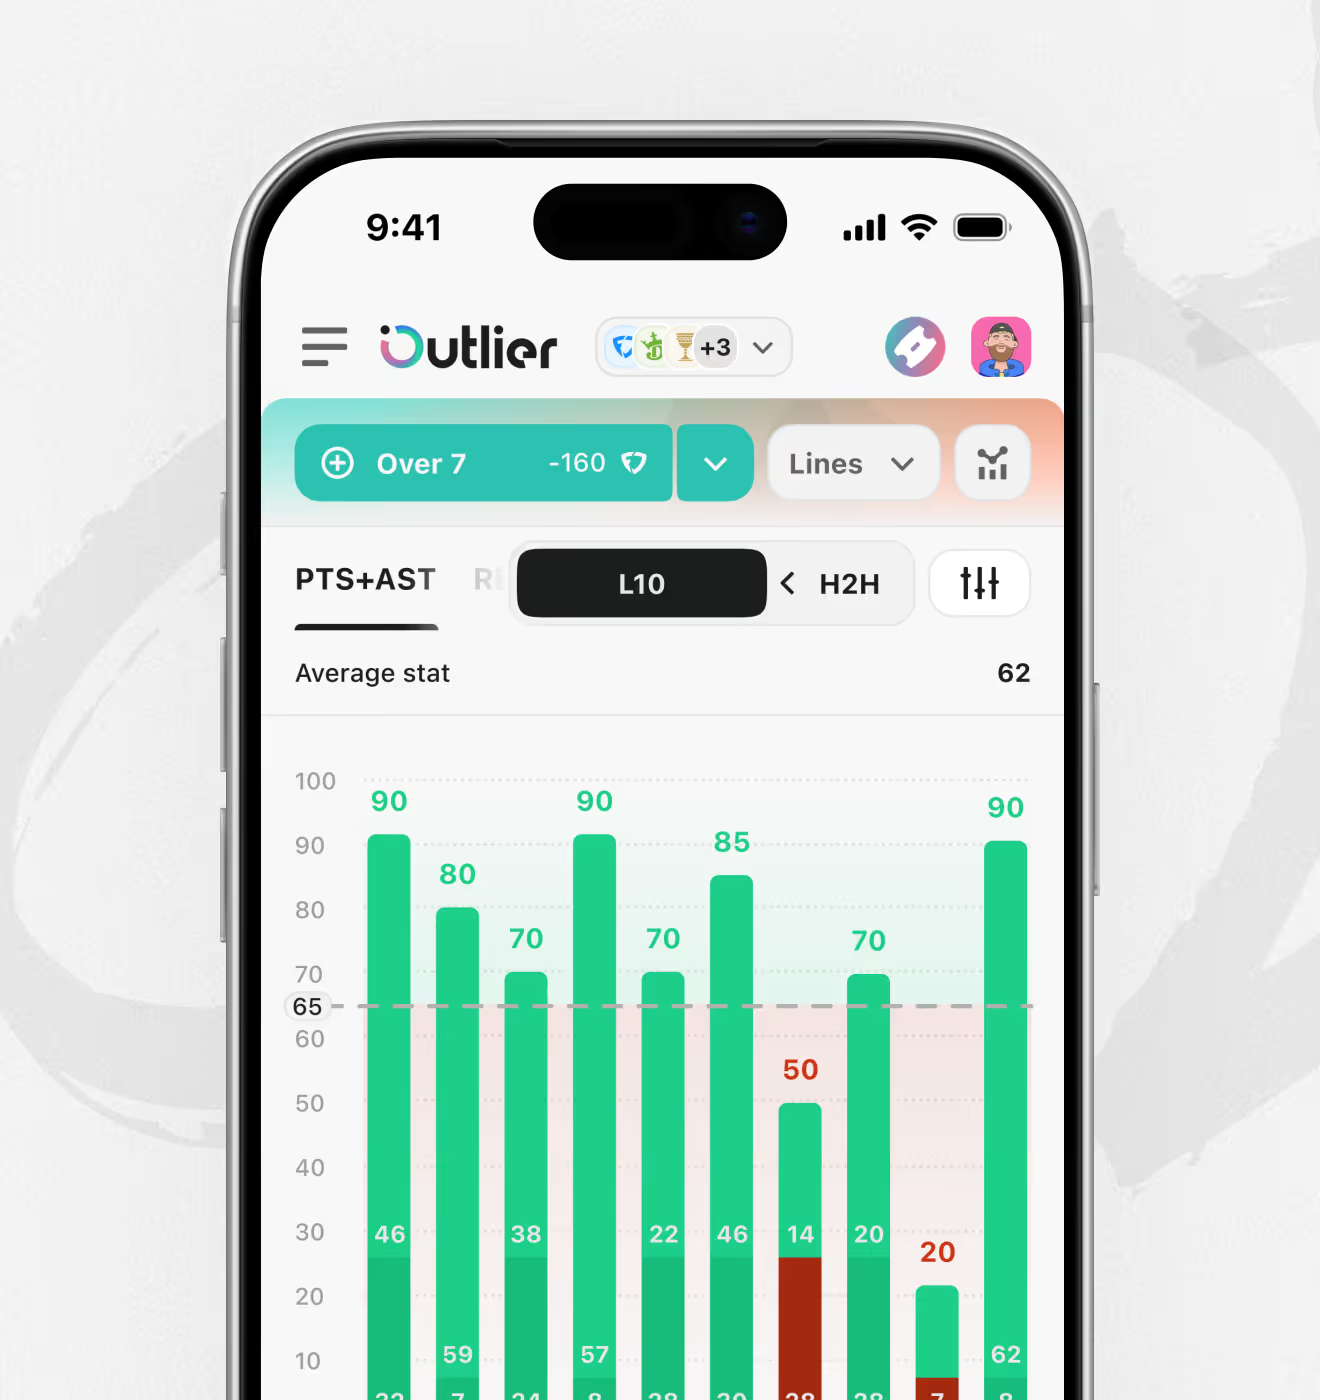
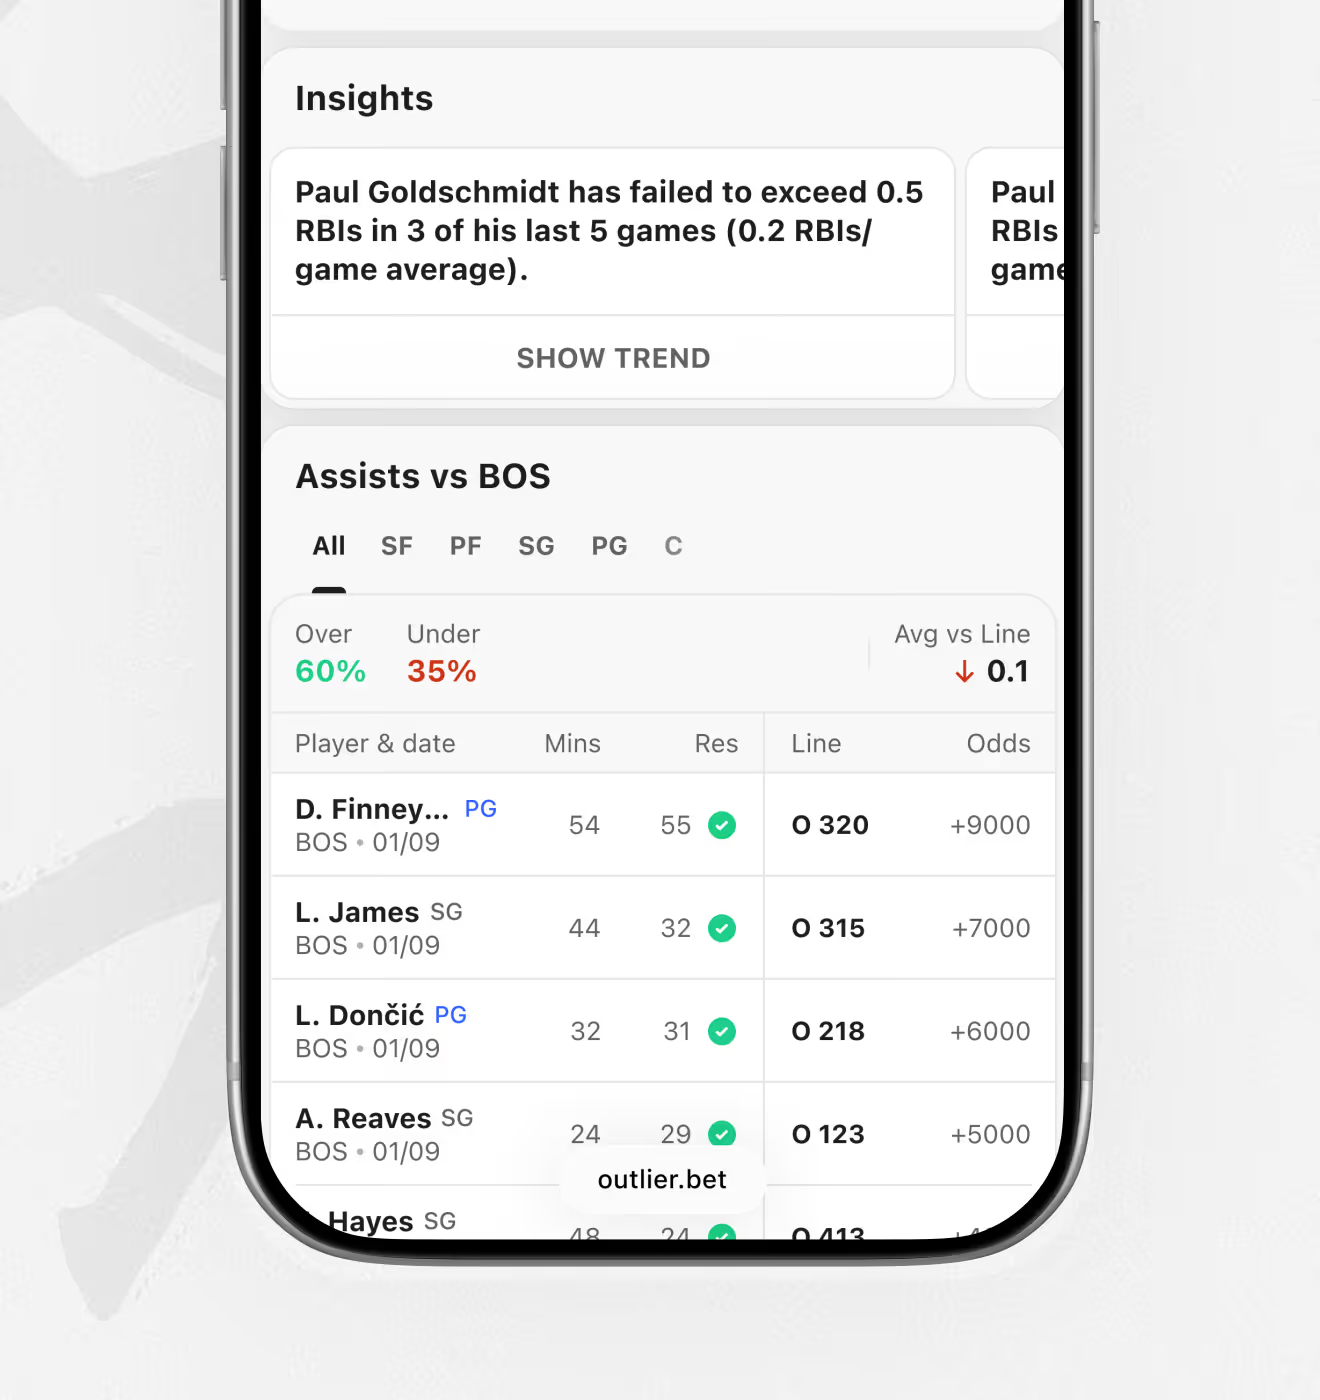
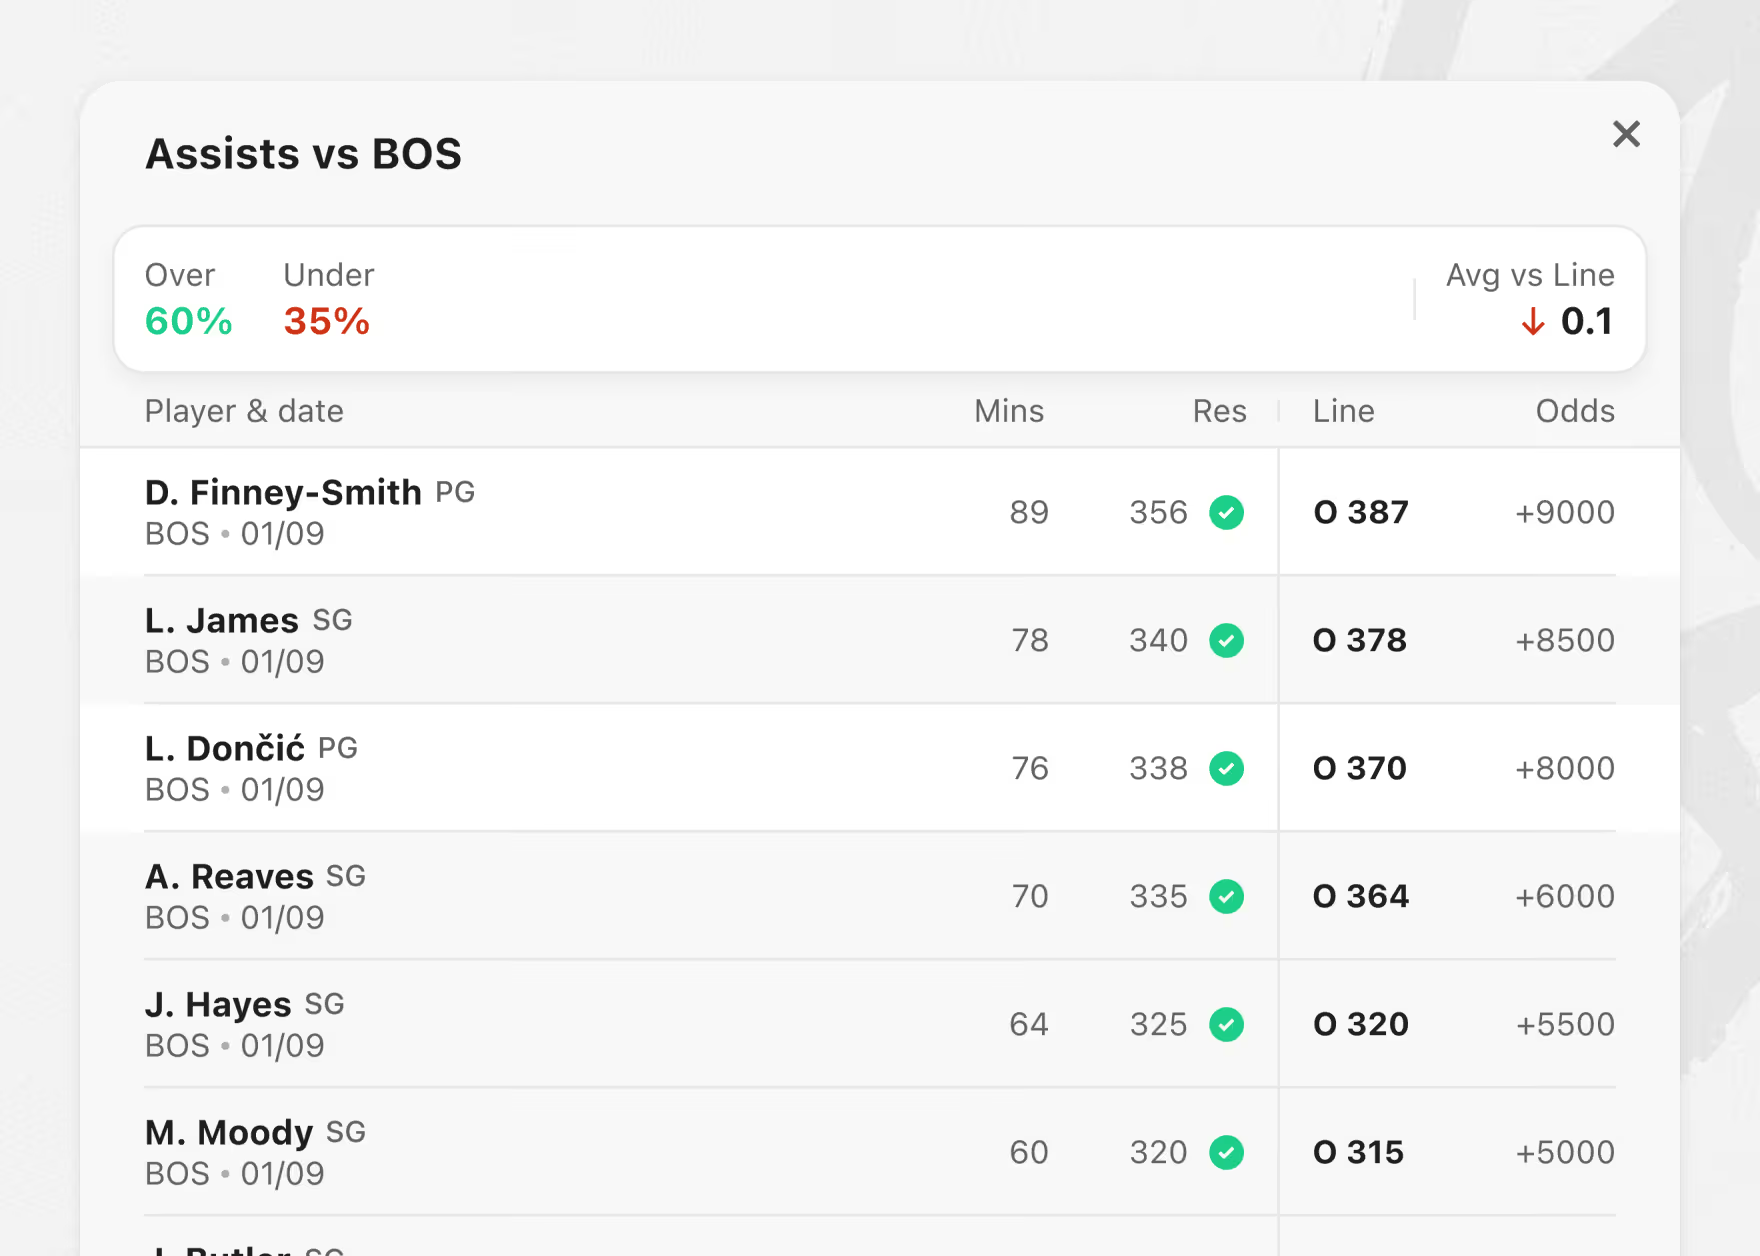
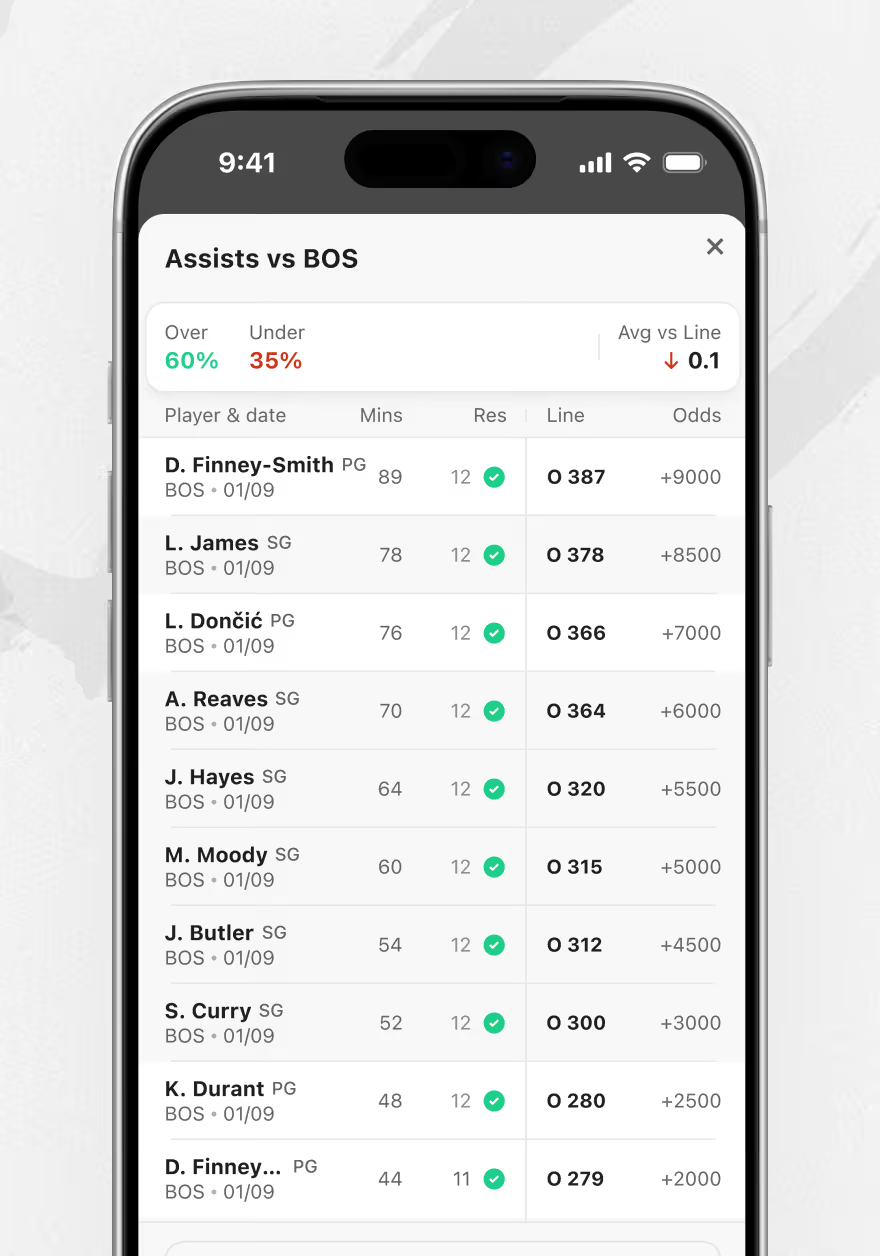
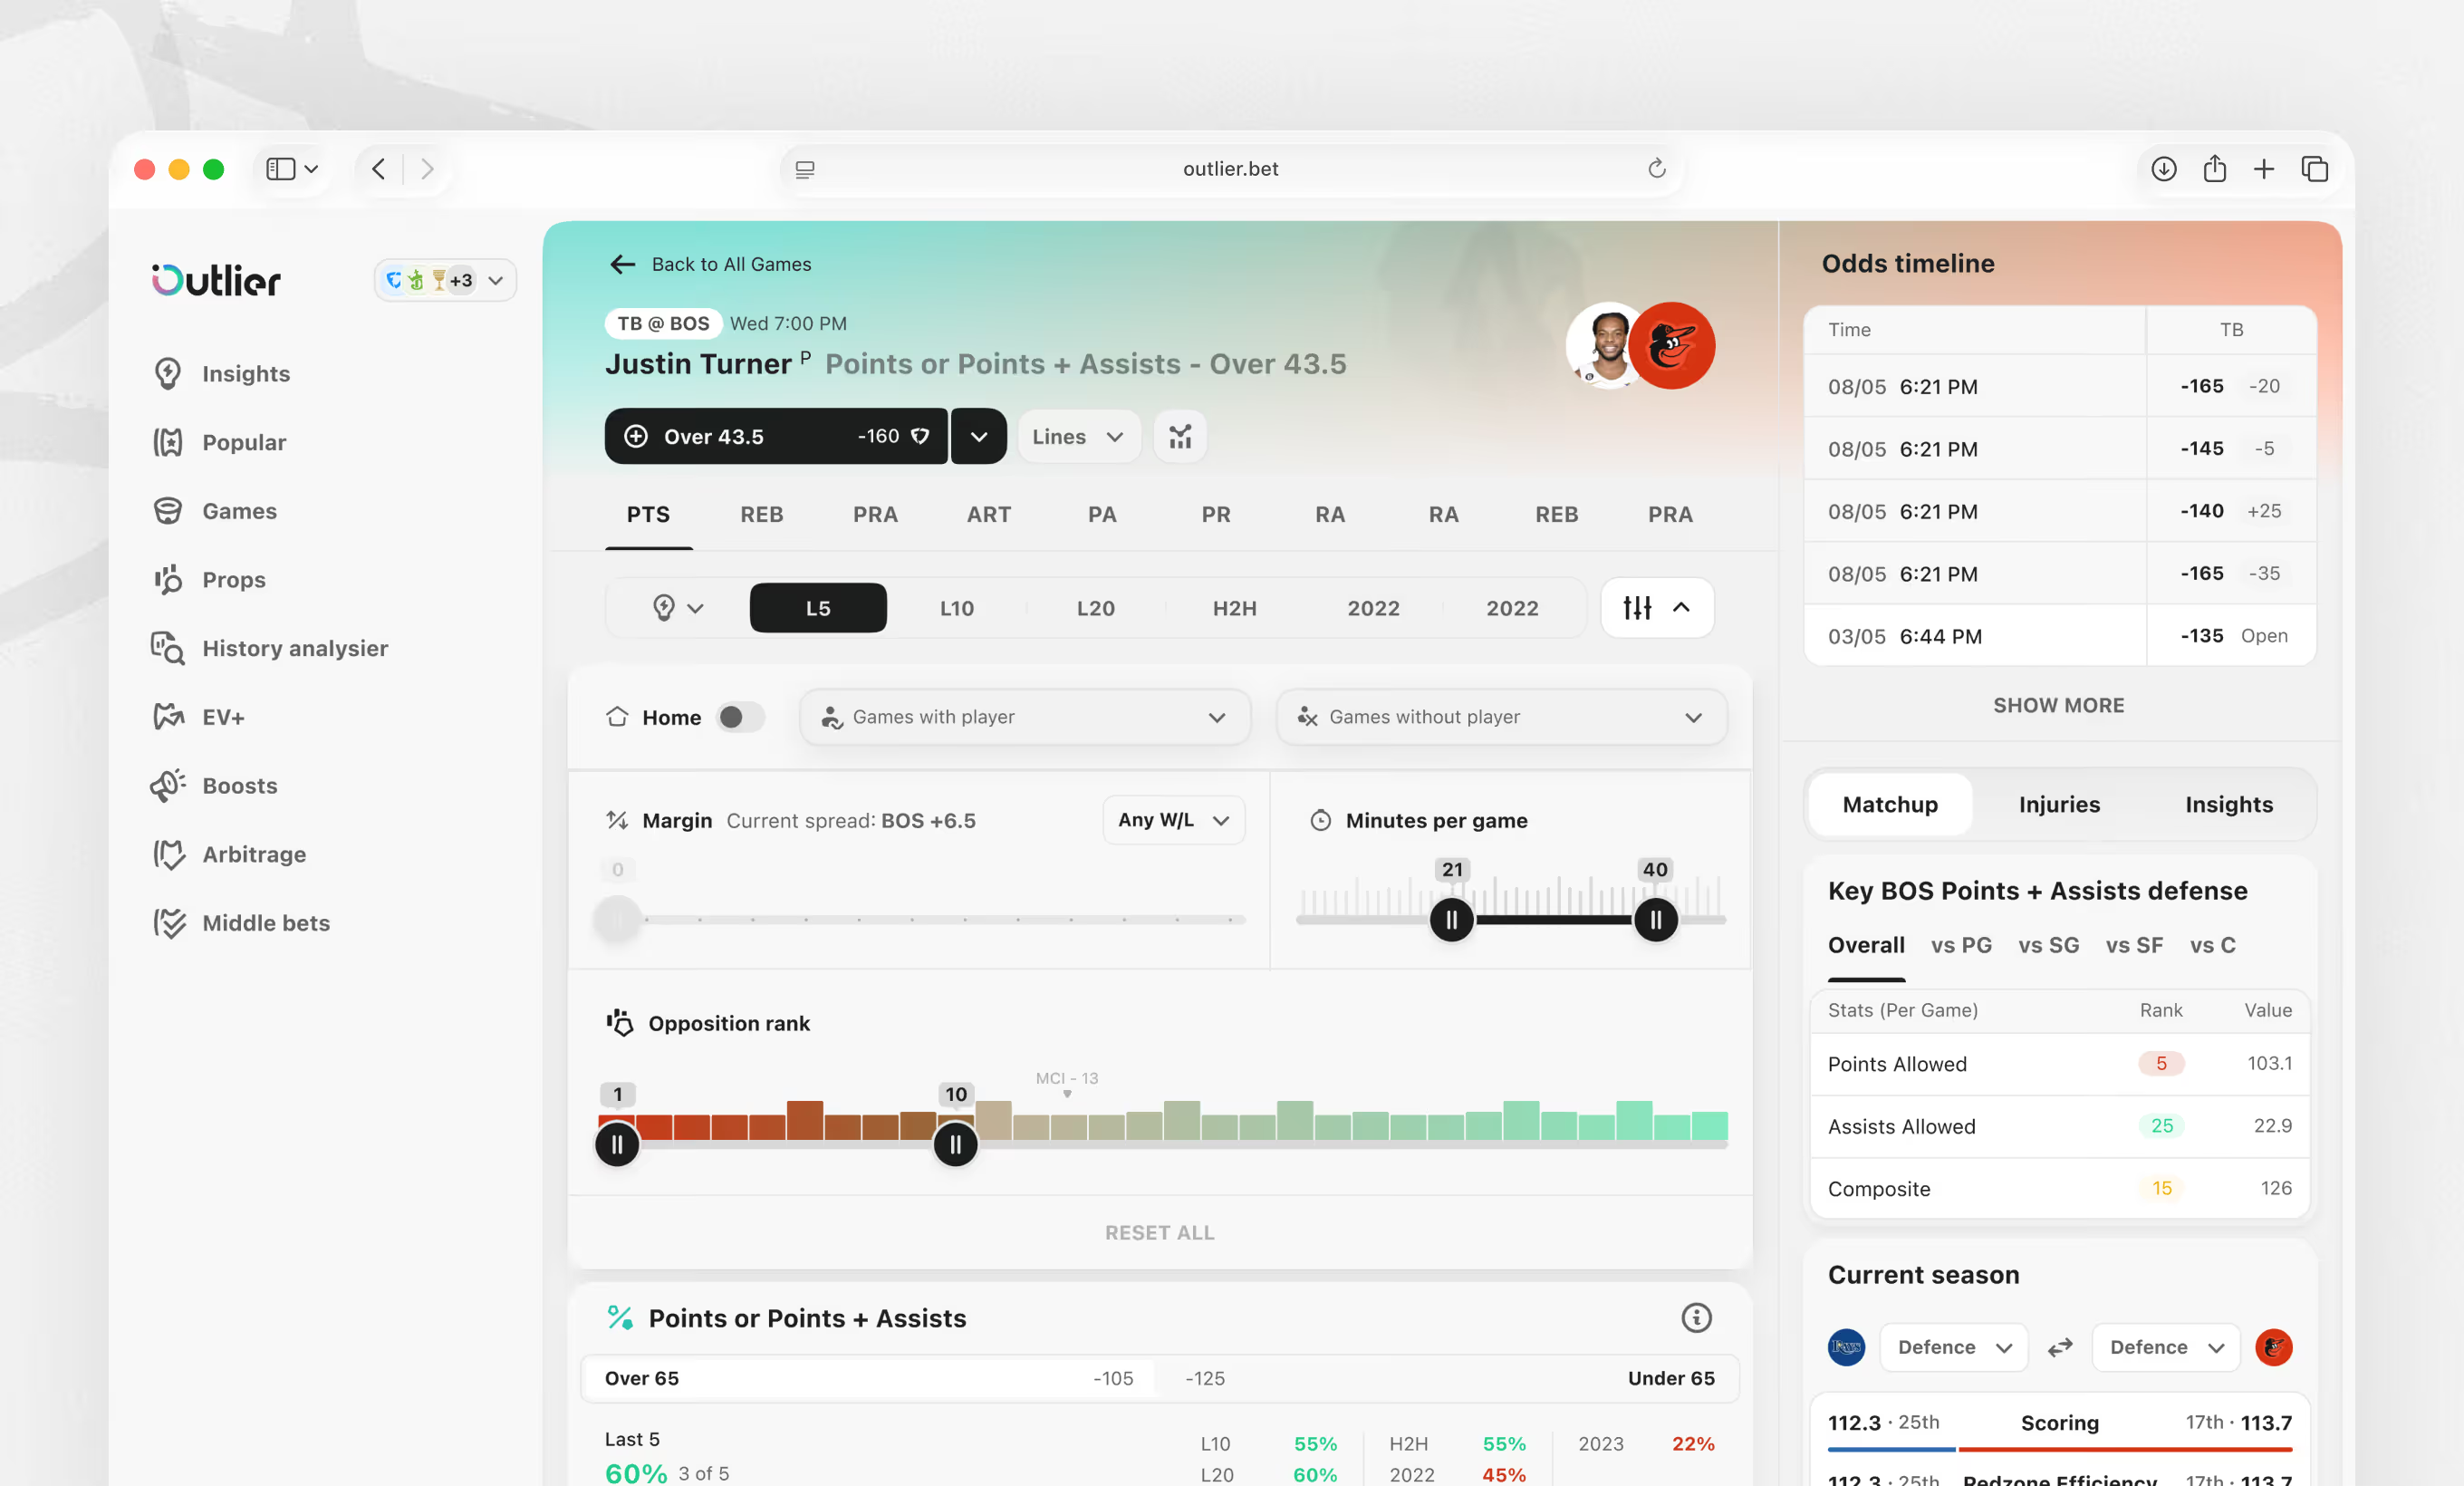
Granular filters on a single player prop, built for bettors who want more than a listed line. Sliders adjust margin, minutes per game, and opposition rank, next to L5, L10, and H2H hit-rate breakdowns.
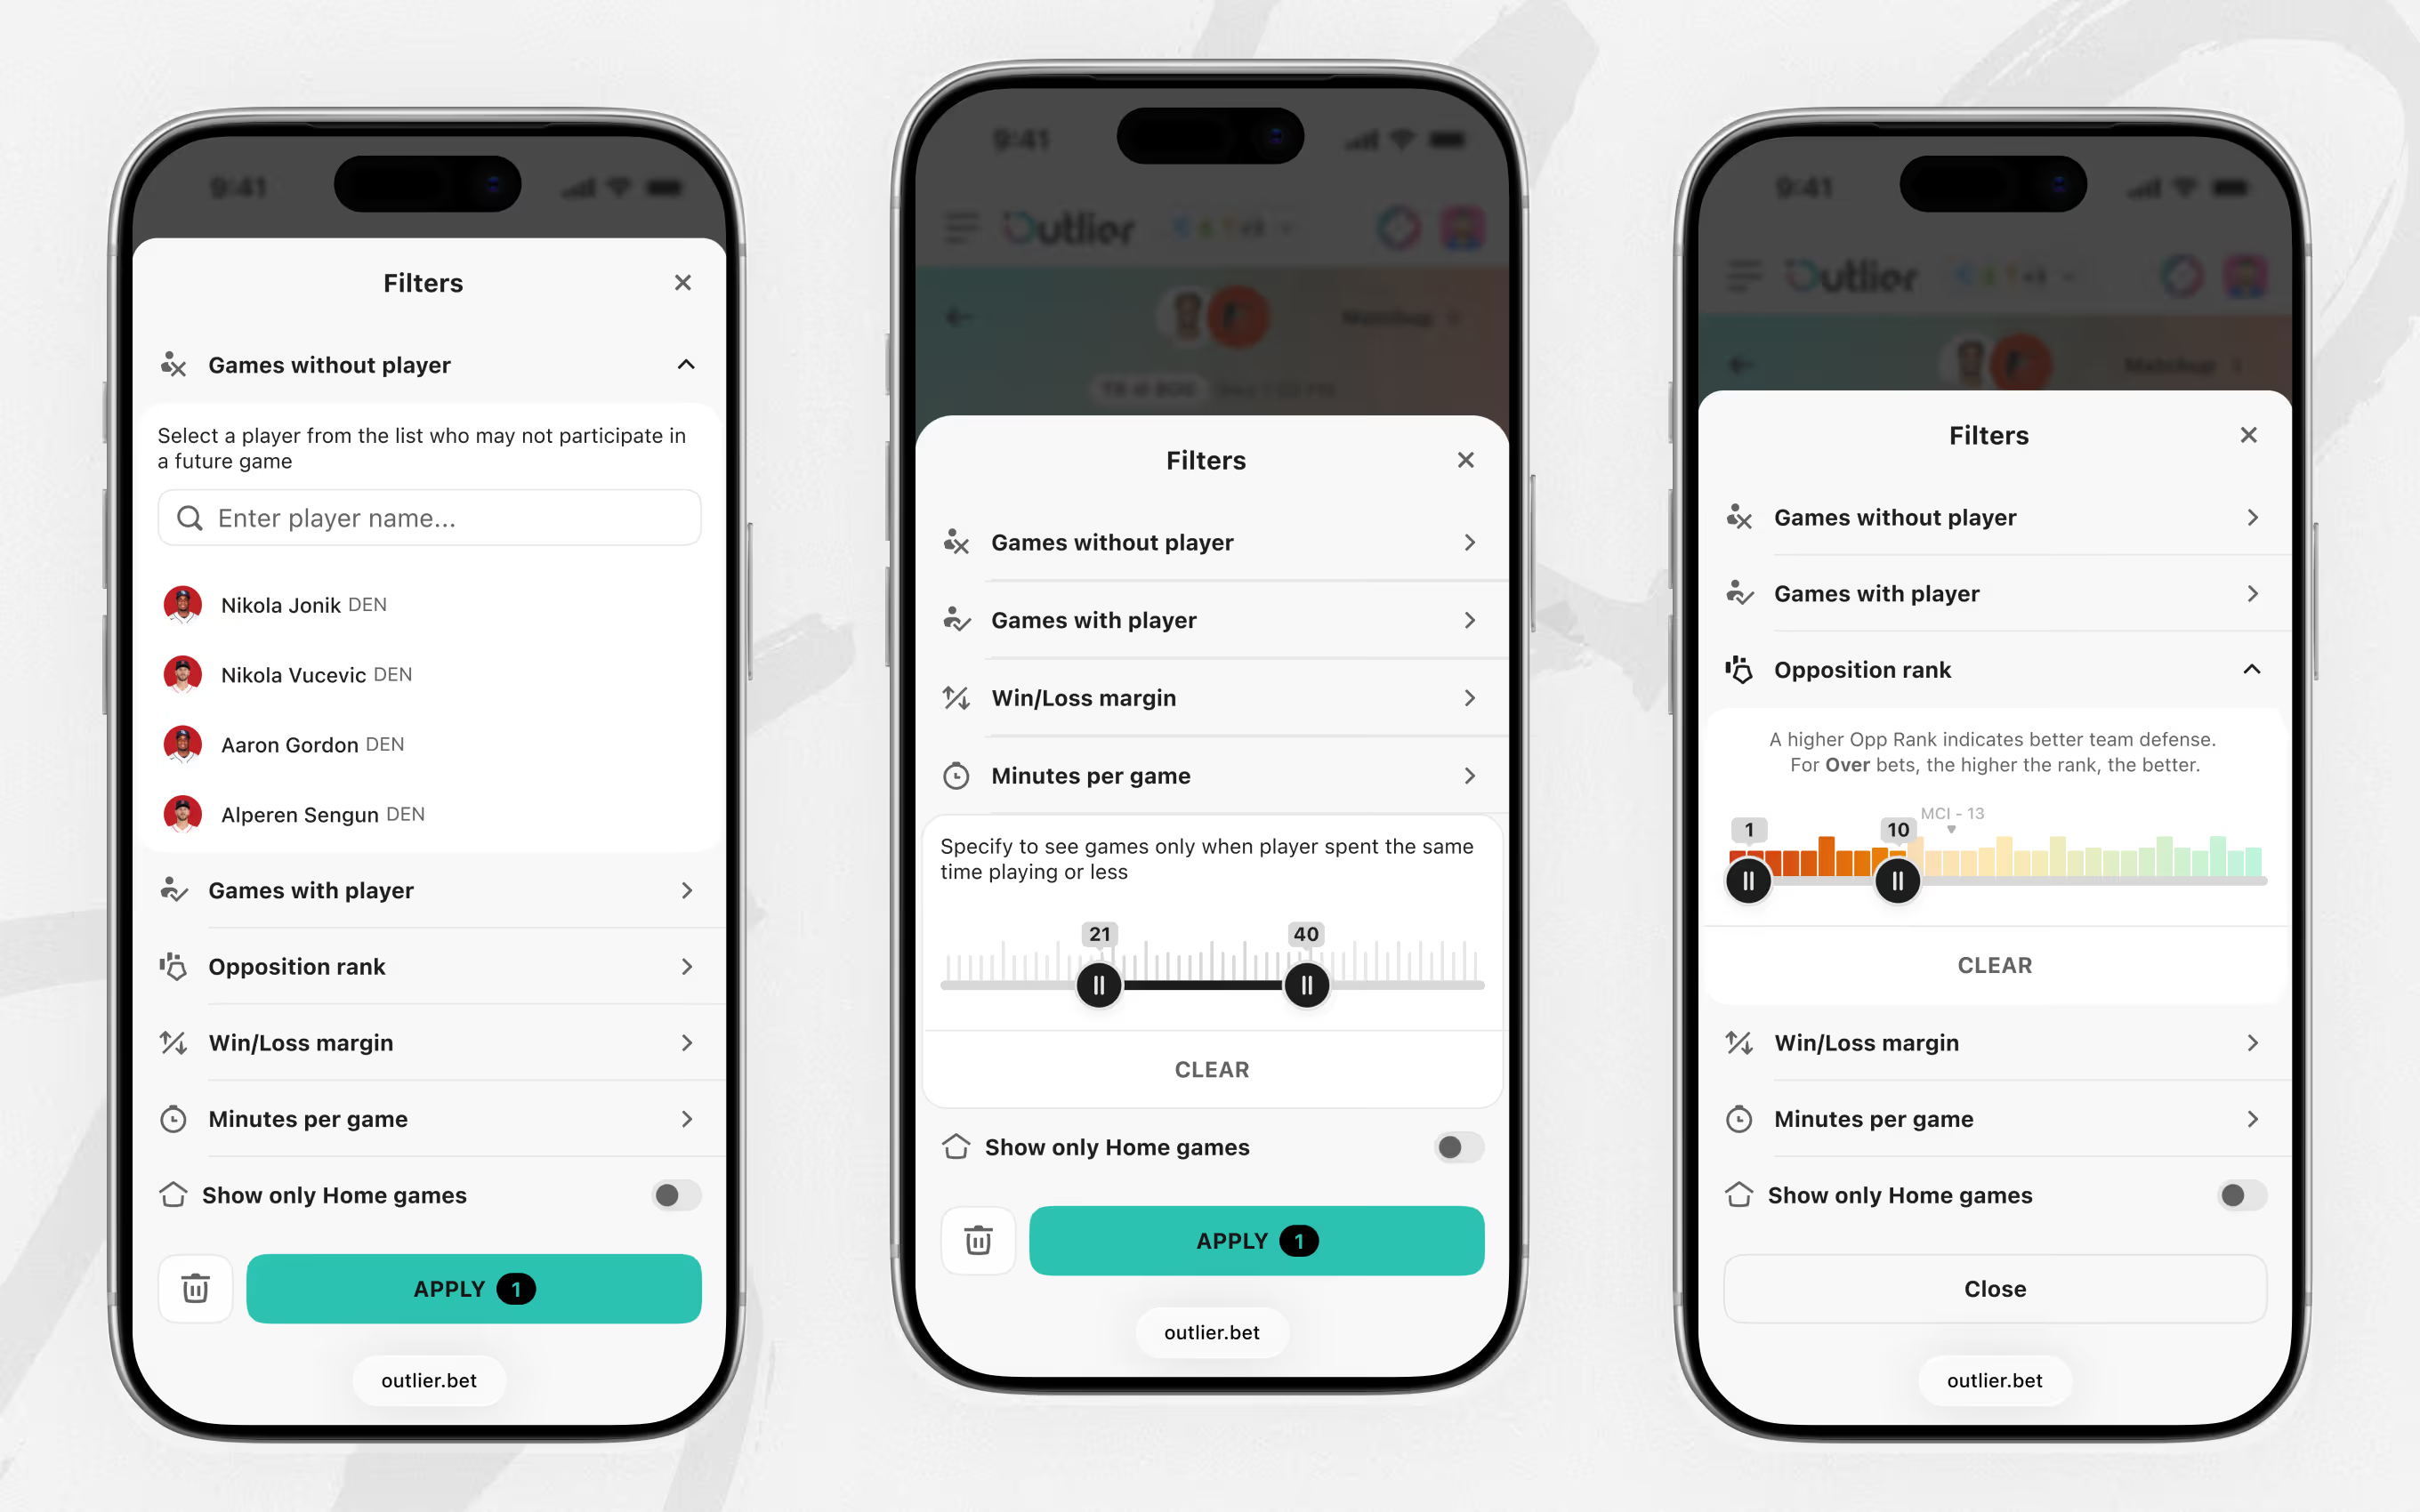
The same player prop filters adapted for a mobile screen, built for bettors filtering odds on the go. Games with or without a specific player, opposition rank, win/loss margin, and a home-games toggle each get their own panel.
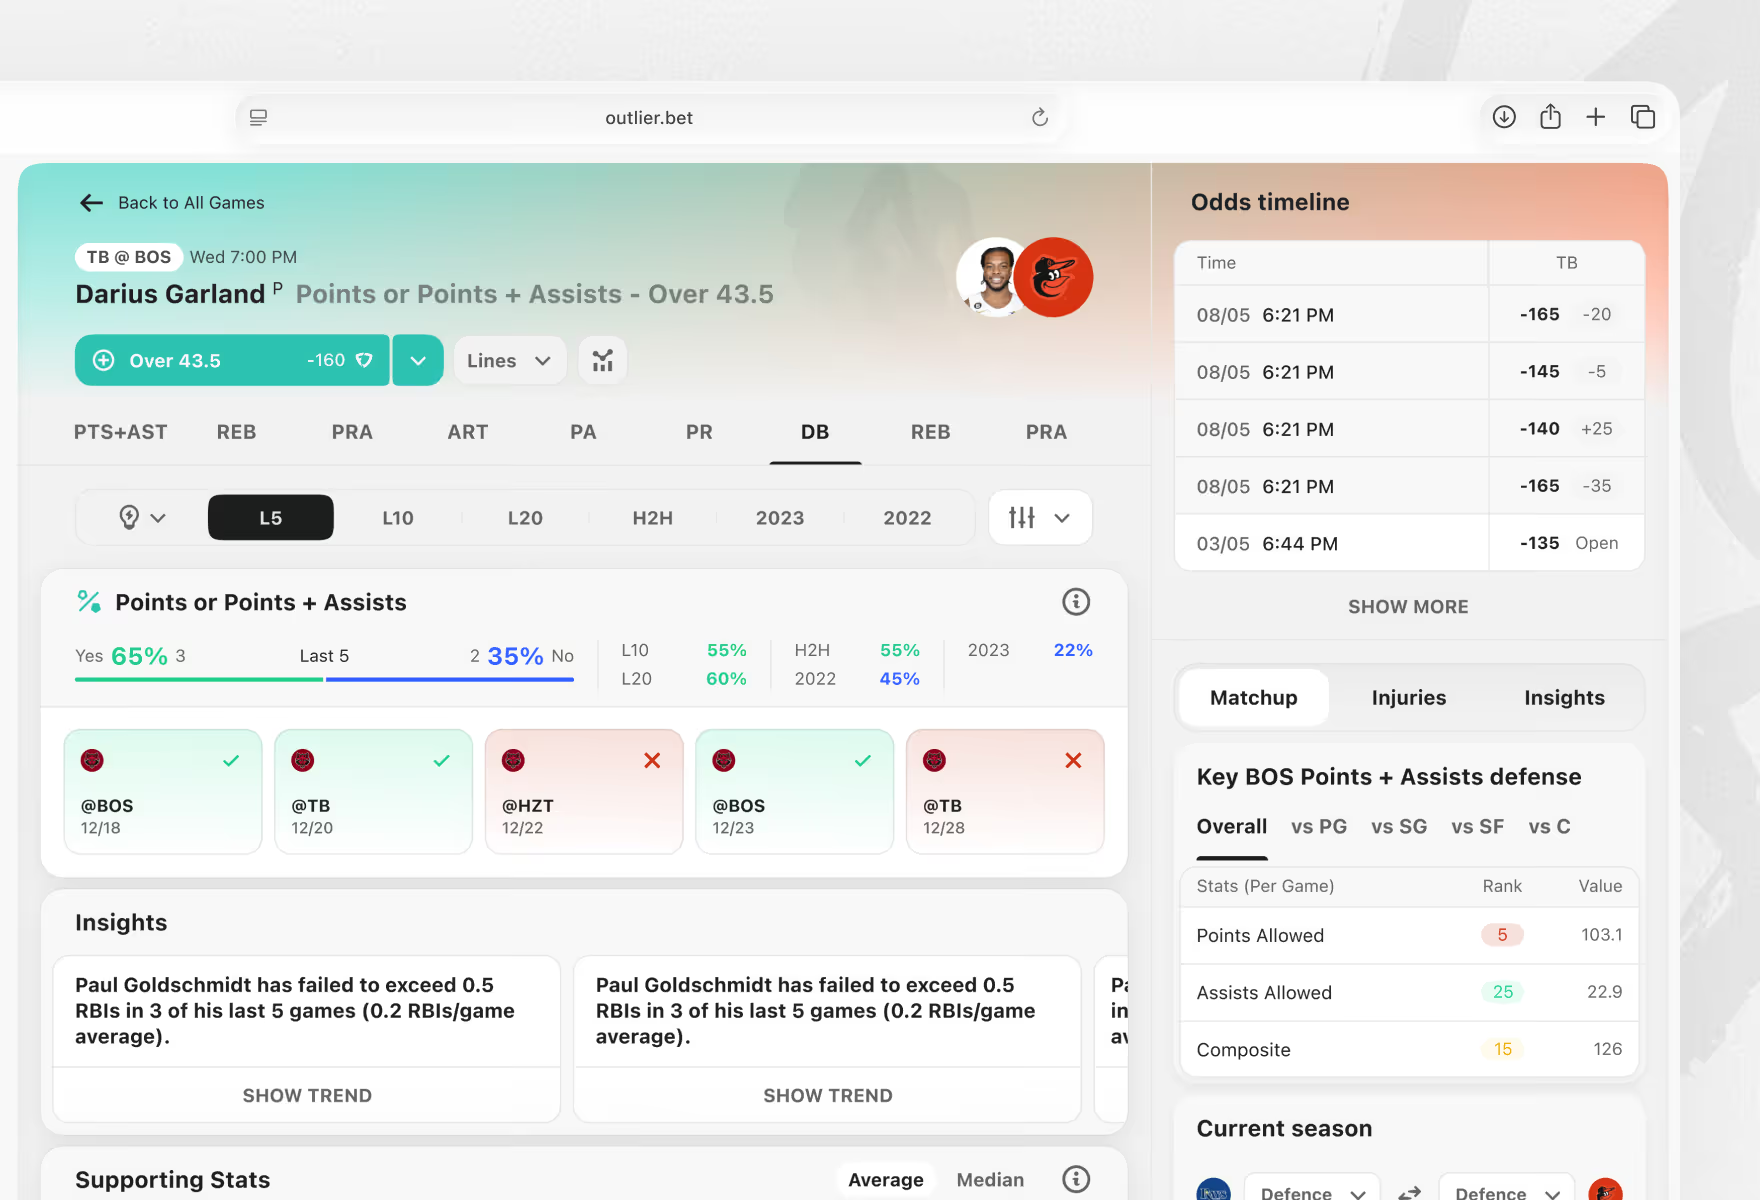

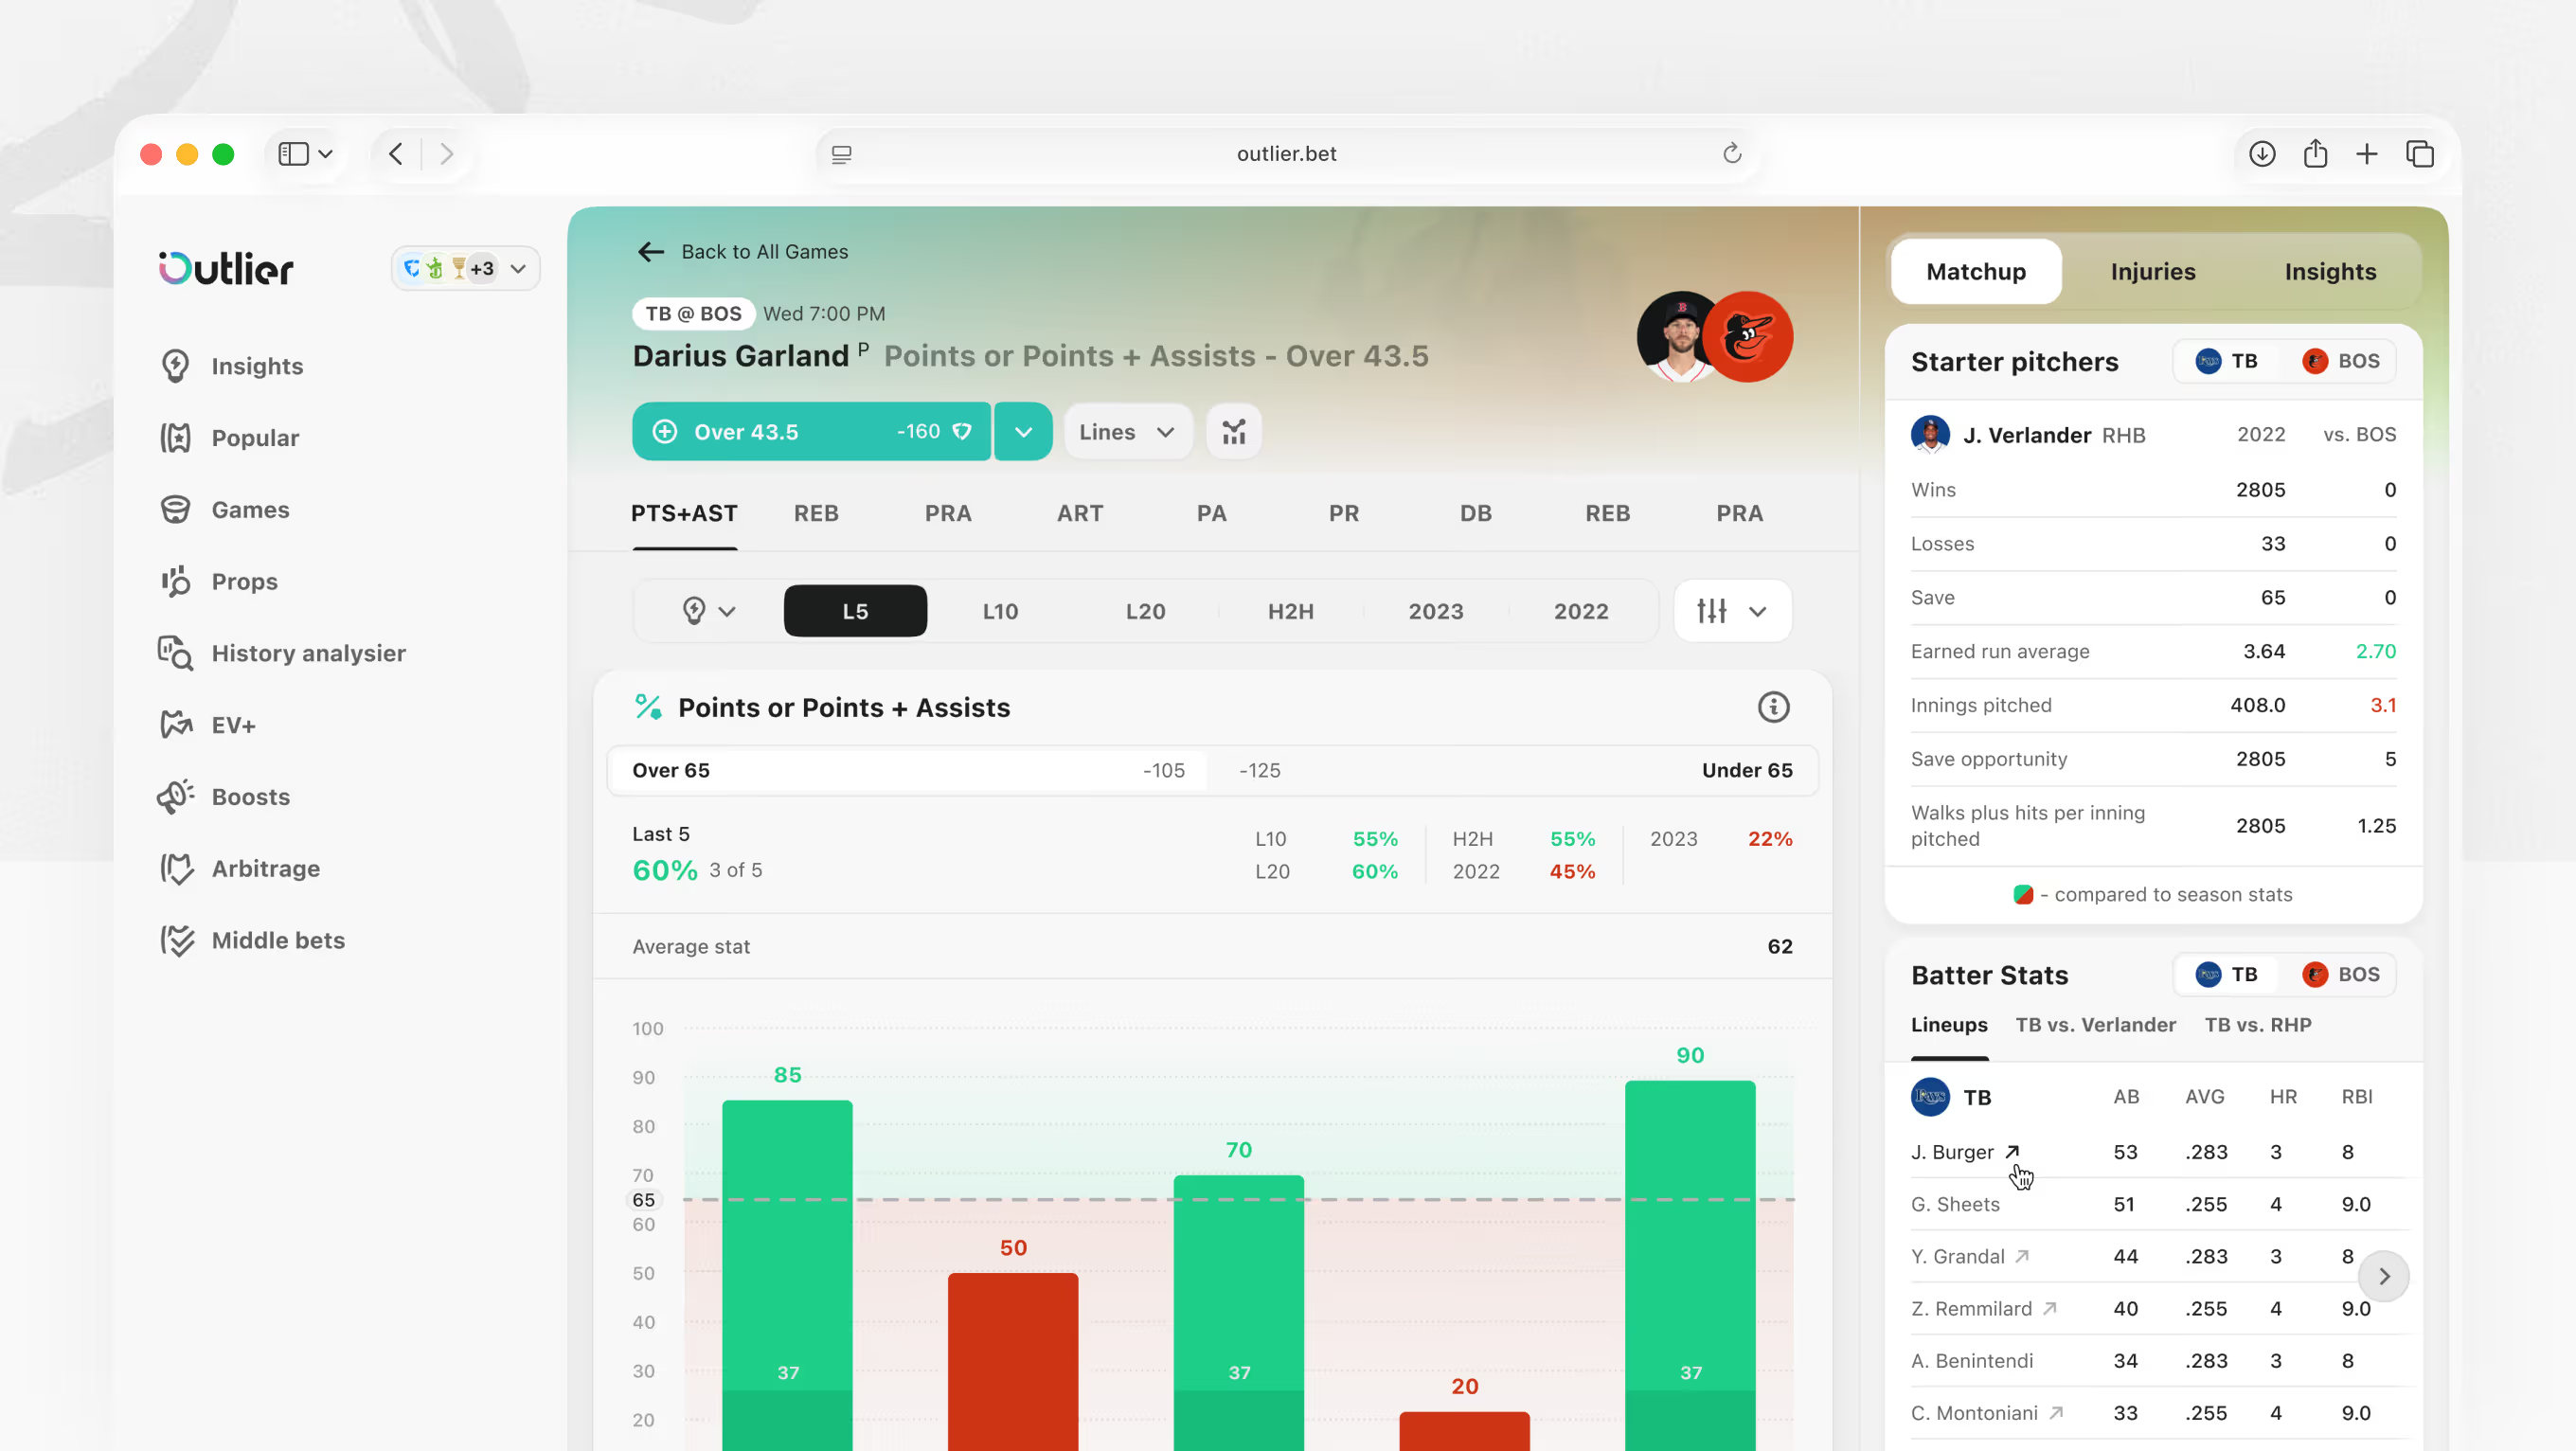
Sport-specific data layered onto player props for MLB bettors, beyond a generic stat line. Starting pitcher stats, a pitch arsenal broken down by pitch type, and ballpark and weather factors sit on one screen.
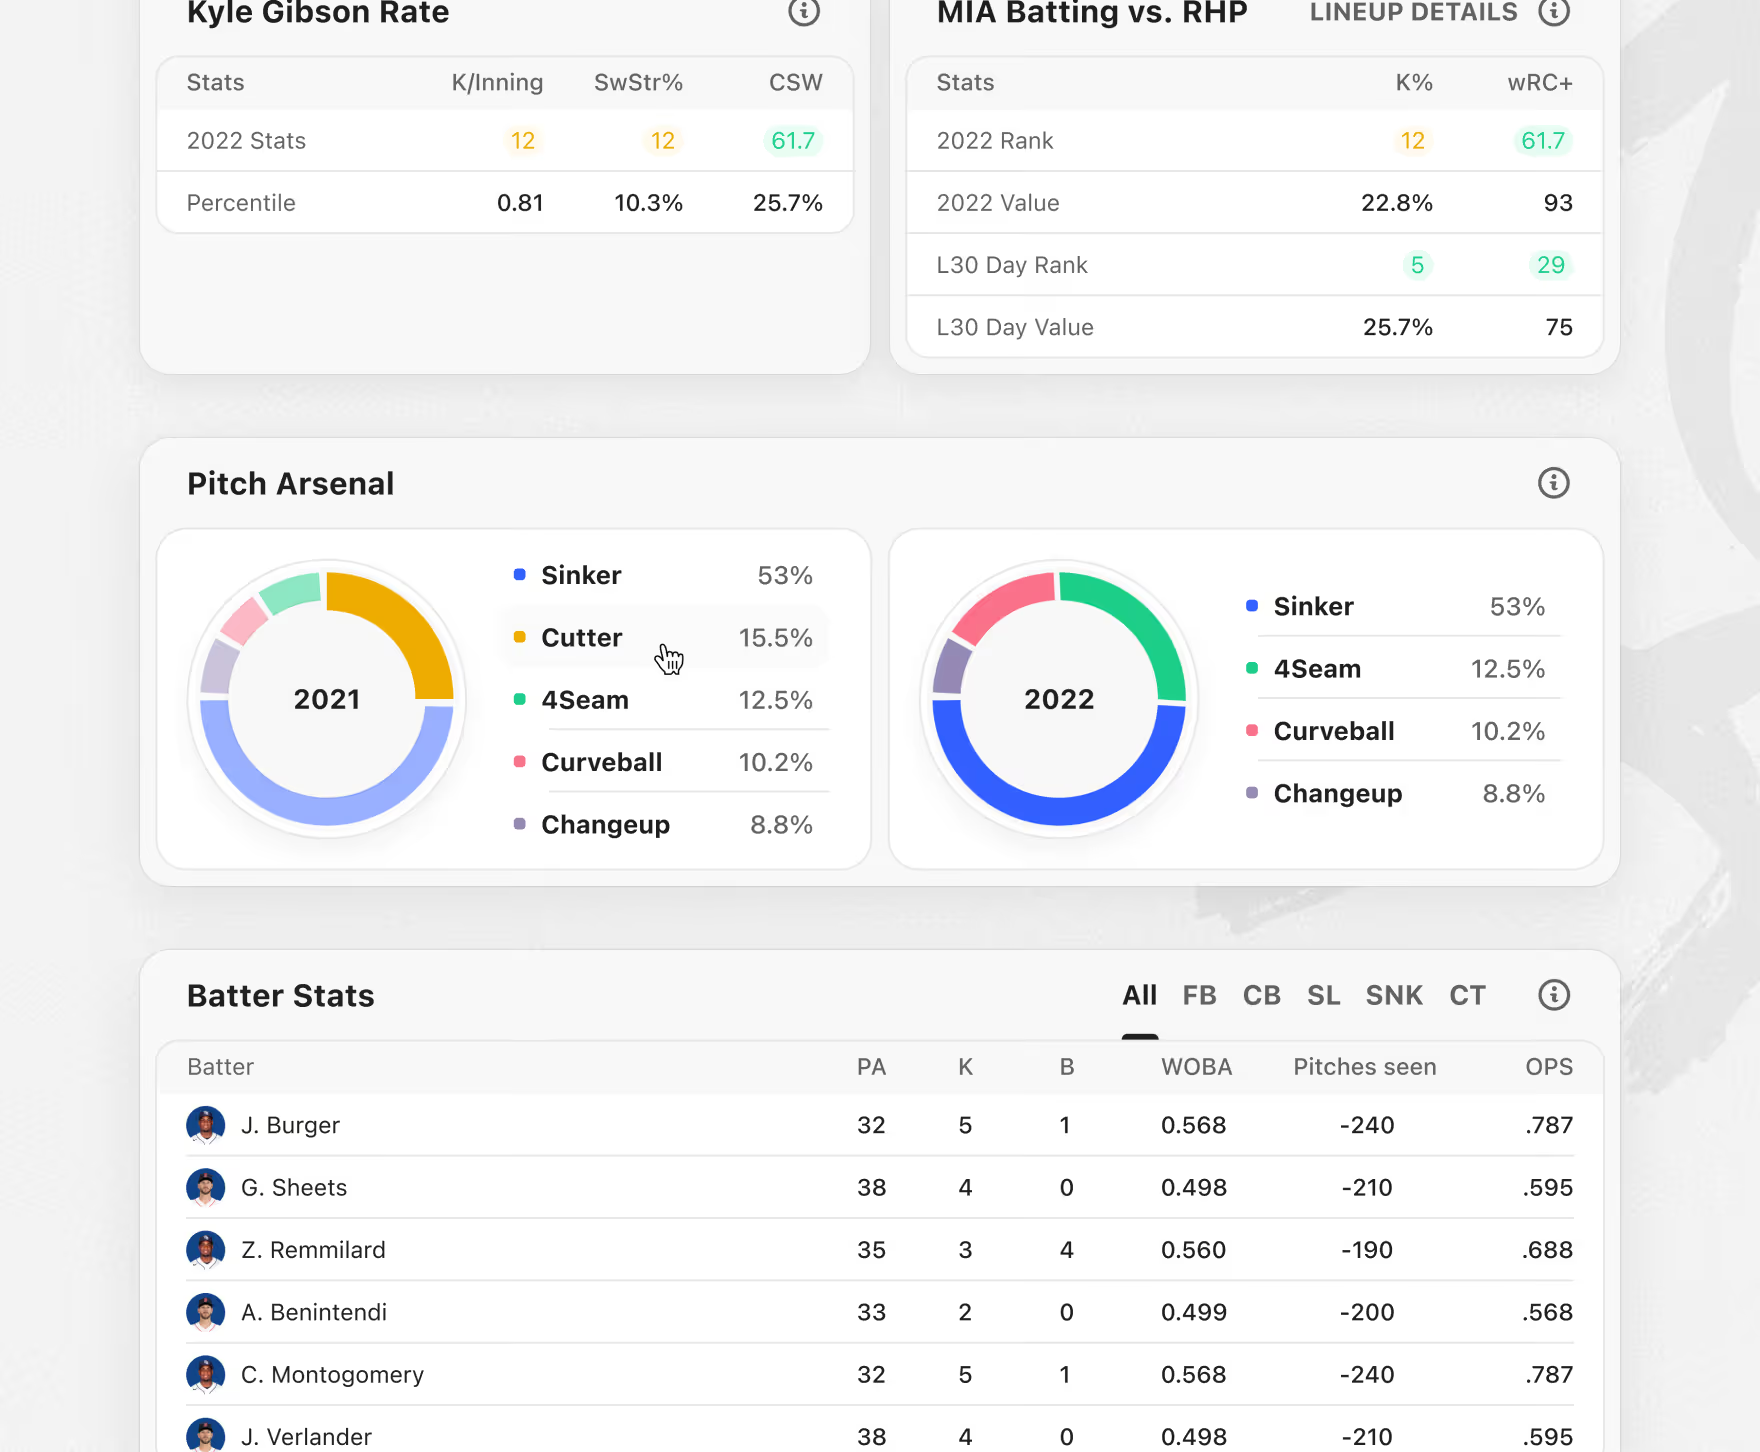
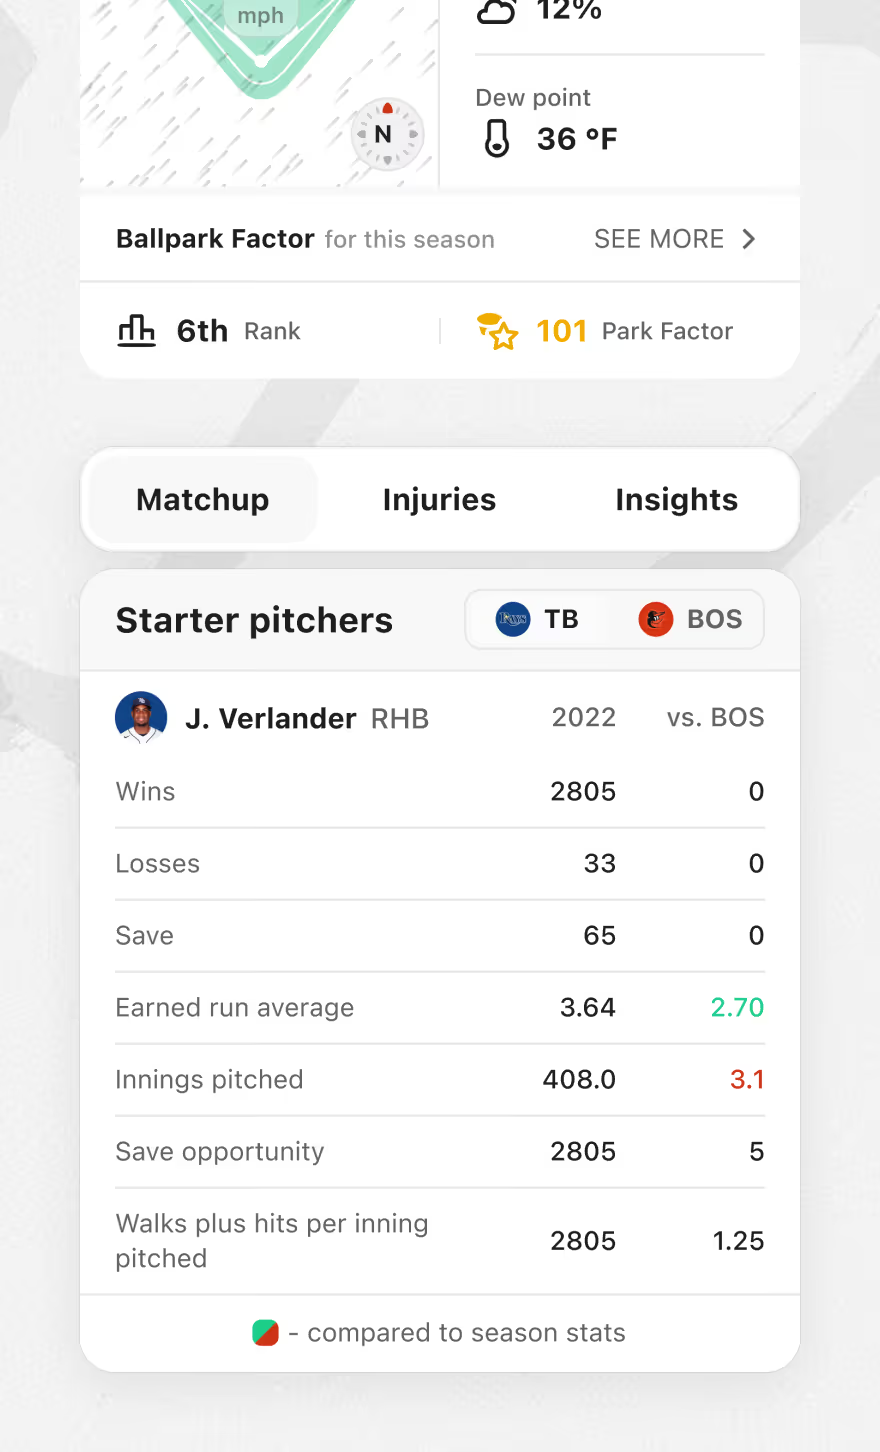
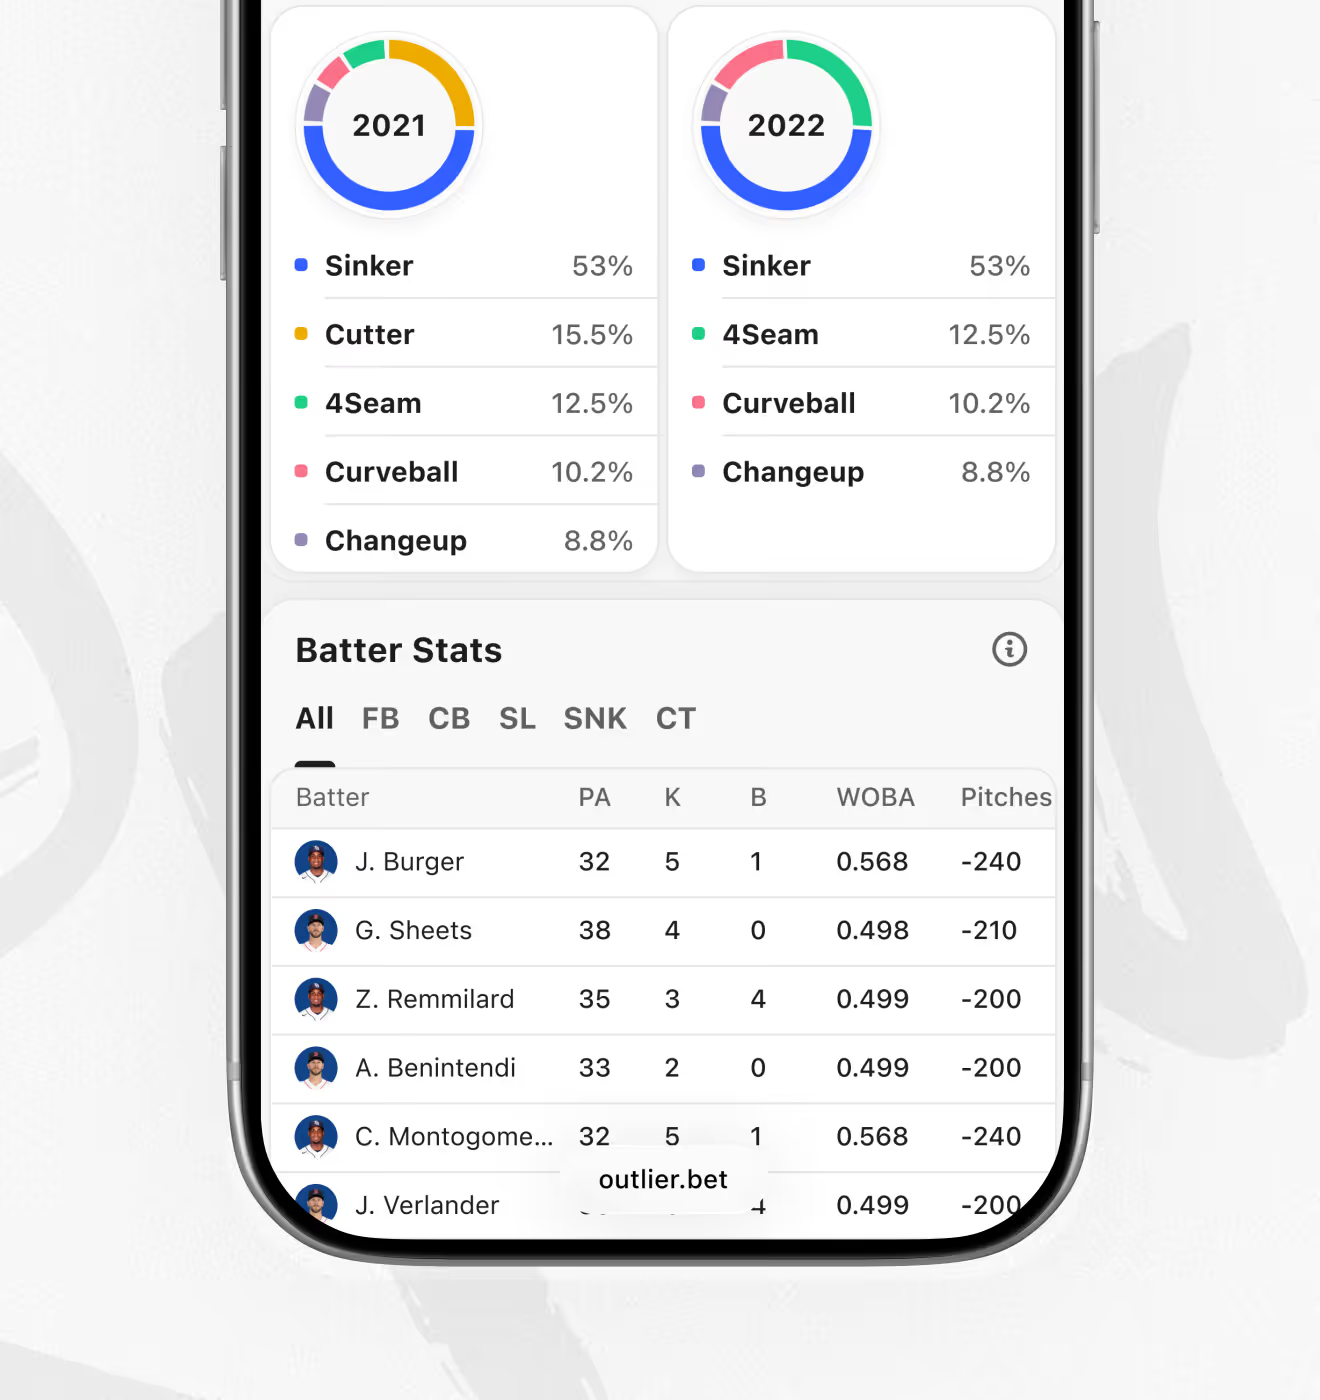
The same pitch arsenal and matchup data resized for a mobile browser. Batter stats, pitch arsenal donut charts, and offensive-line blocking percentages carry over from desktop; the platform also has a dedicated Outlier iOS app.
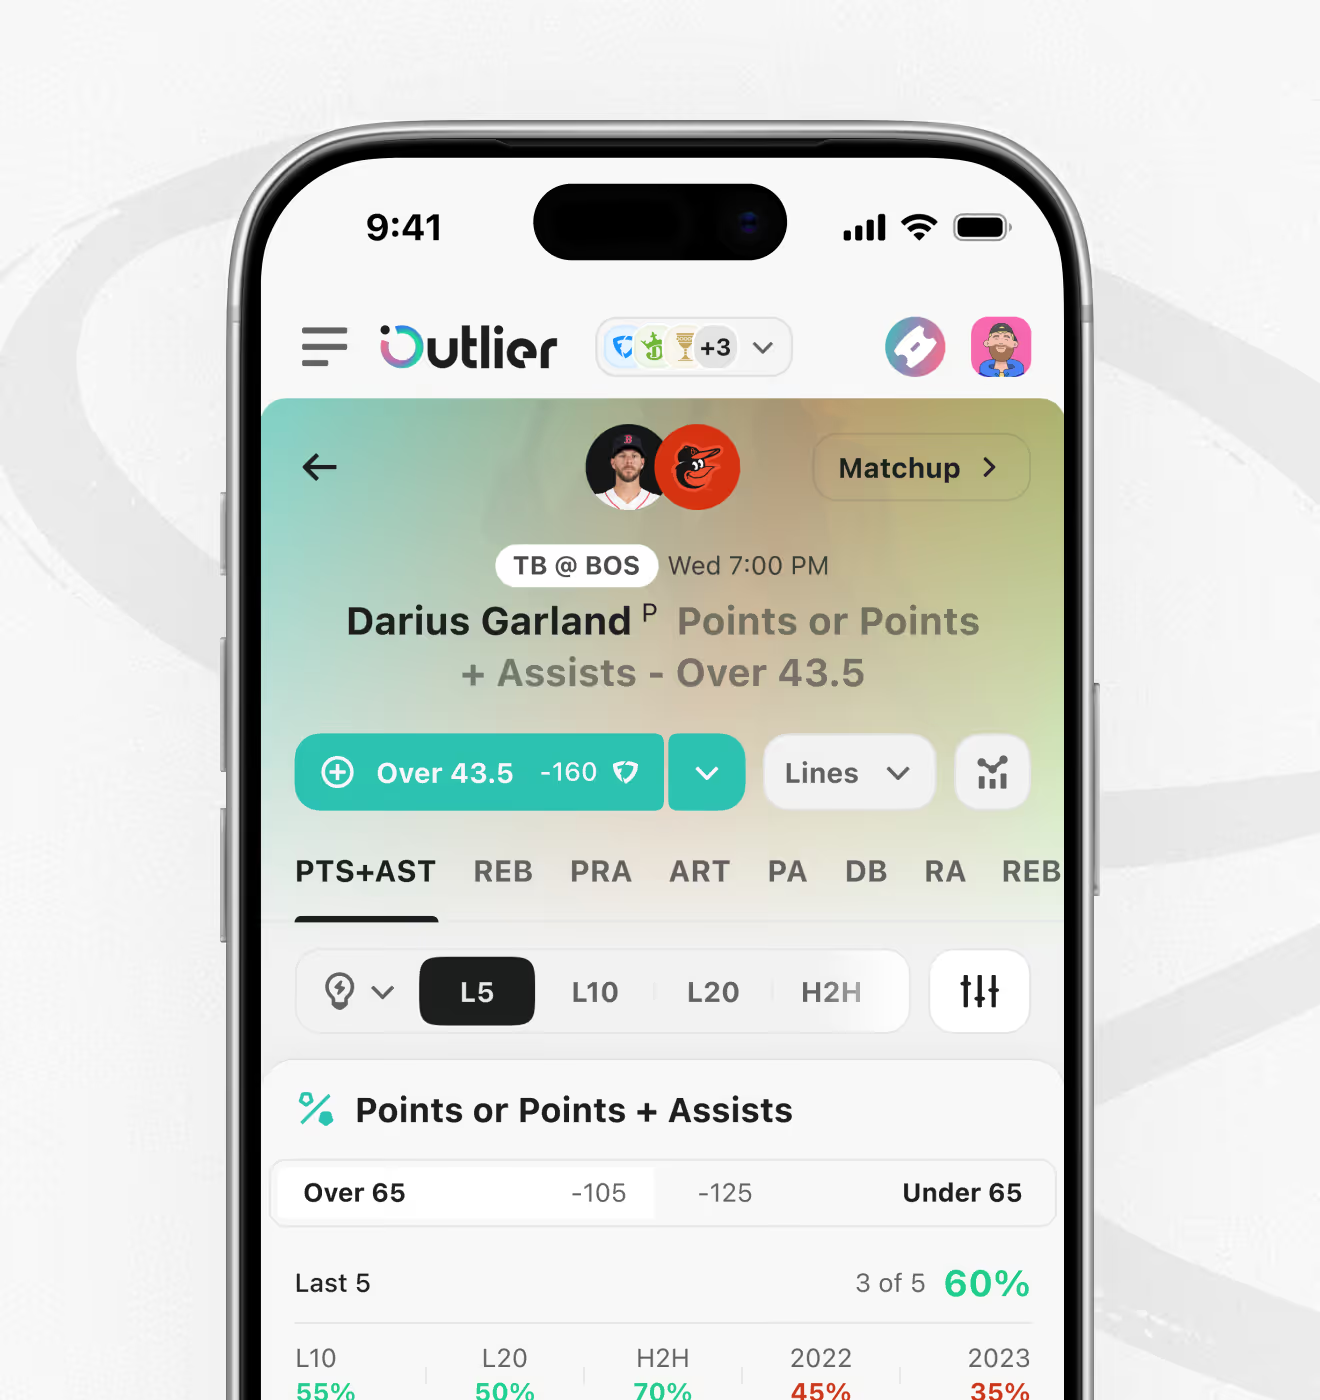
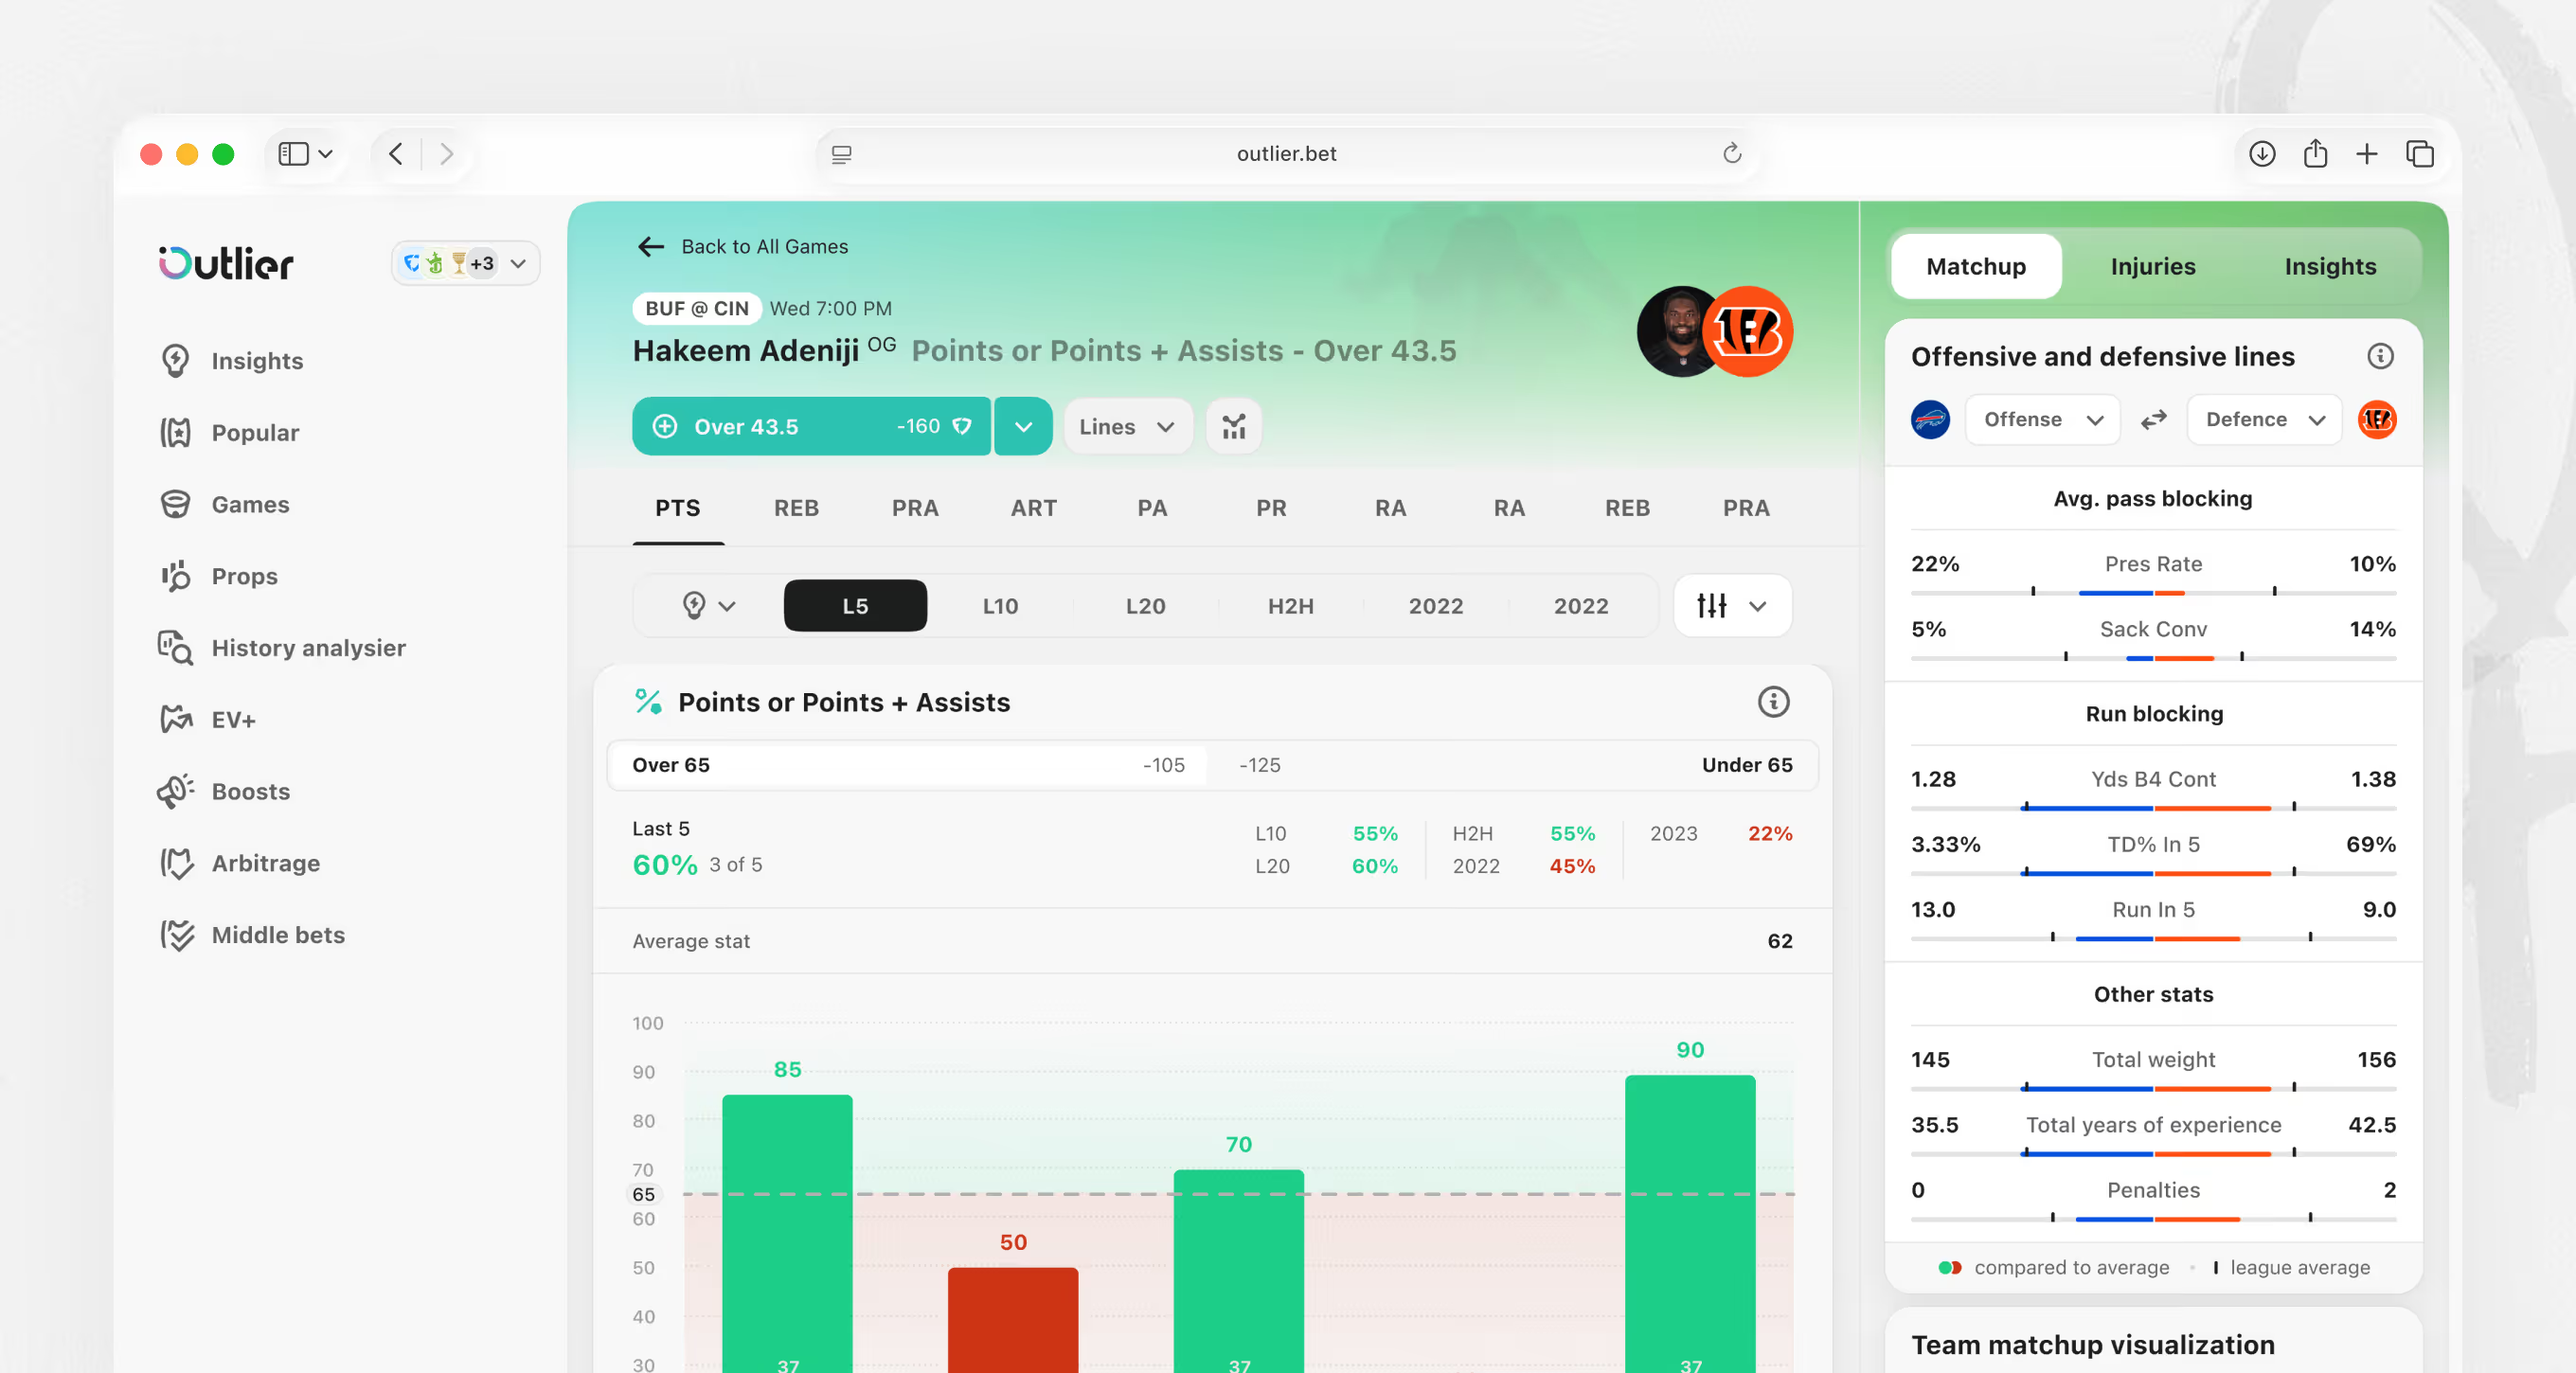
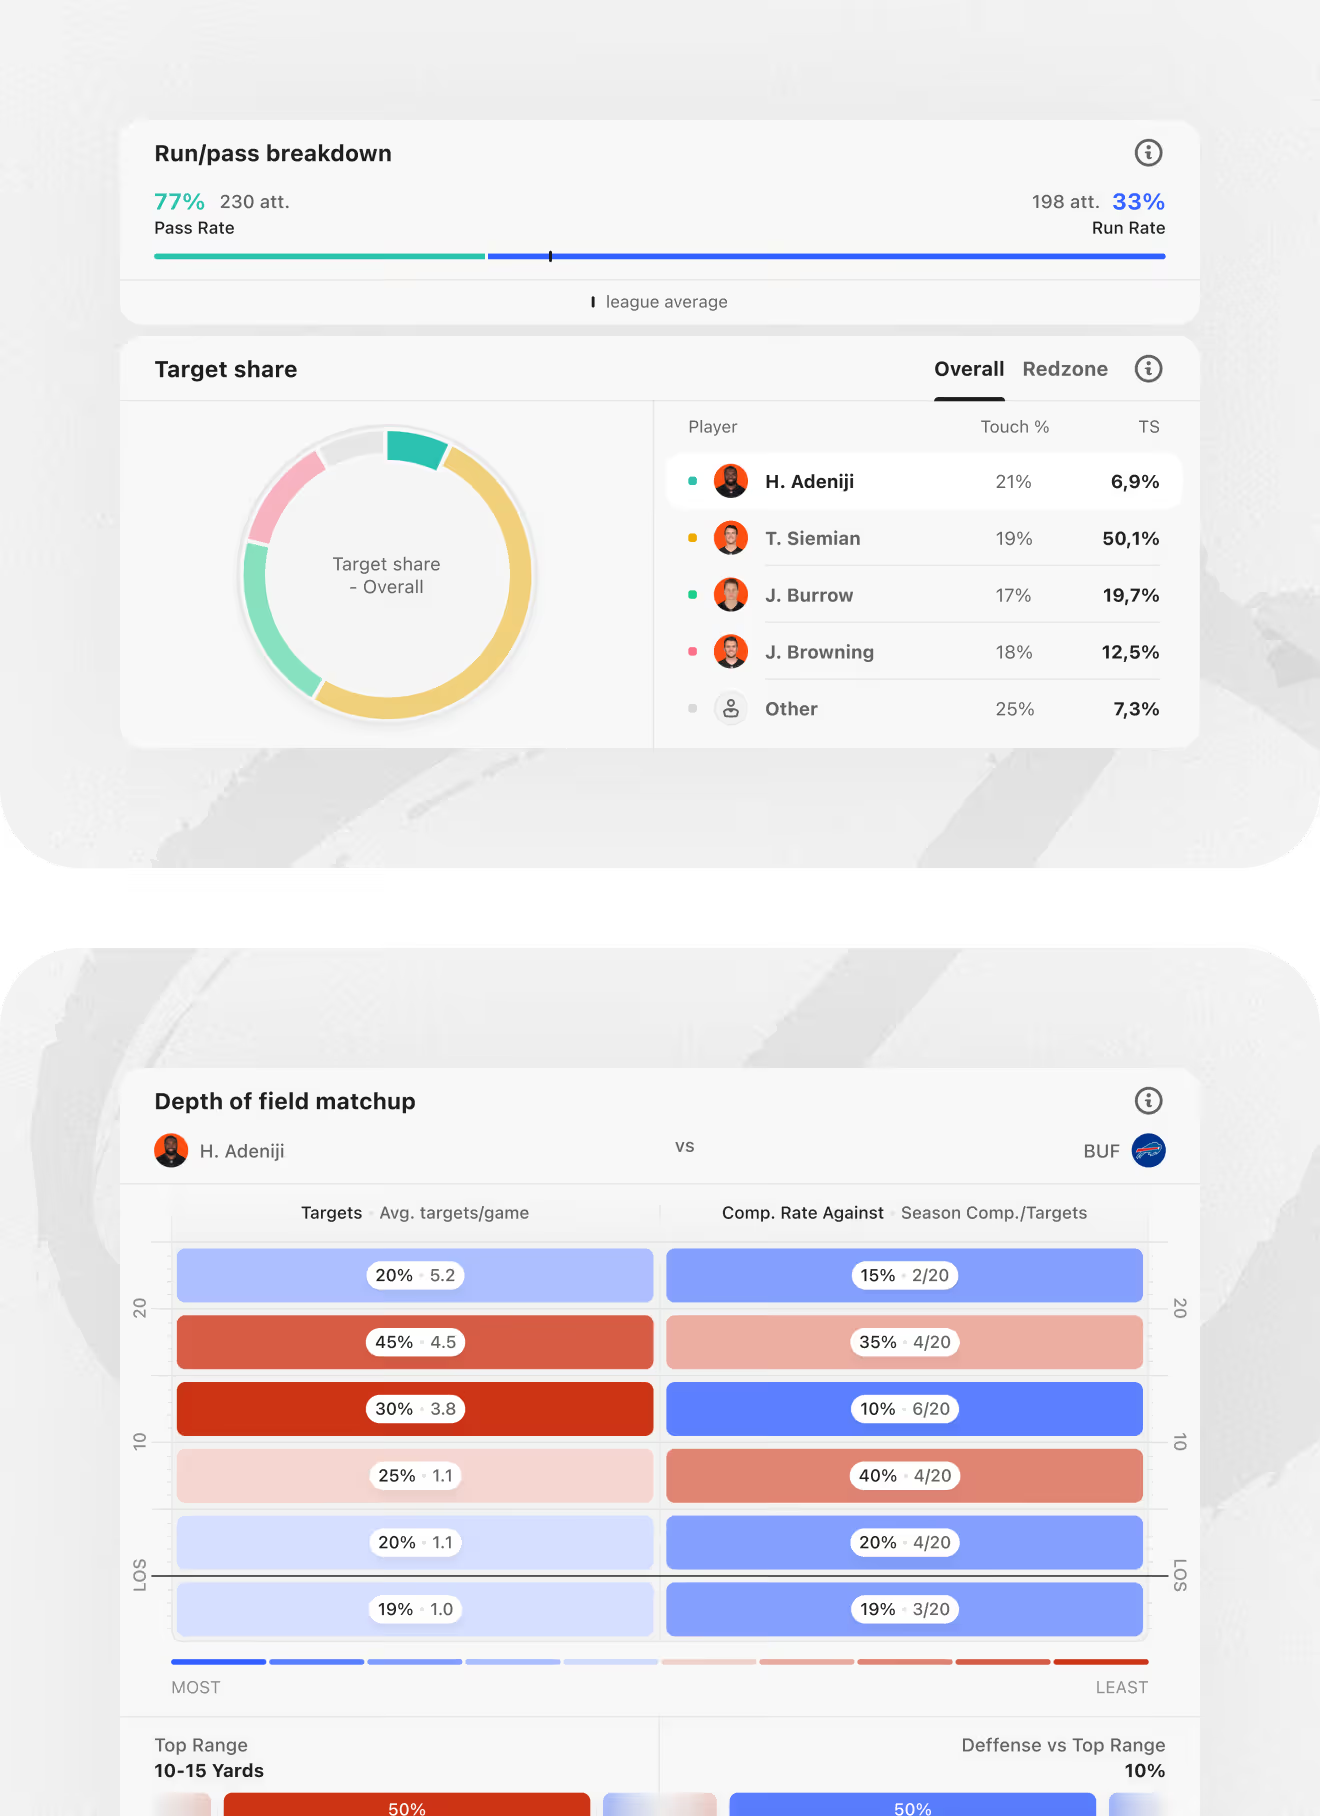
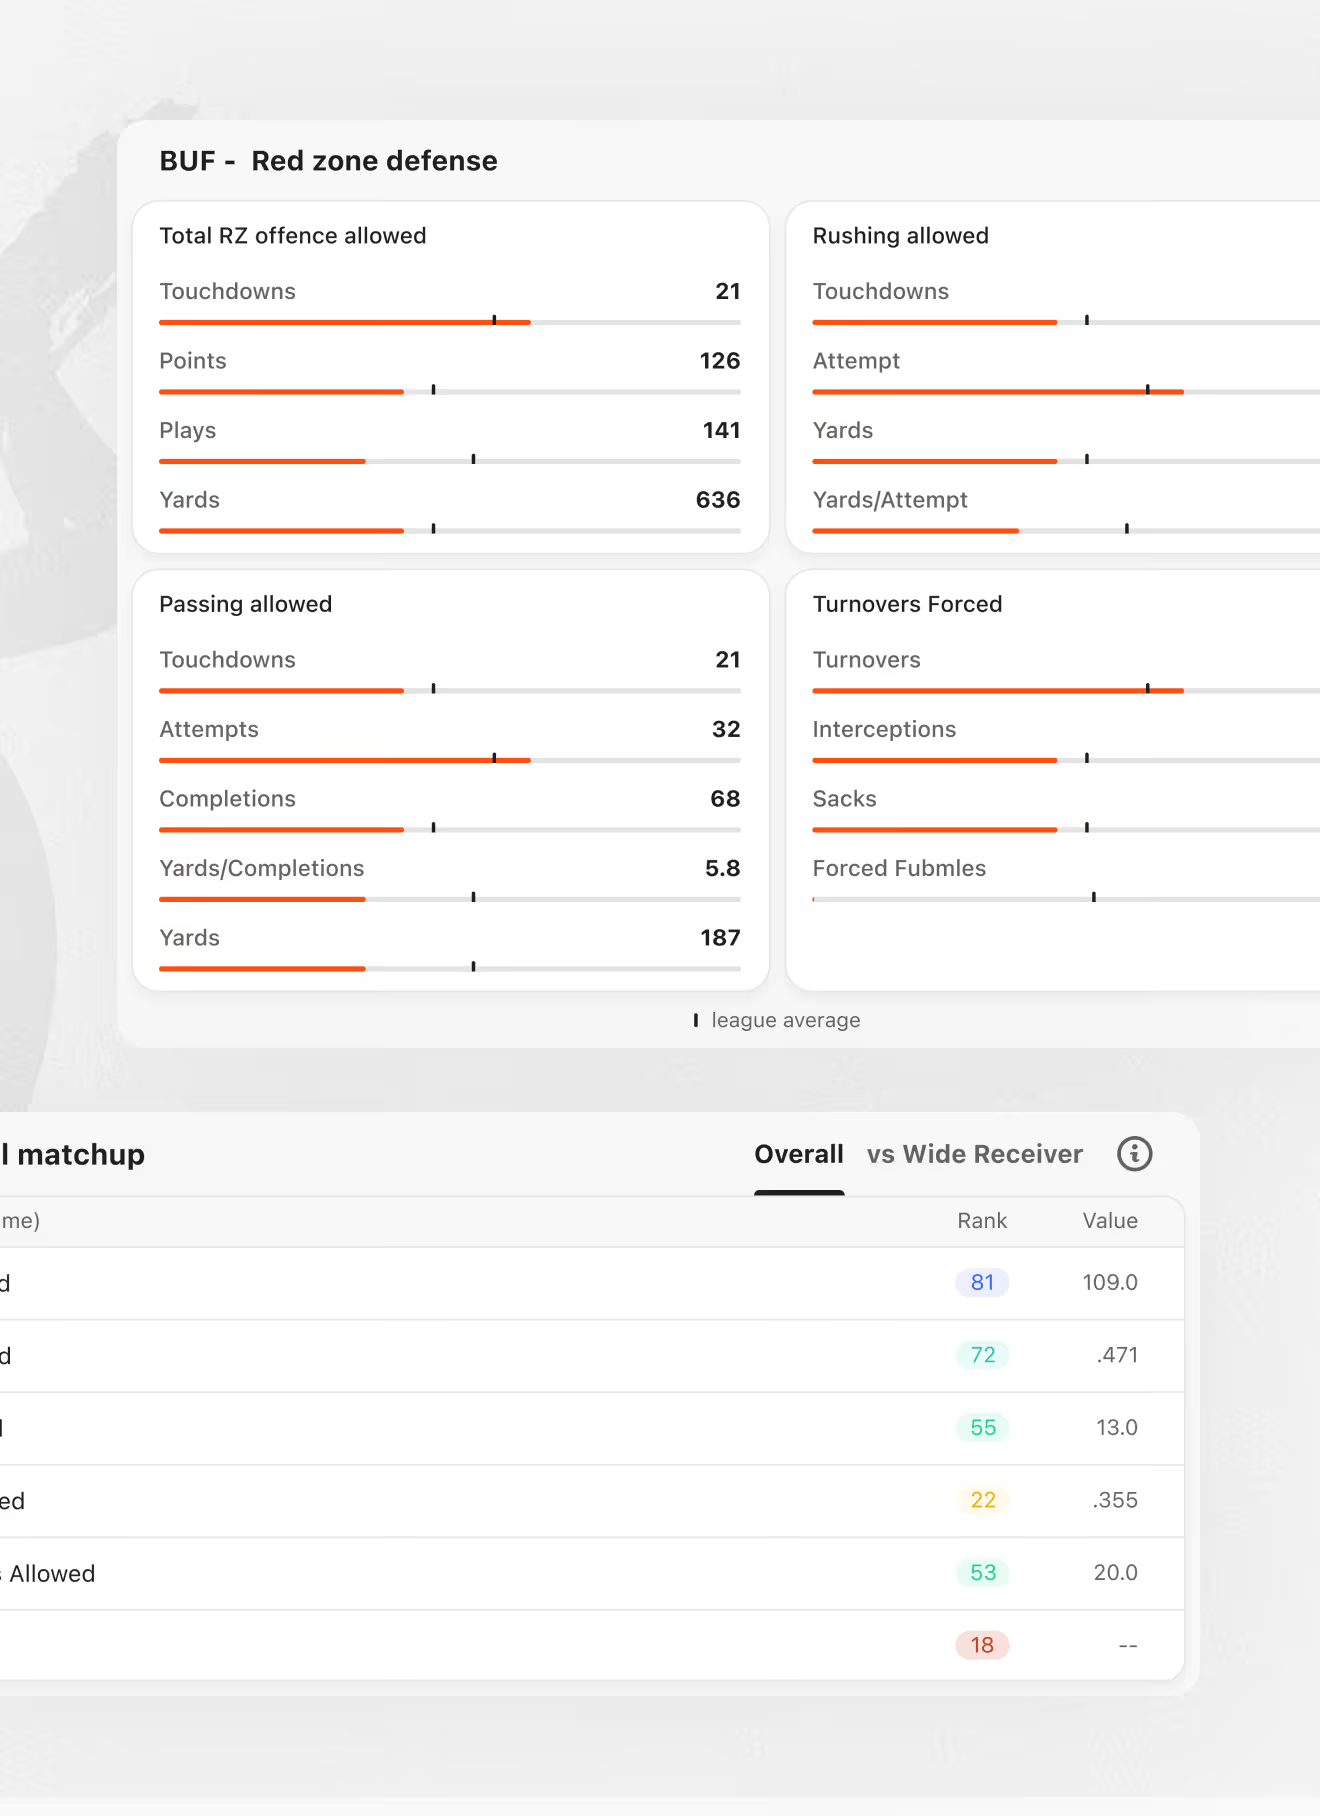
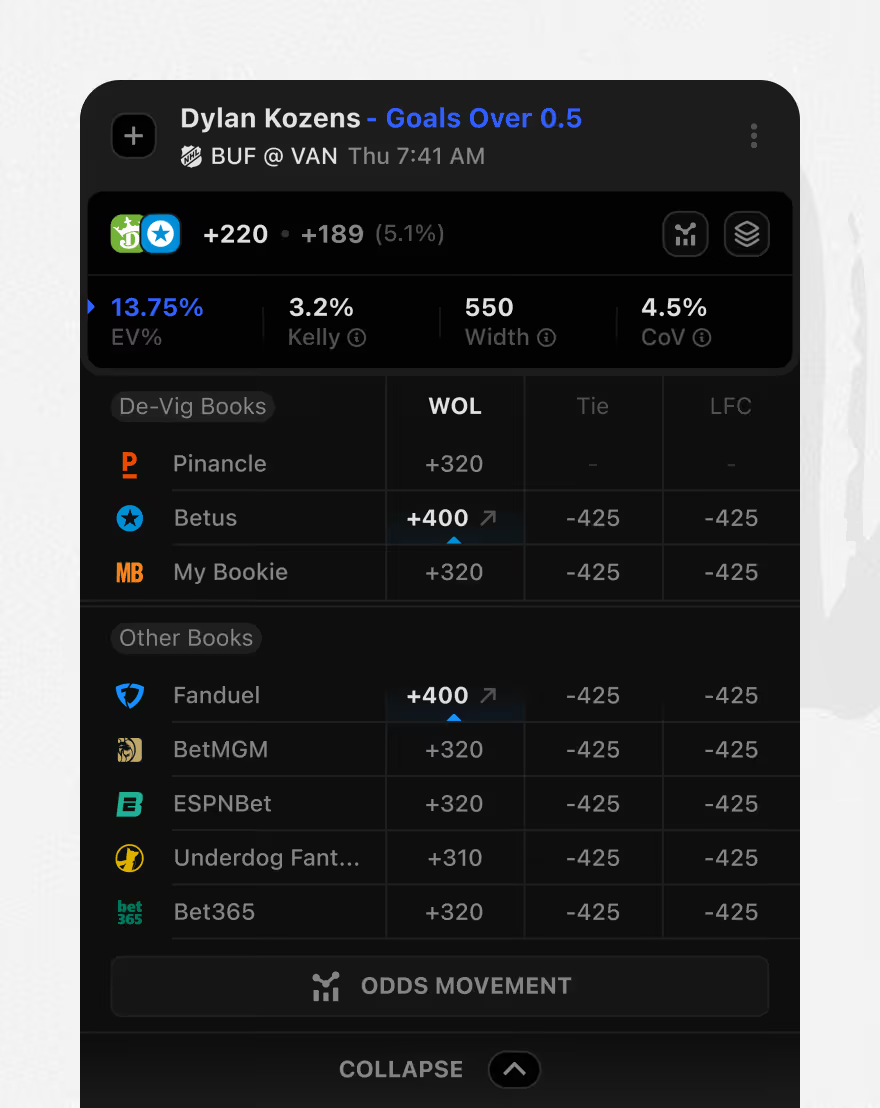
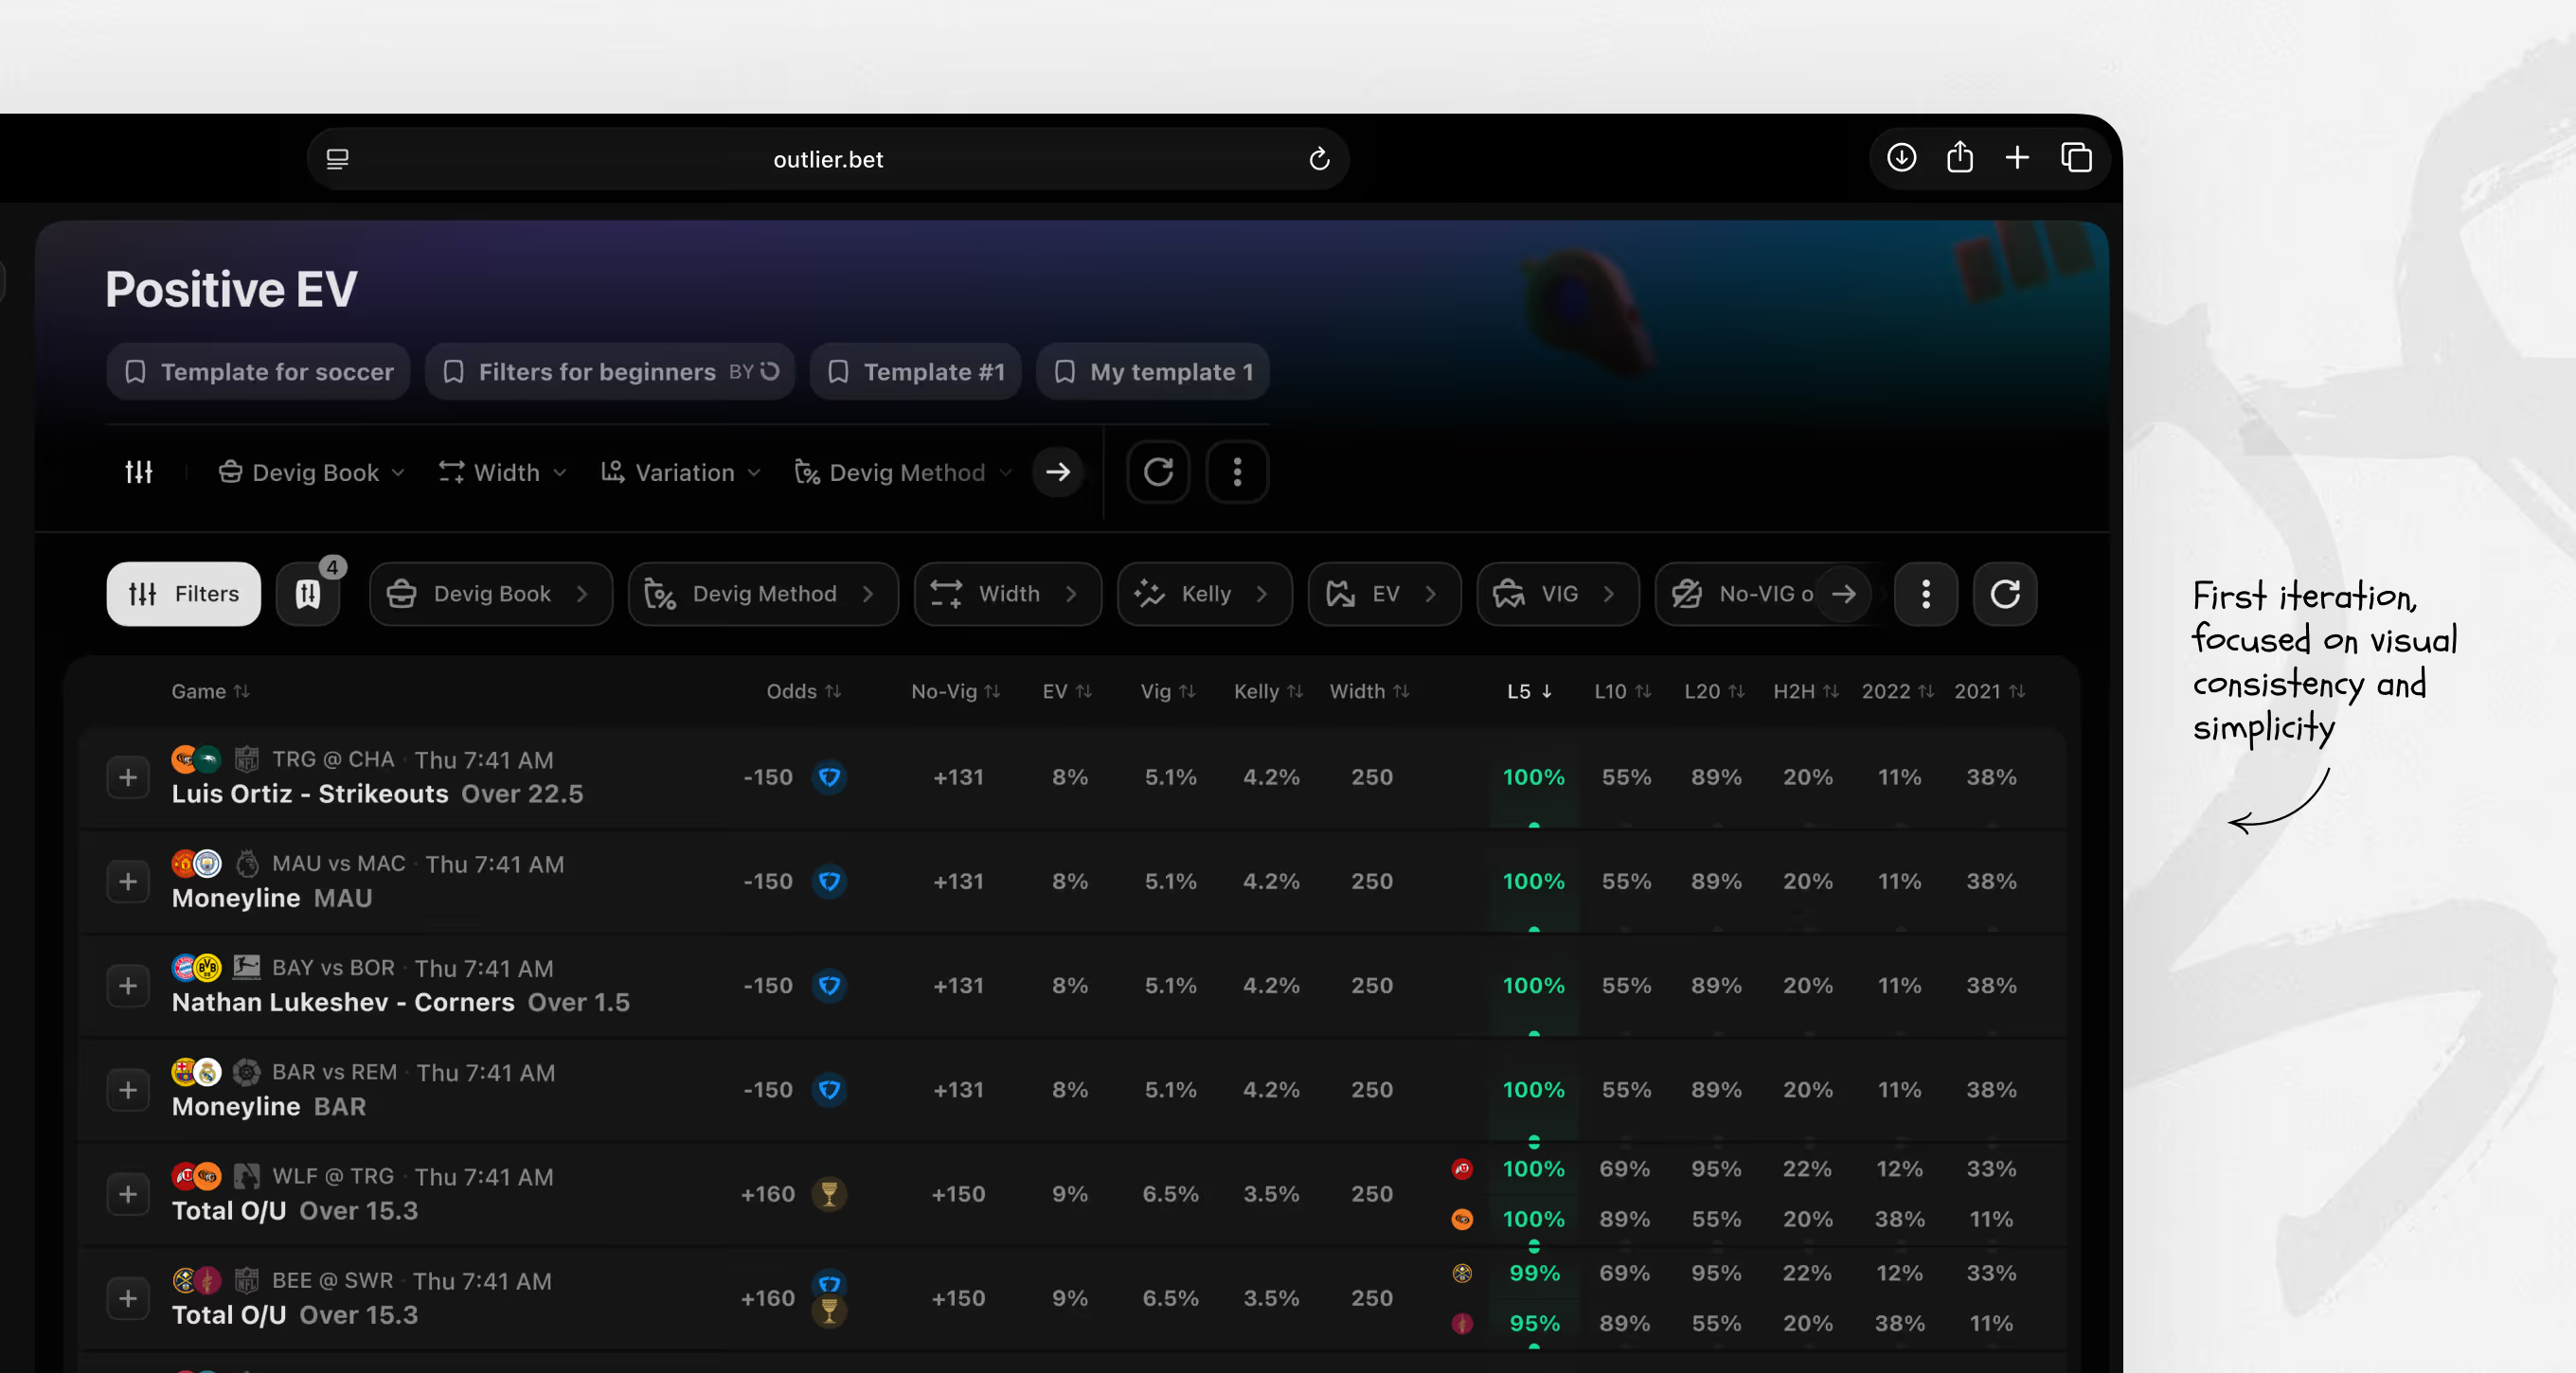
The first version of the Positive EV table, built to help bettors scan for value across sportsbooks. Columns cover odds, no-vig, EV%, vig, Kelly, and width, with saved filter templates for repeat searches.
The full Positive EV table condensed into cards for mobile, without cutting any of the desktop data. Each card holds EV%, Vig%, Kelly%, no-vig odds, and width, with extra rows for specific markets.
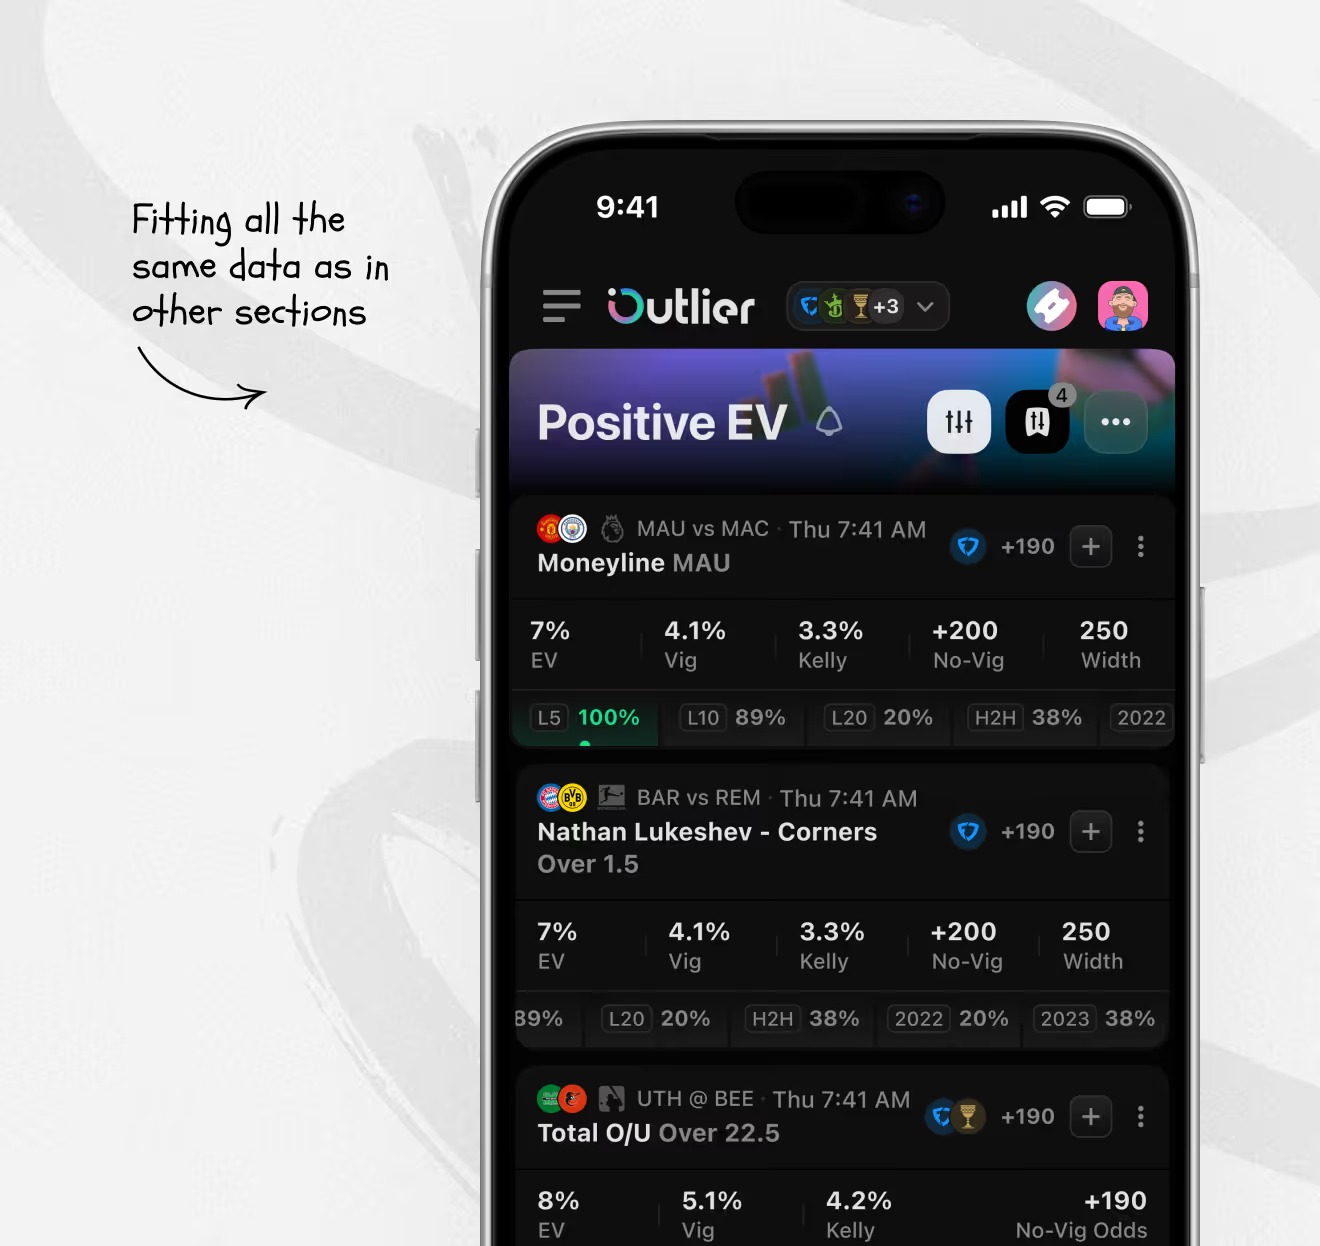
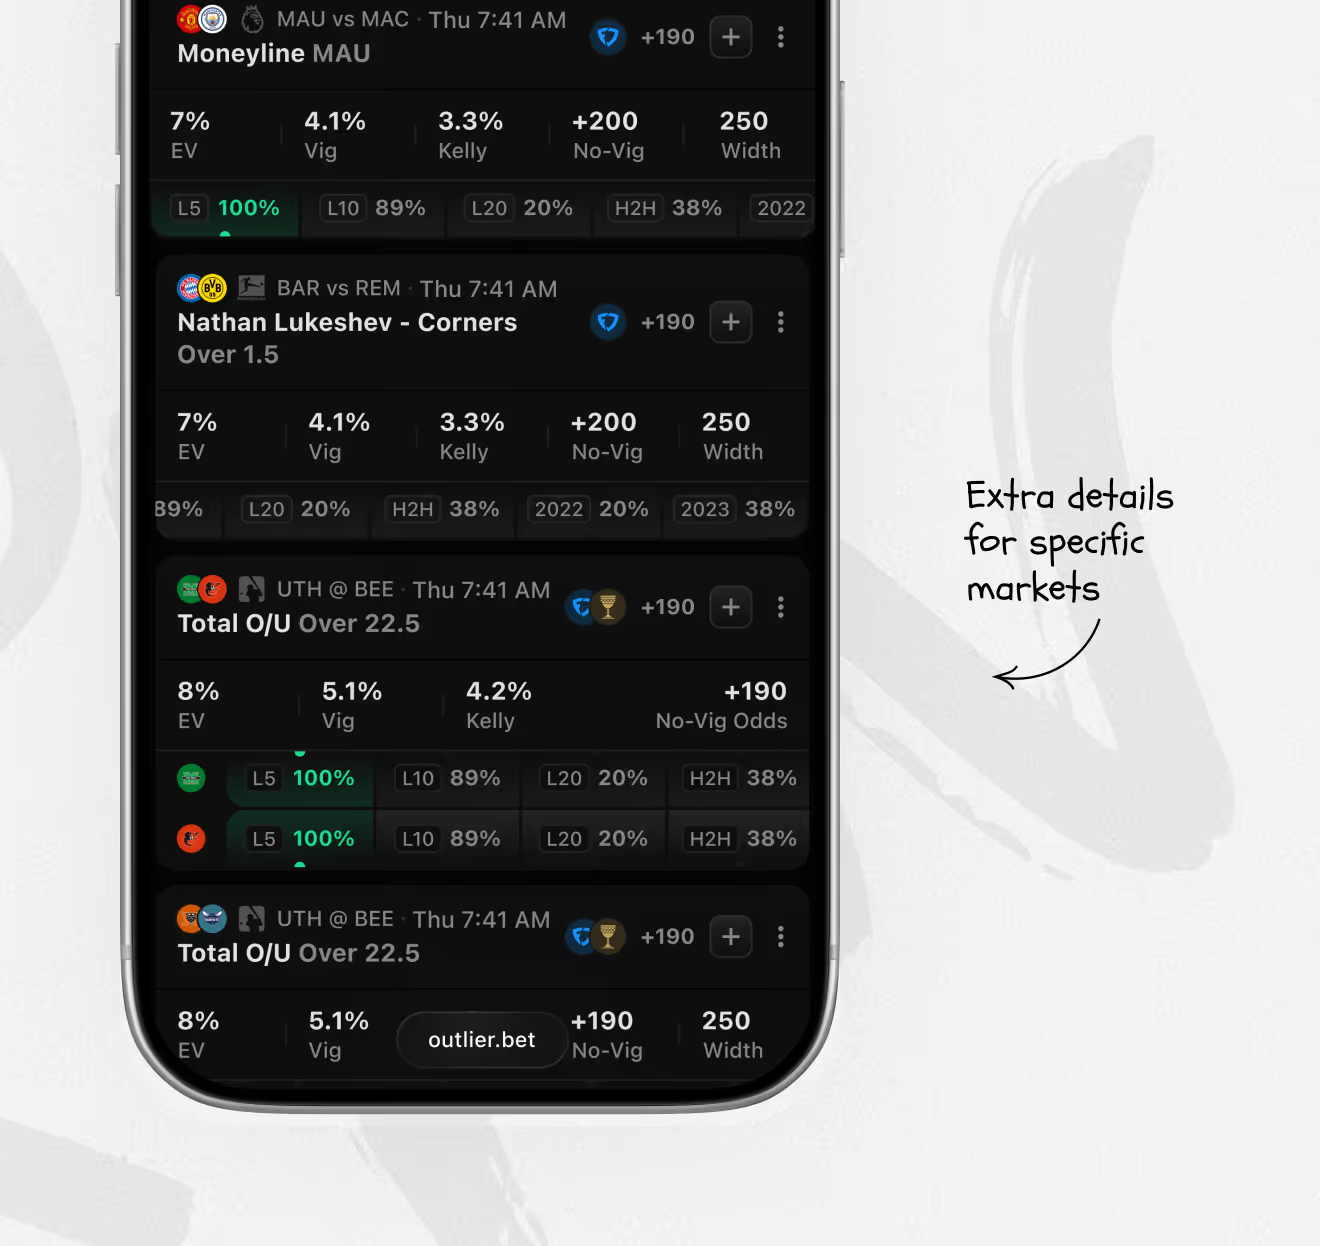
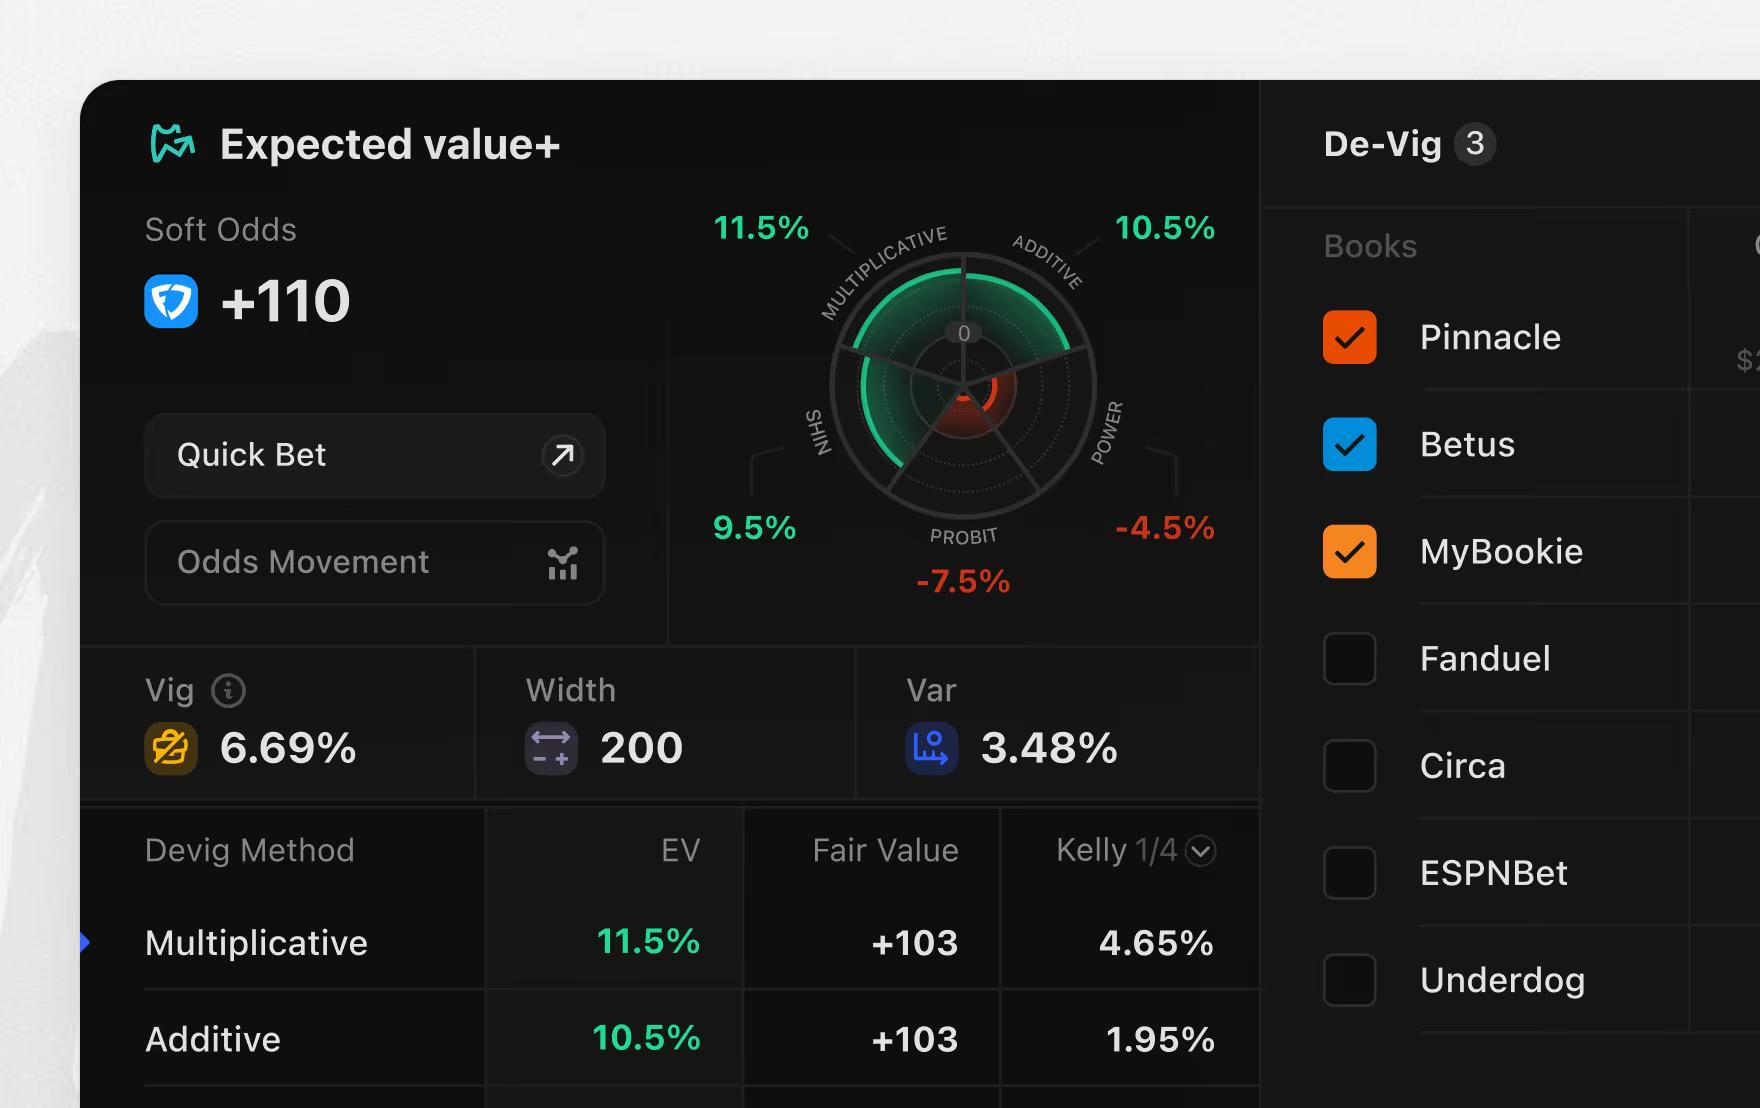
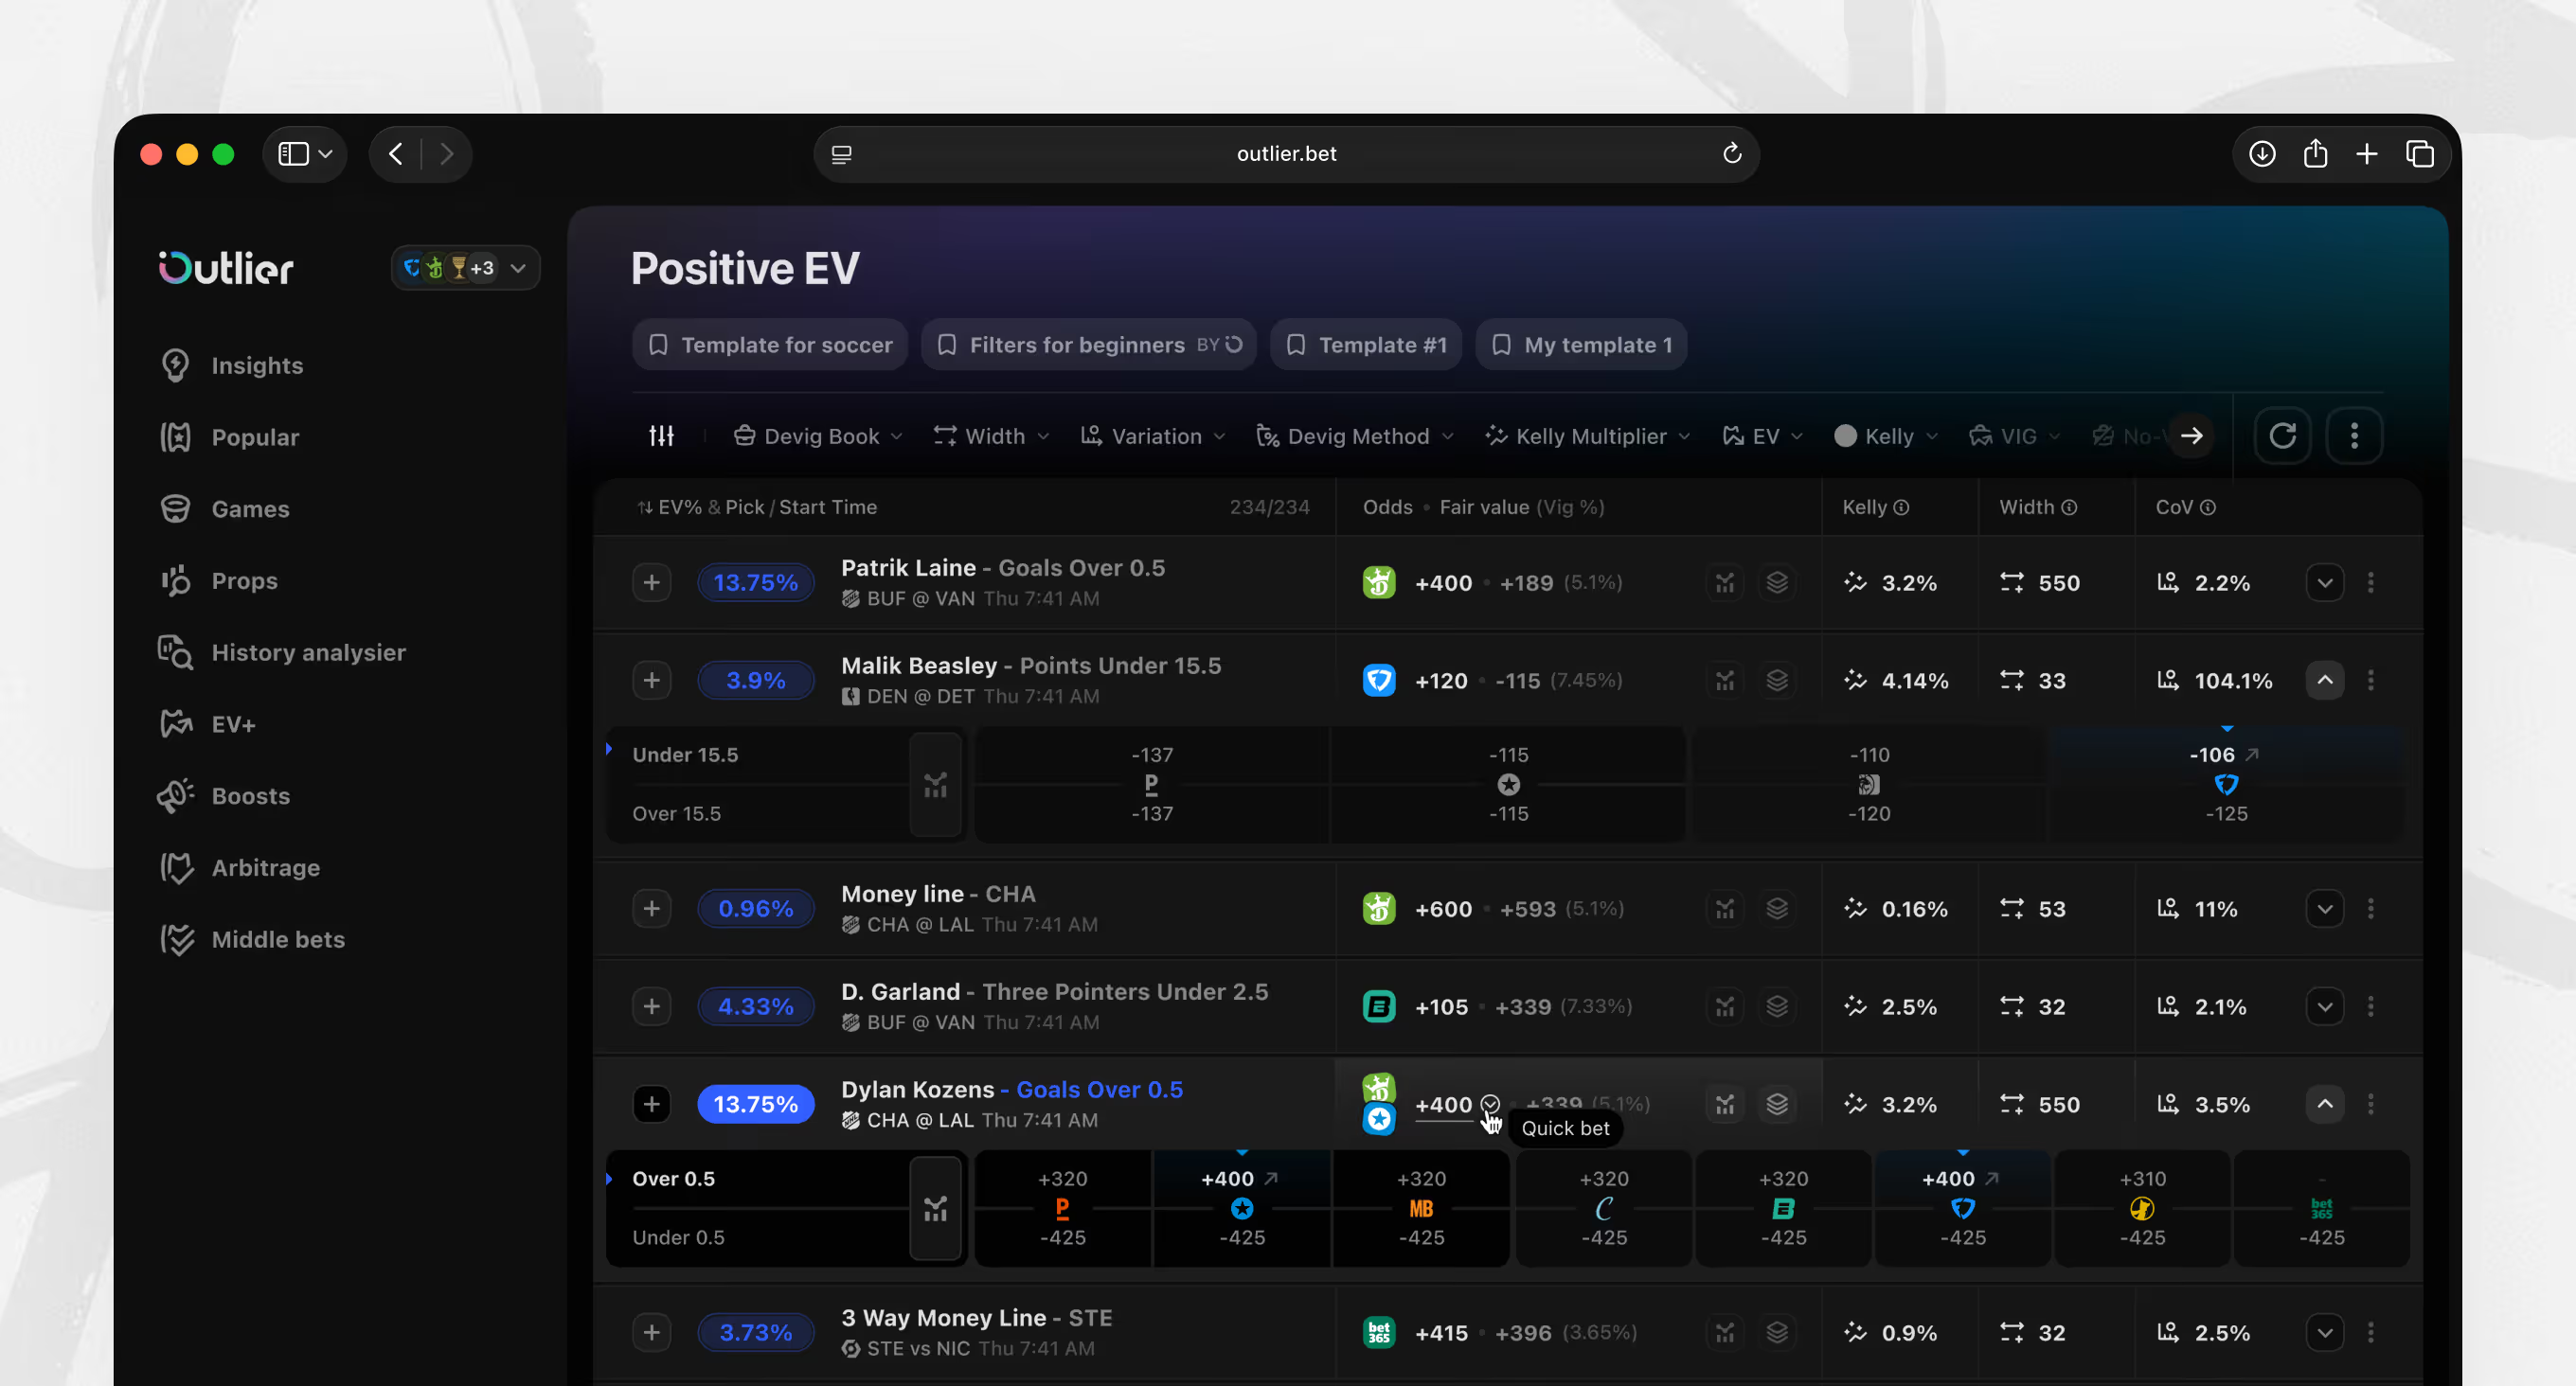
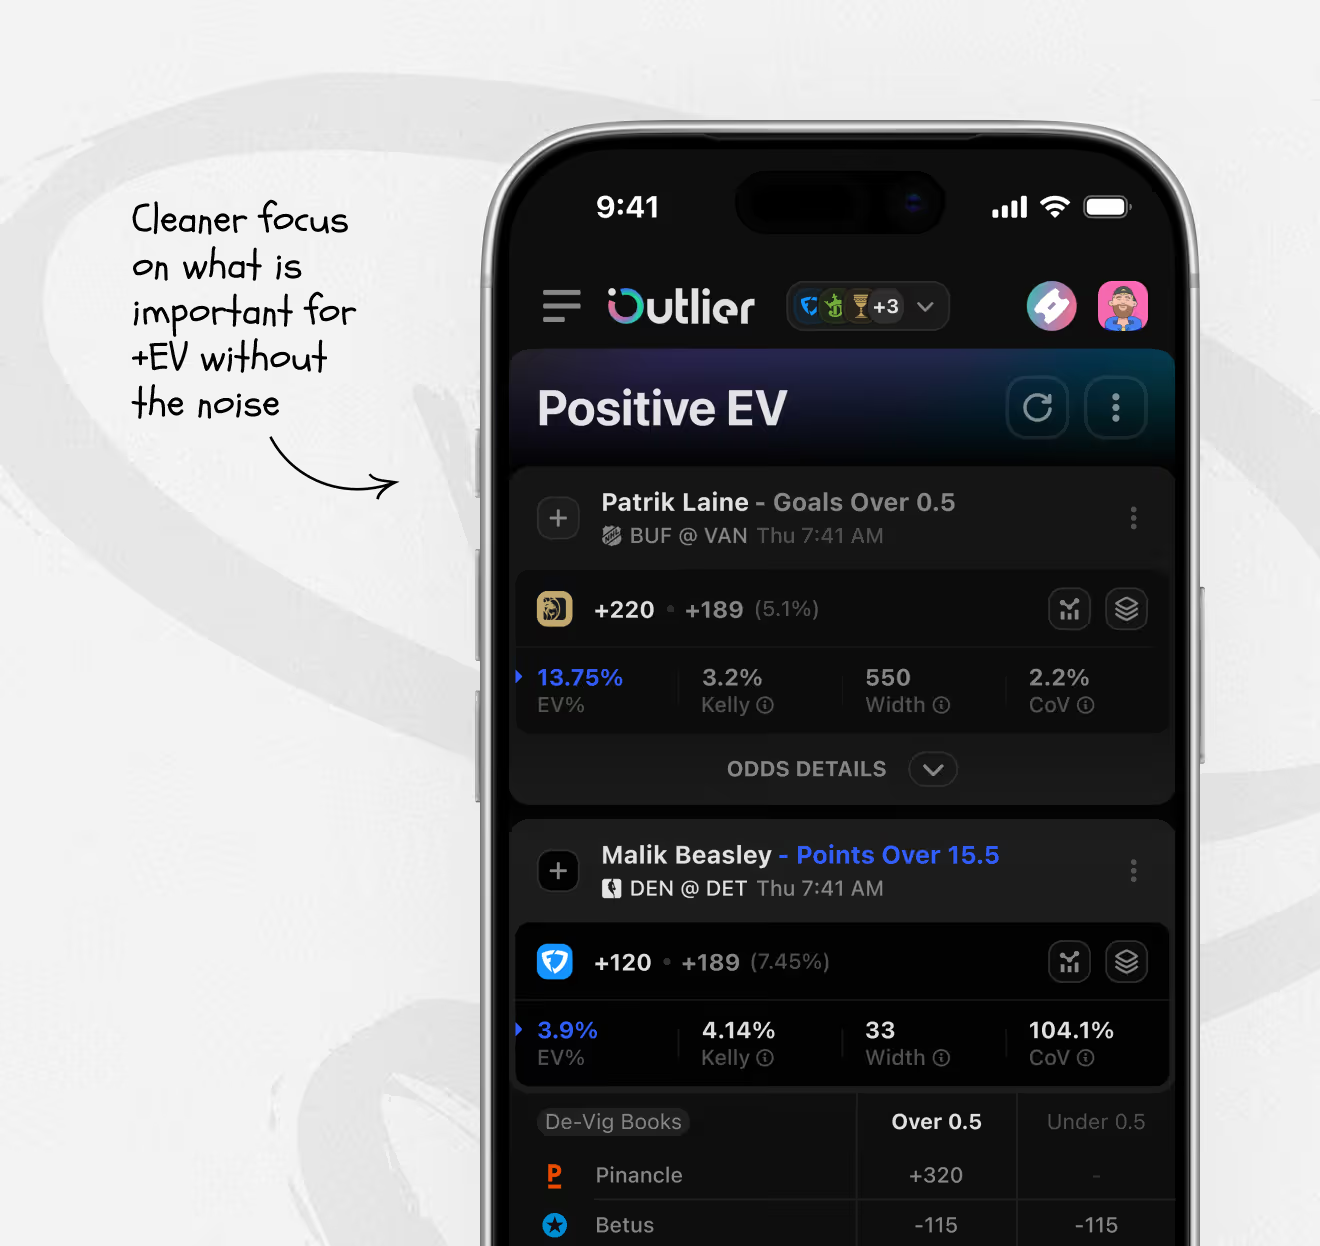
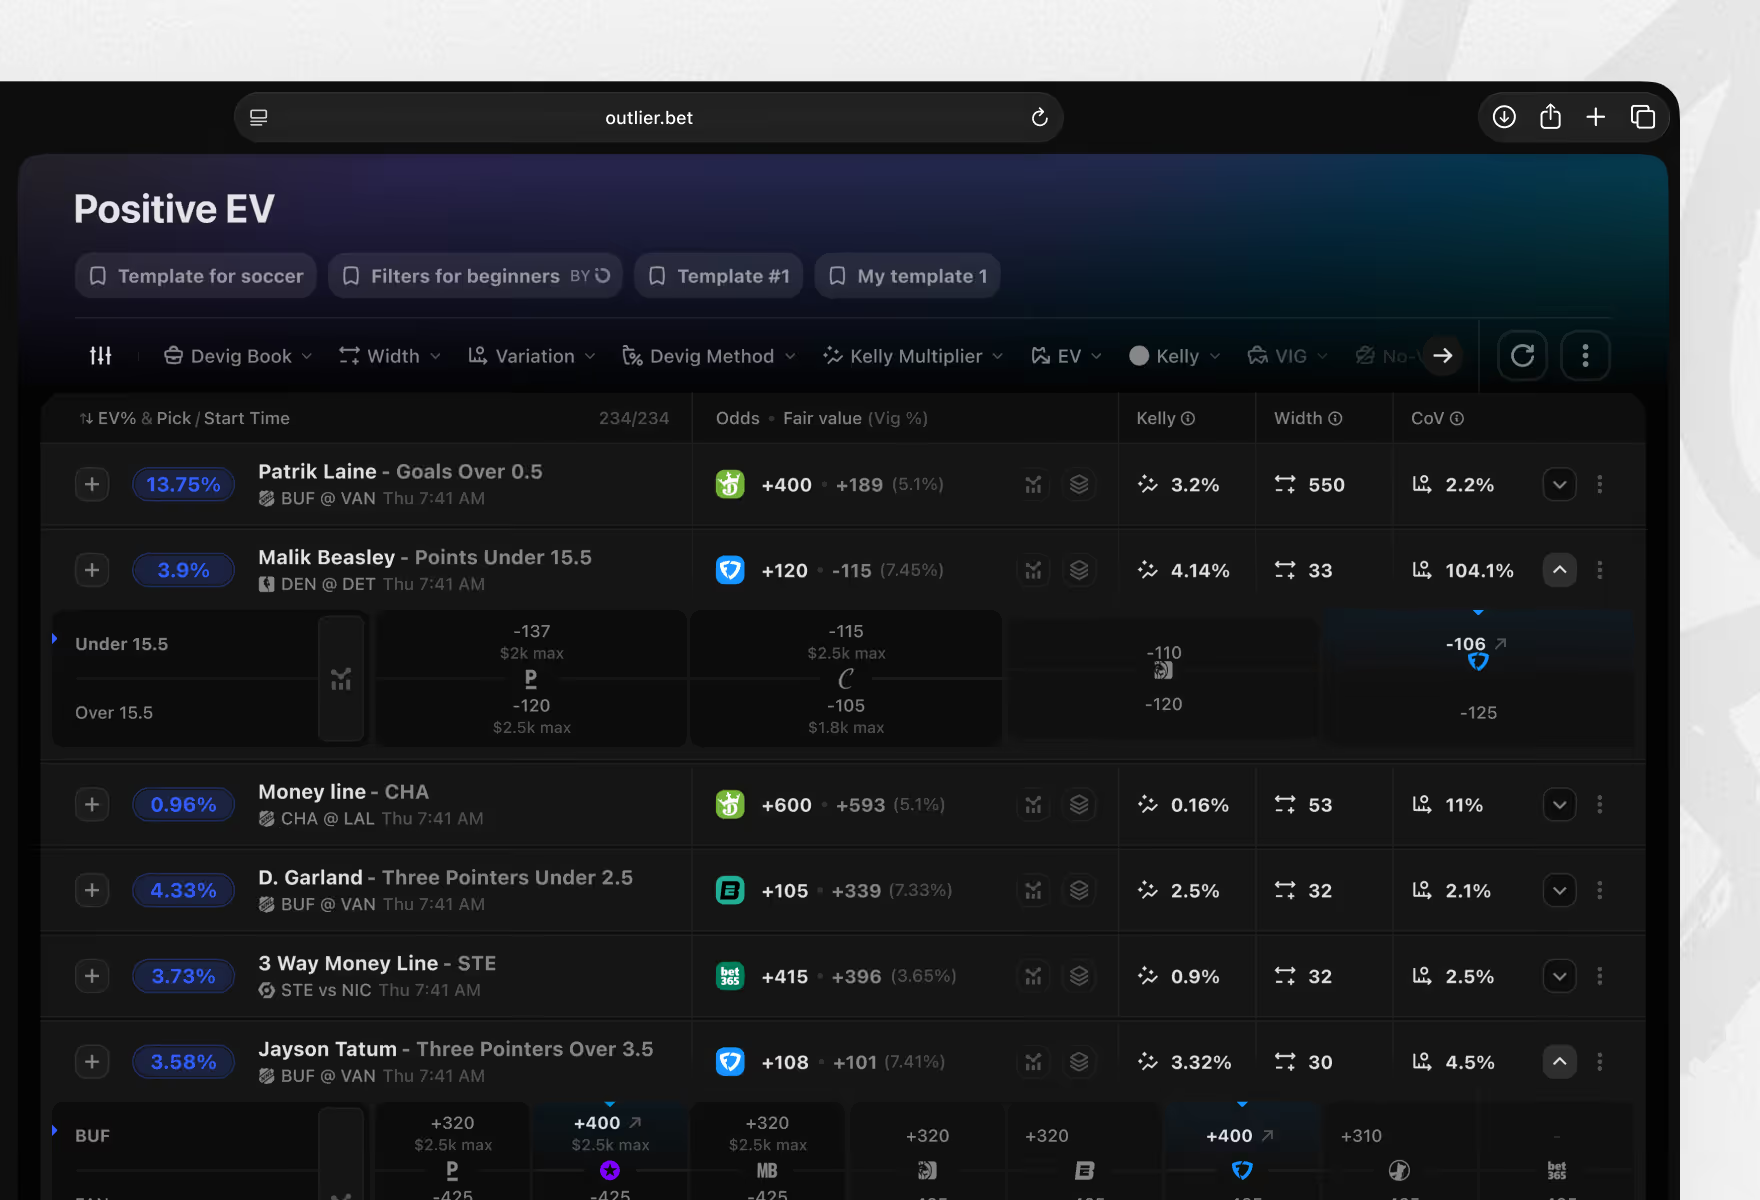
A refined version of the Positive EV table, shipped as part of ongoing Post-MVP Evolution work after the first release. Kelly Multiplier and EV/Vig controls sit above the table, with fair value shown next to raw odds.
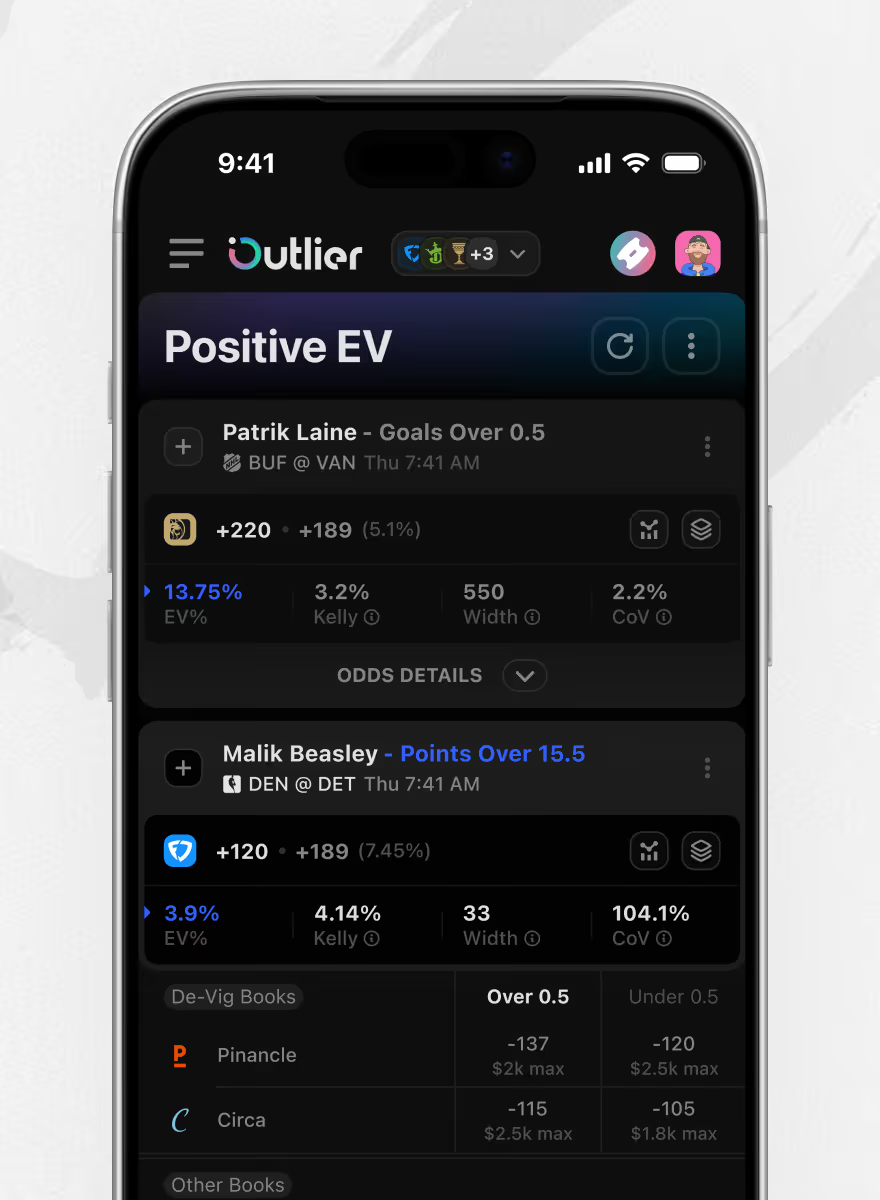
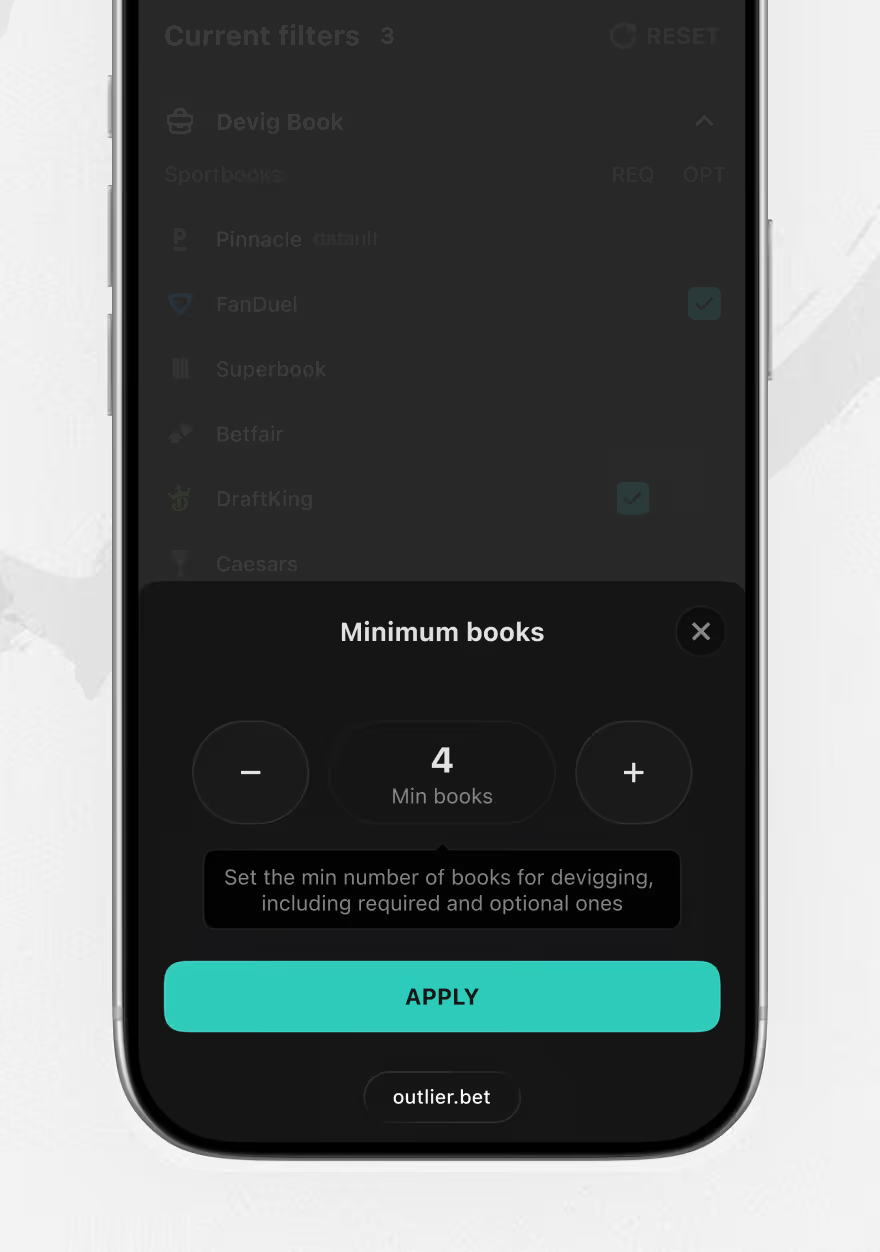
The refined Positive EV table's card view and book filter panel on mobile. Bettors filter by minimum EV%, minimum Kelly%, vig%, bet type, league, and specific books.
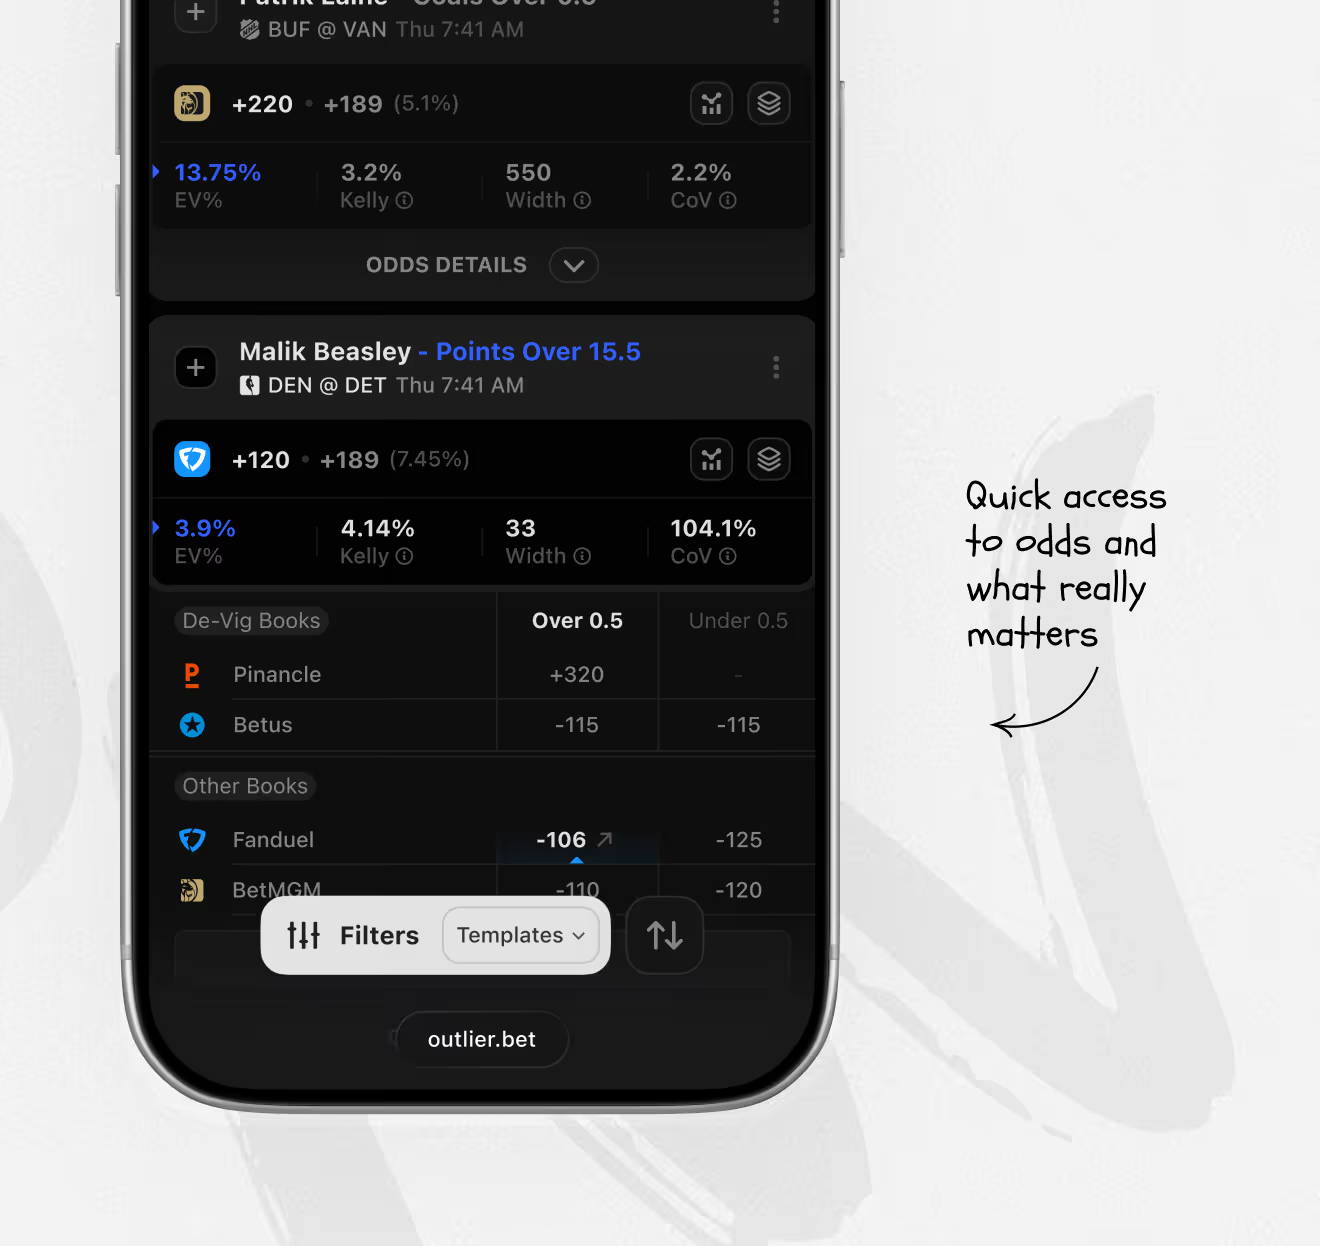
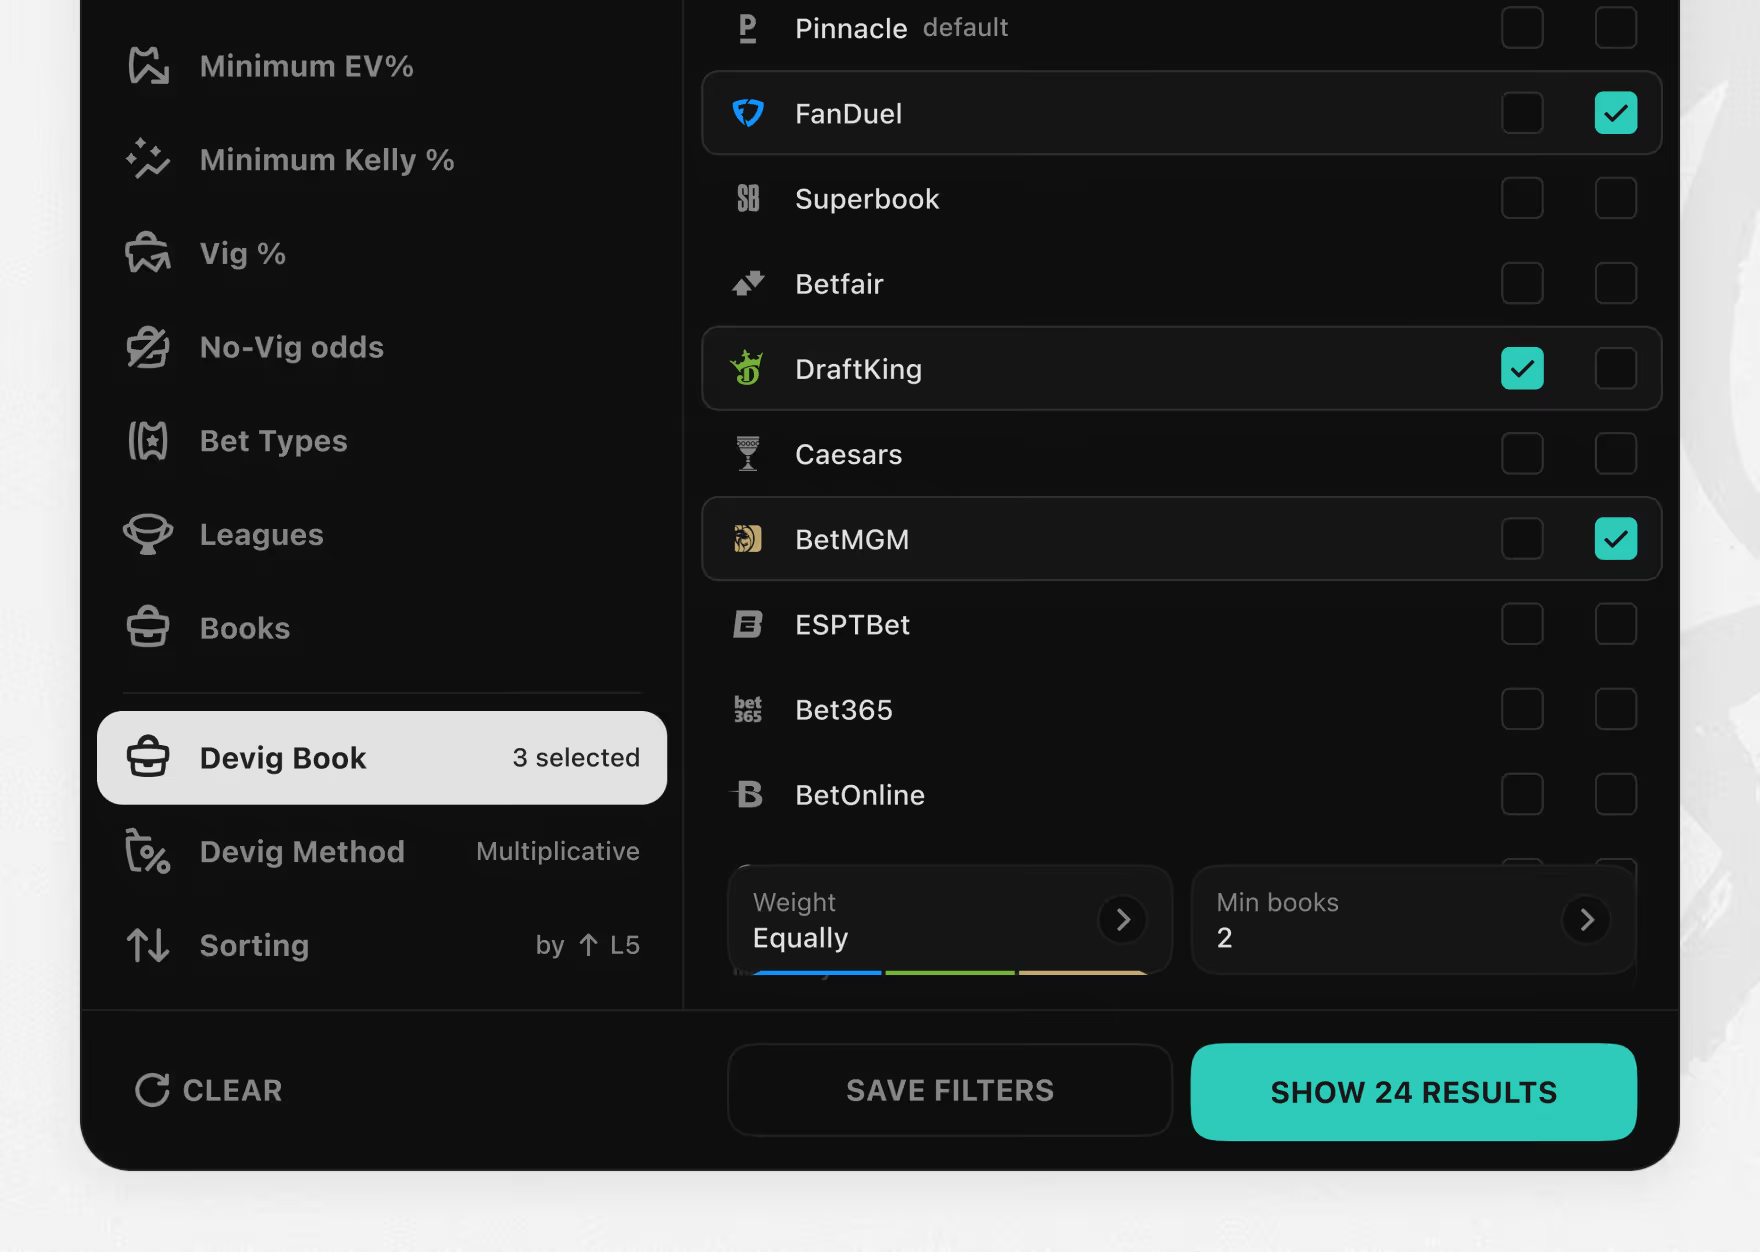
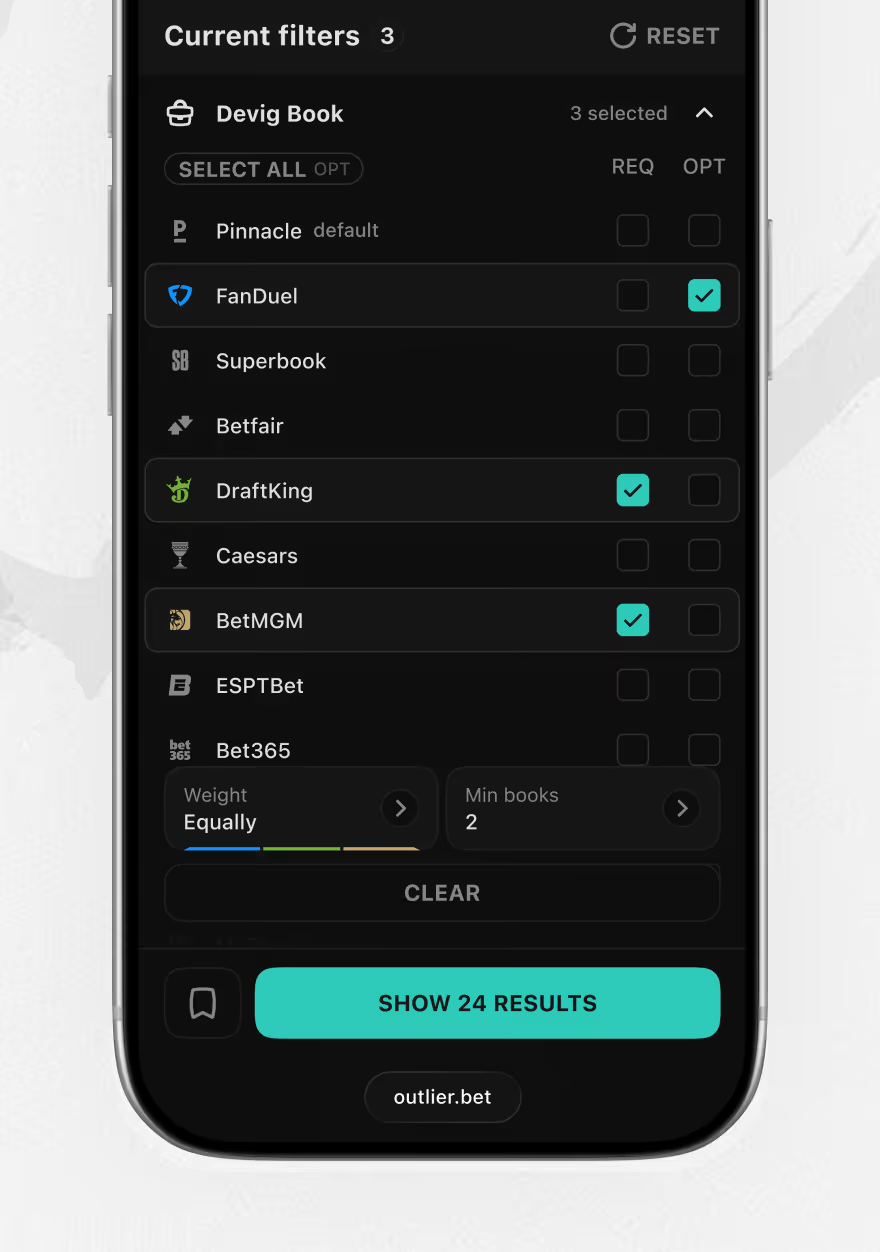
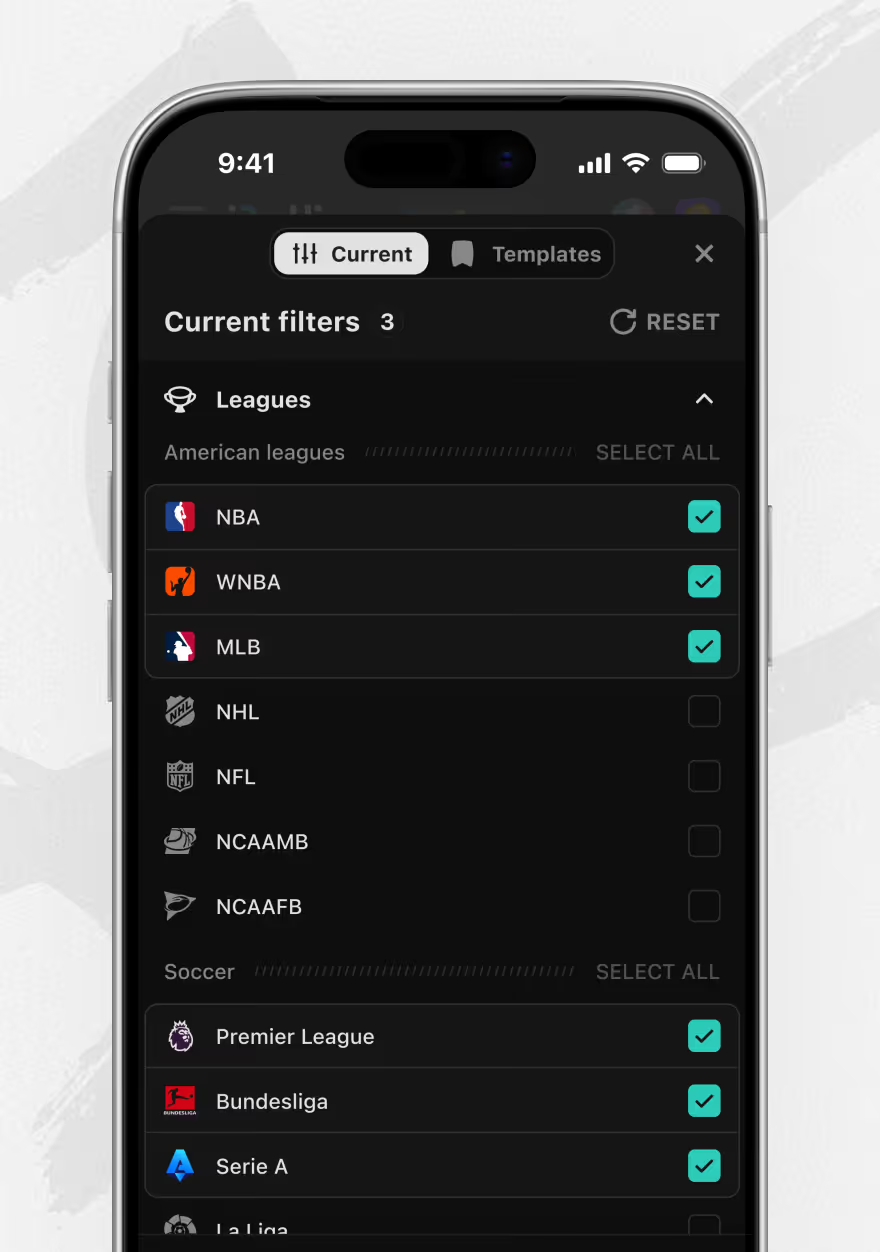
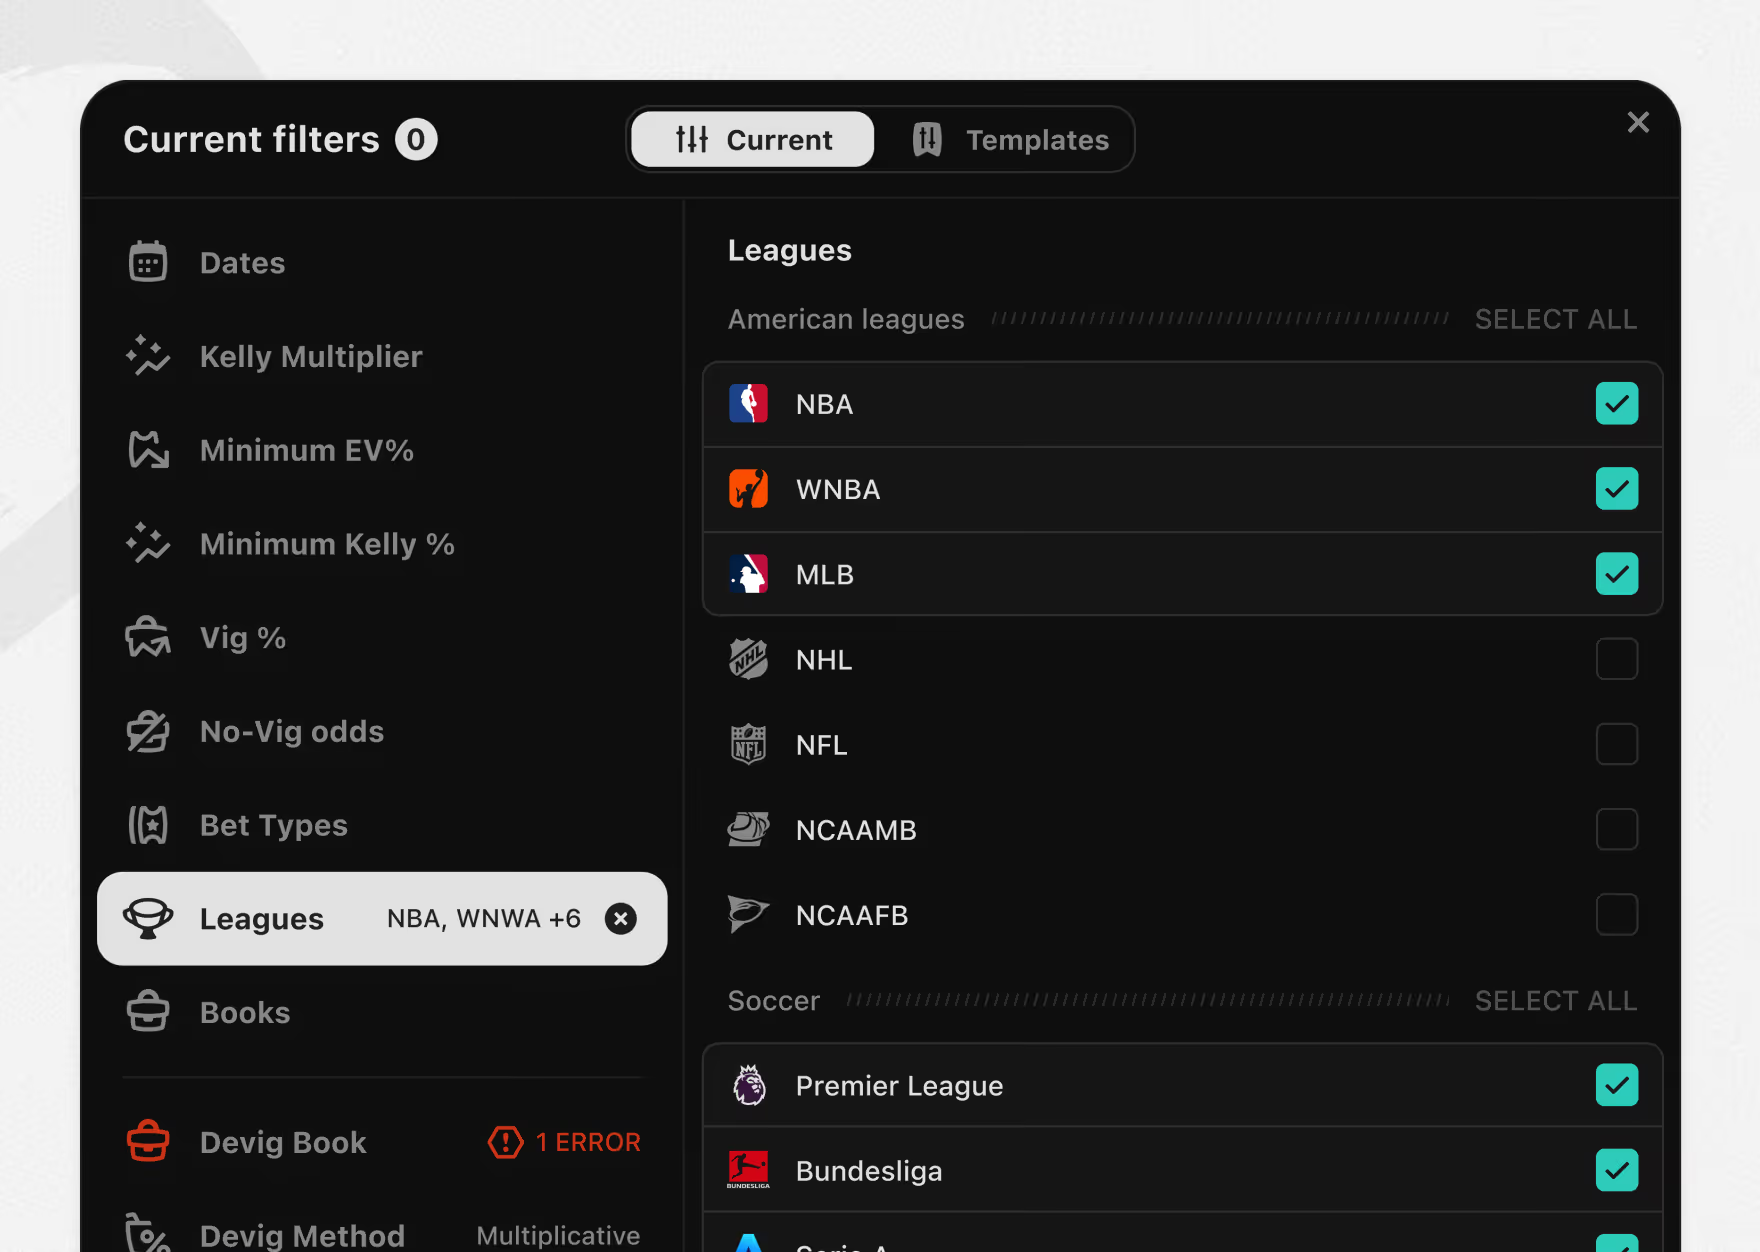
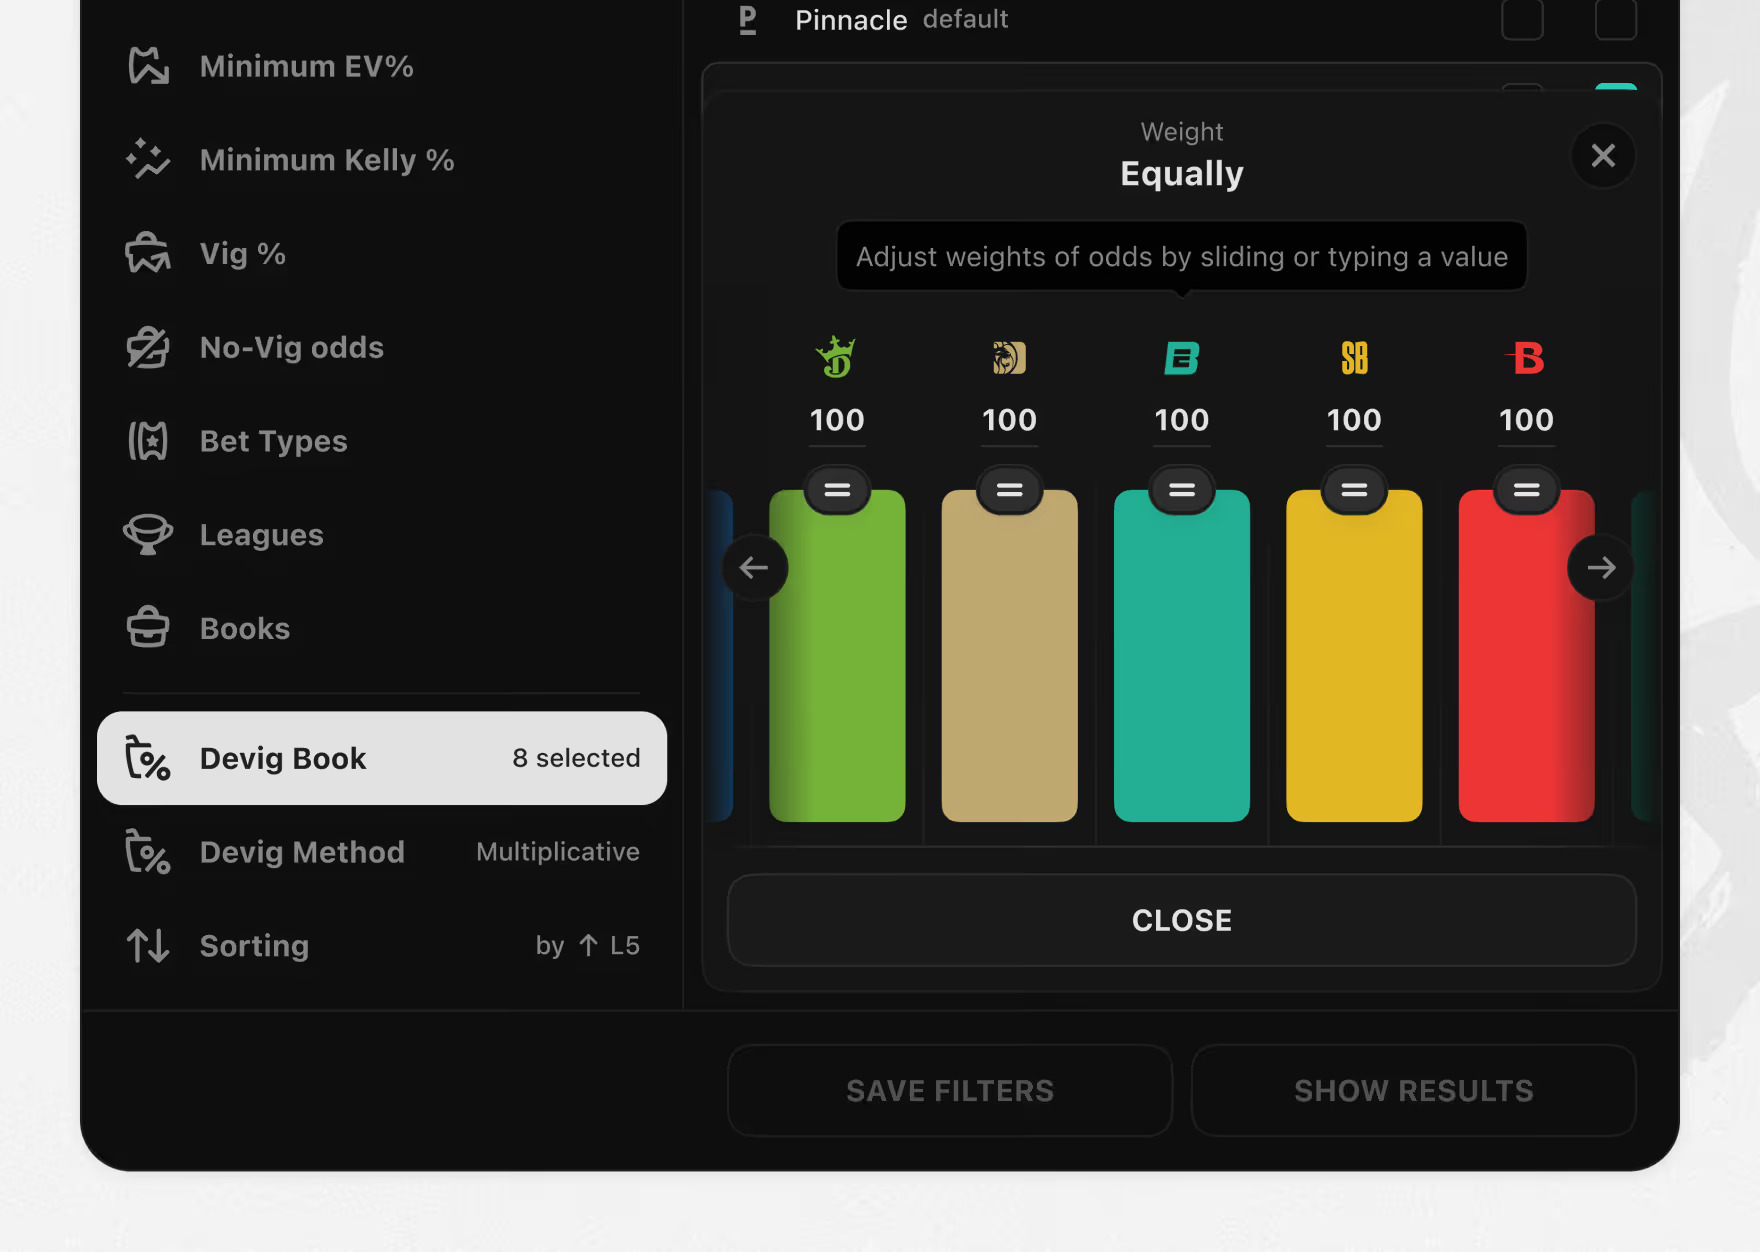
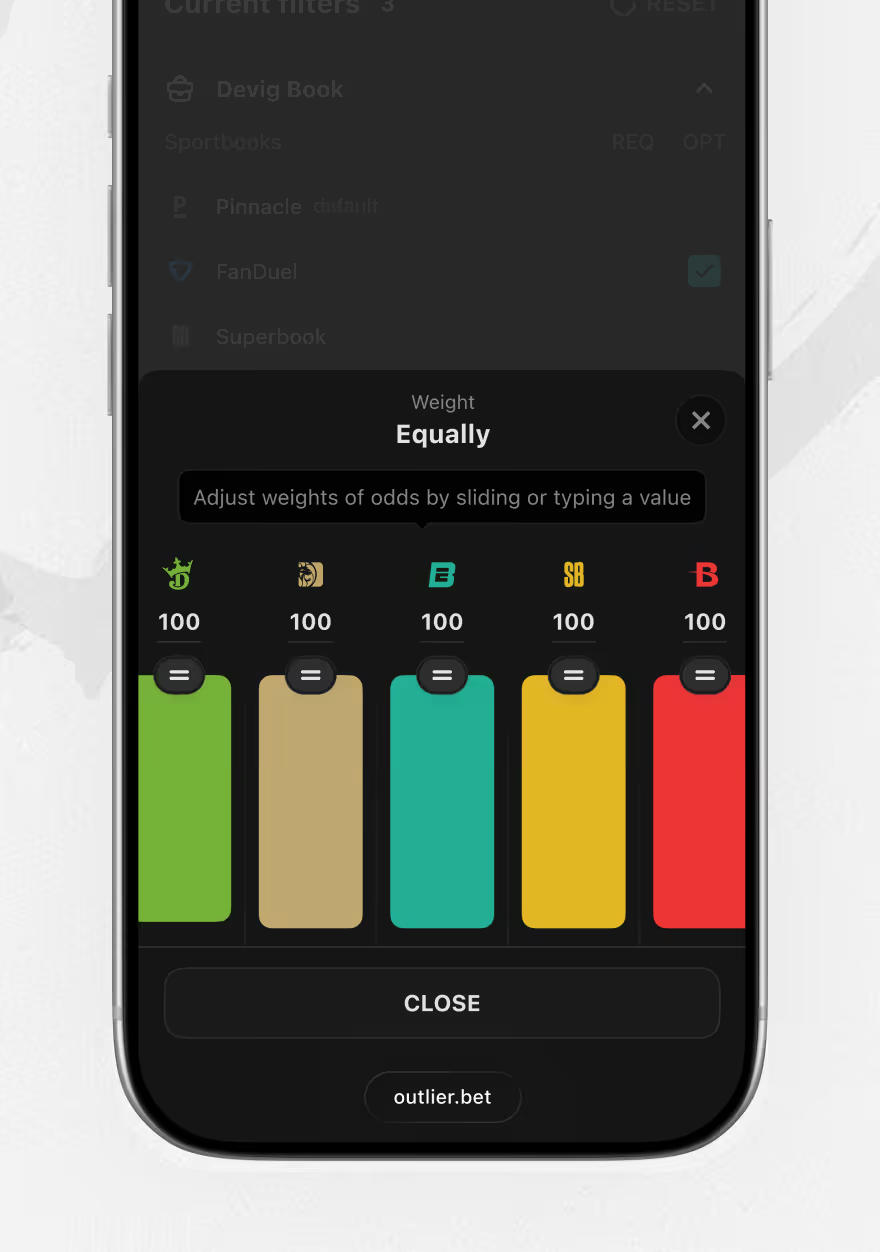
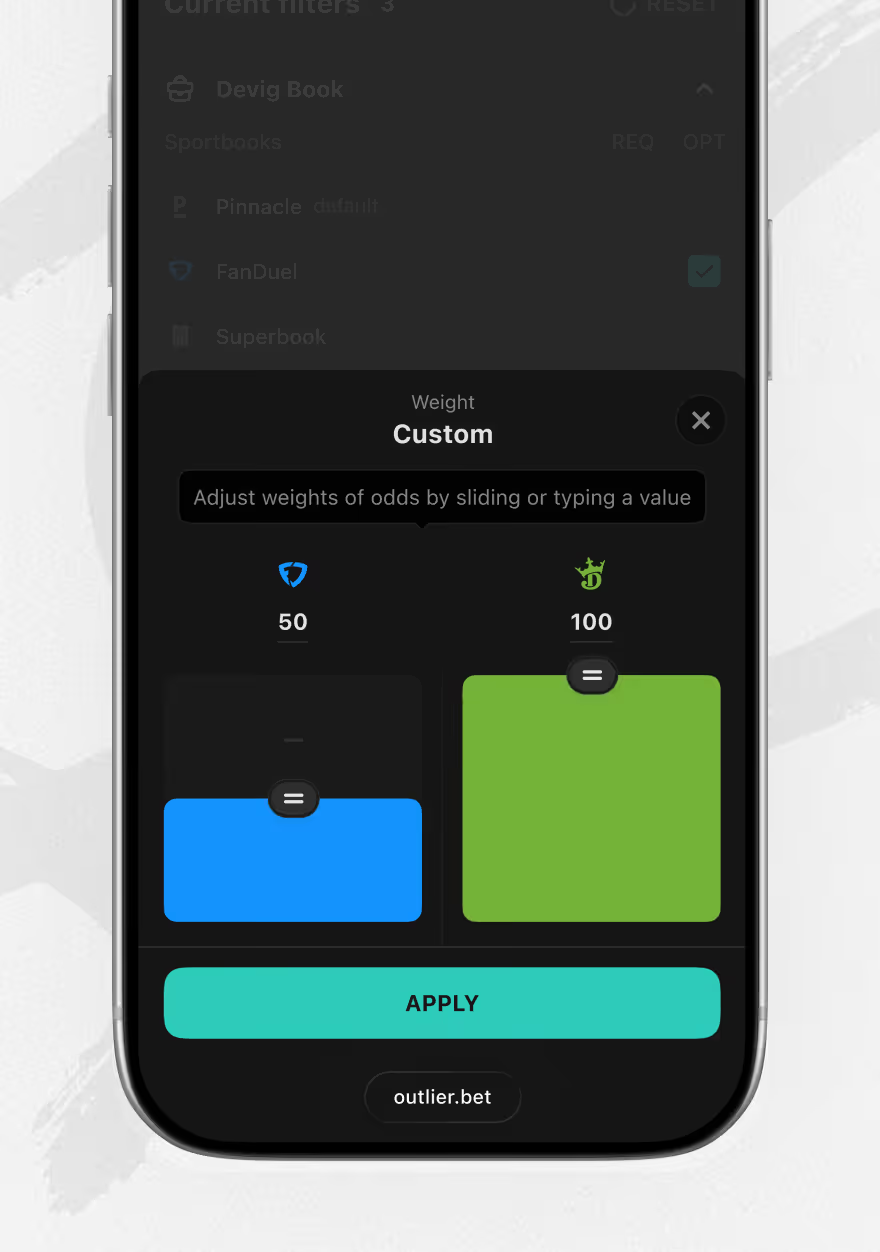
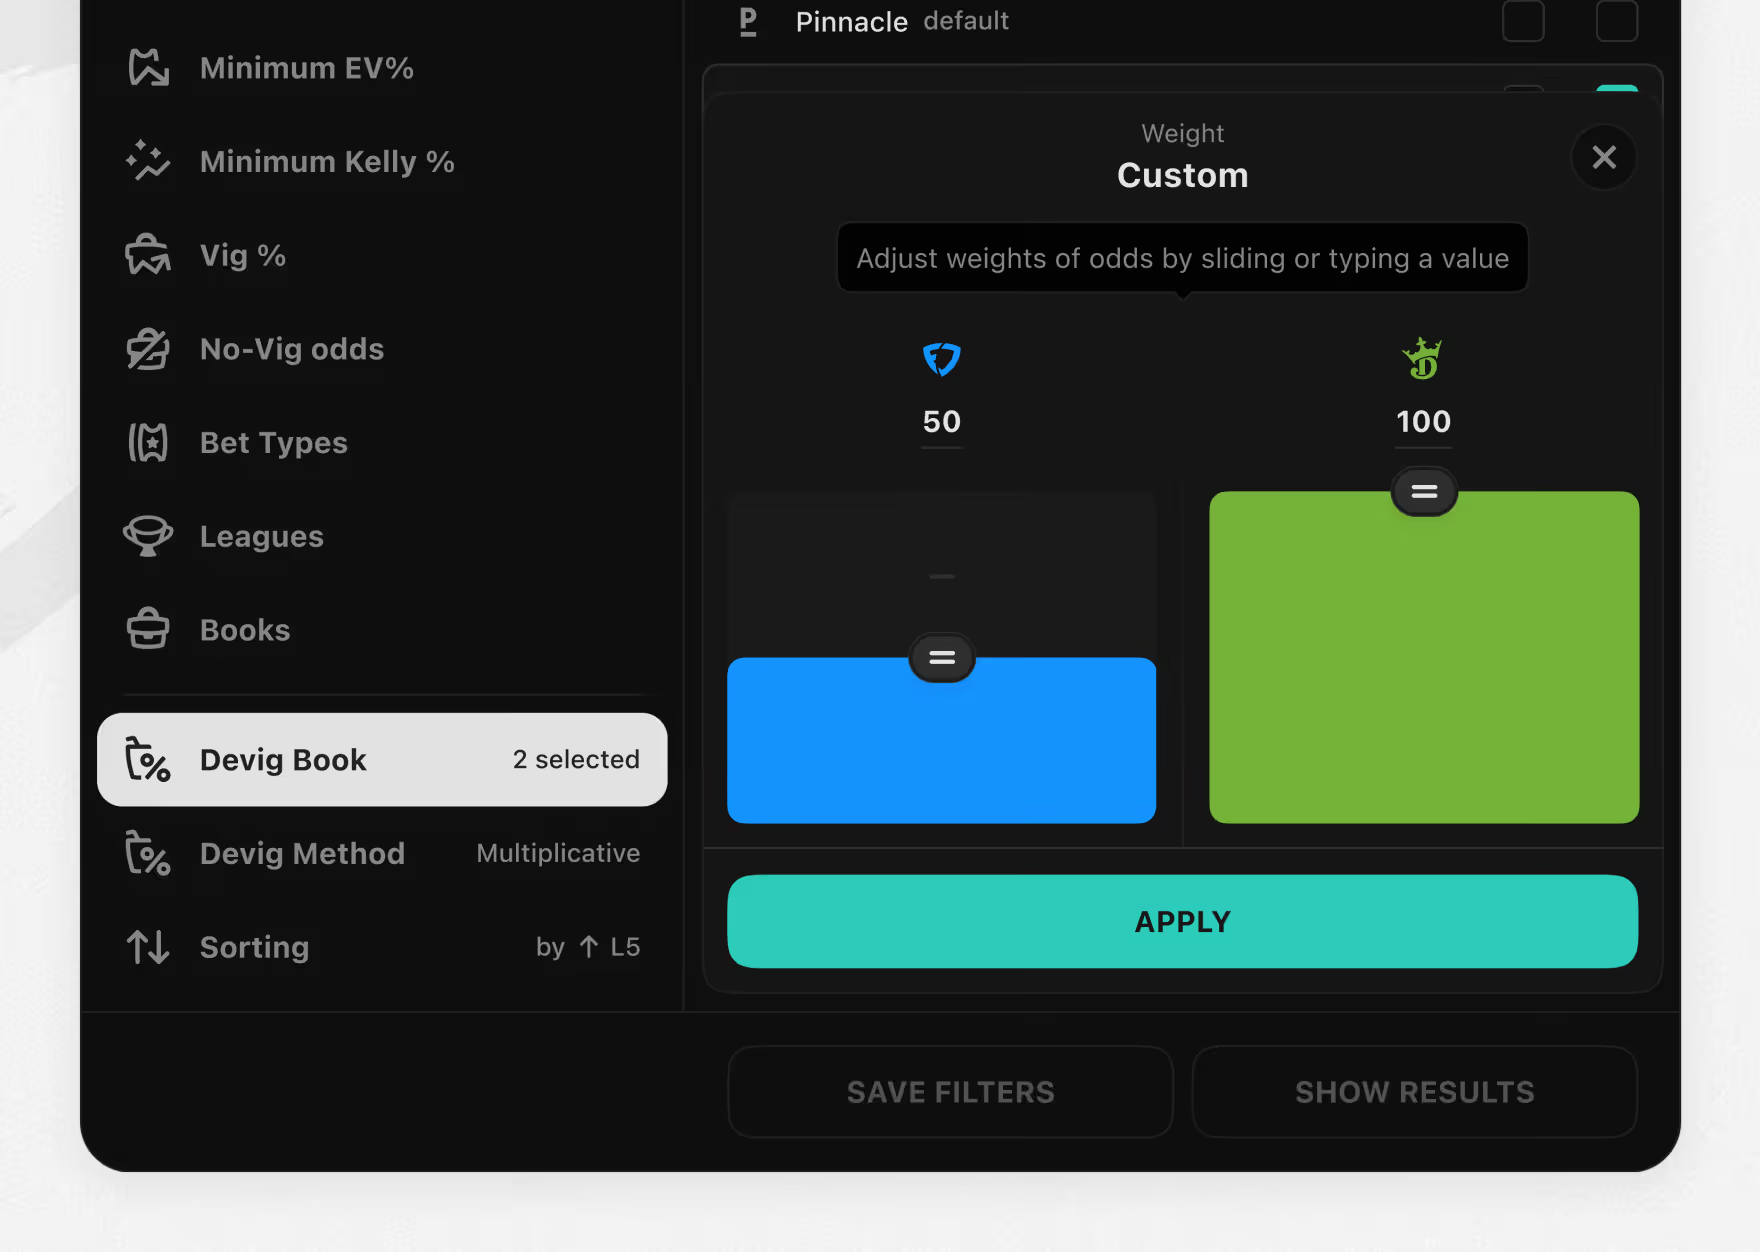
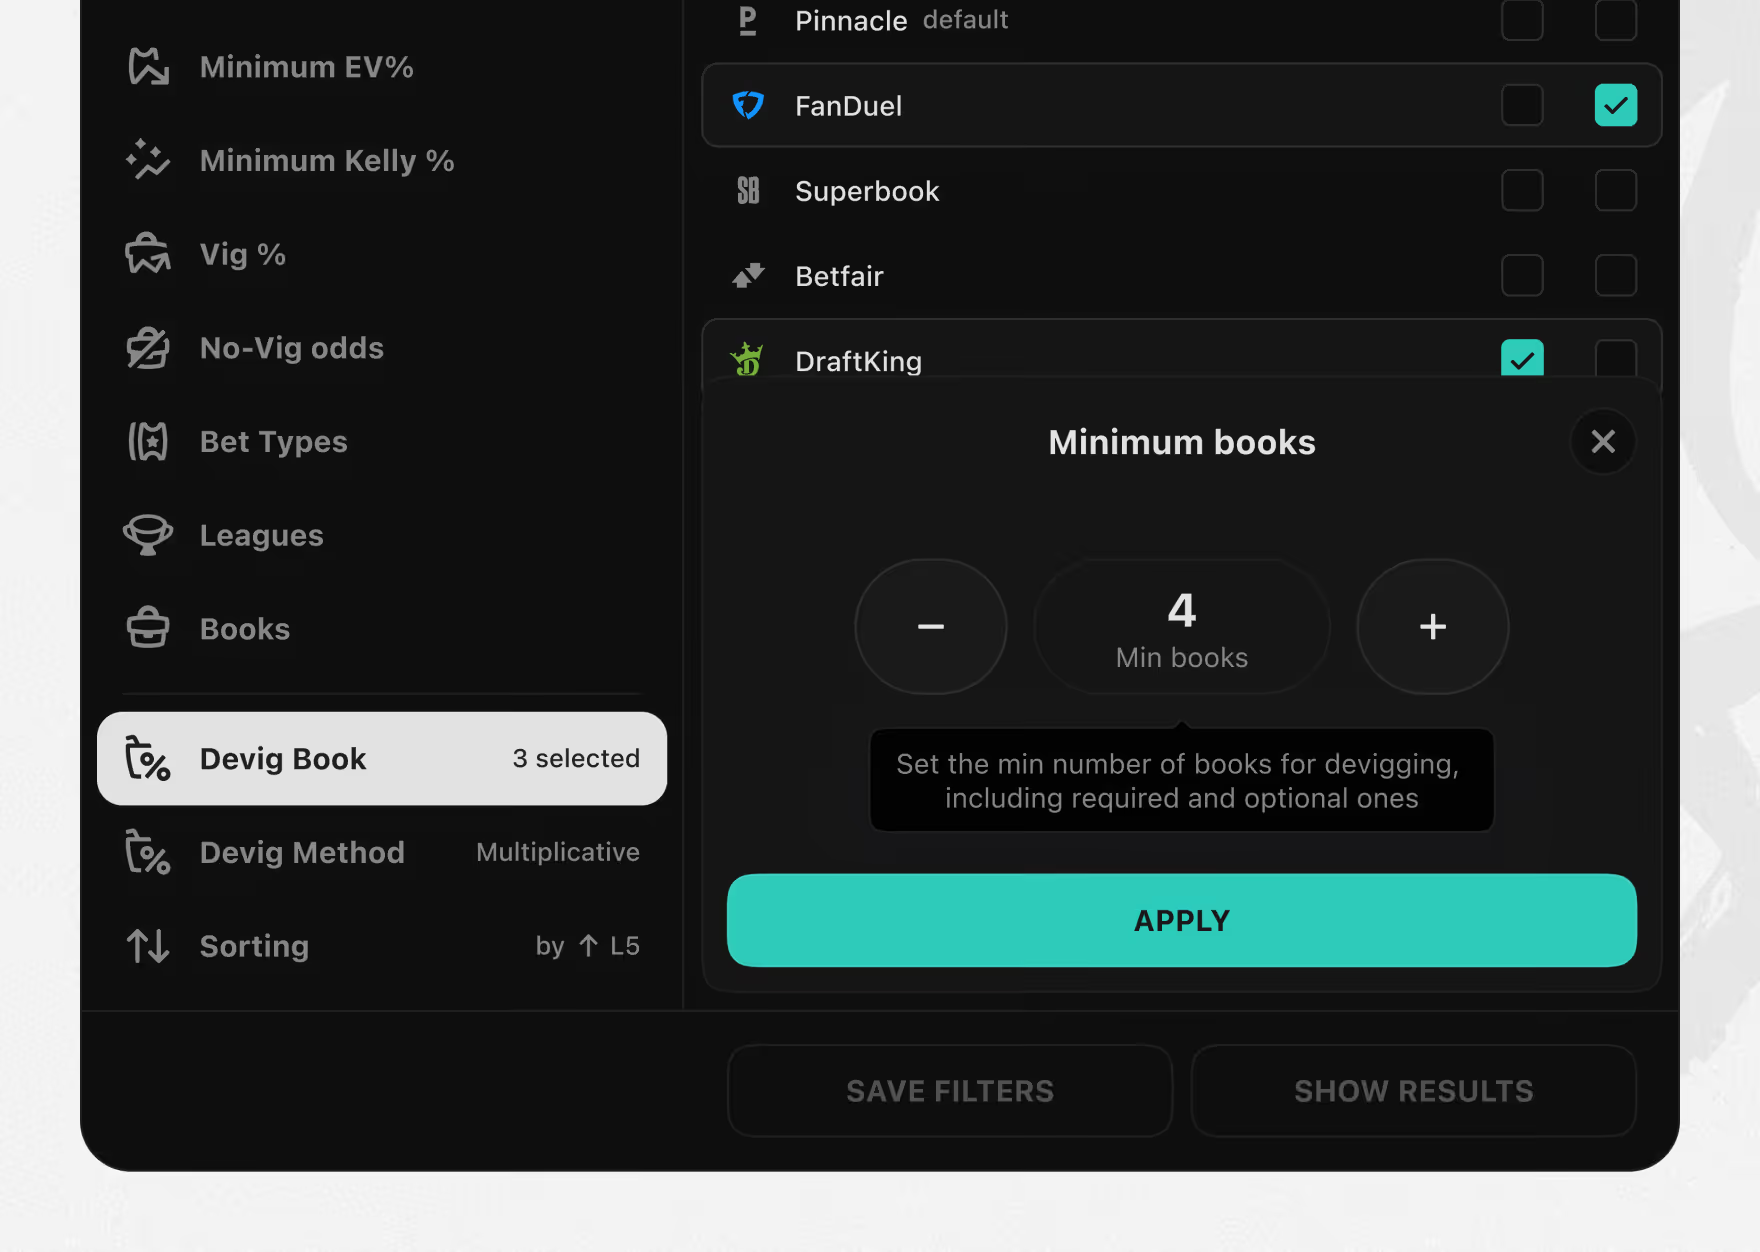
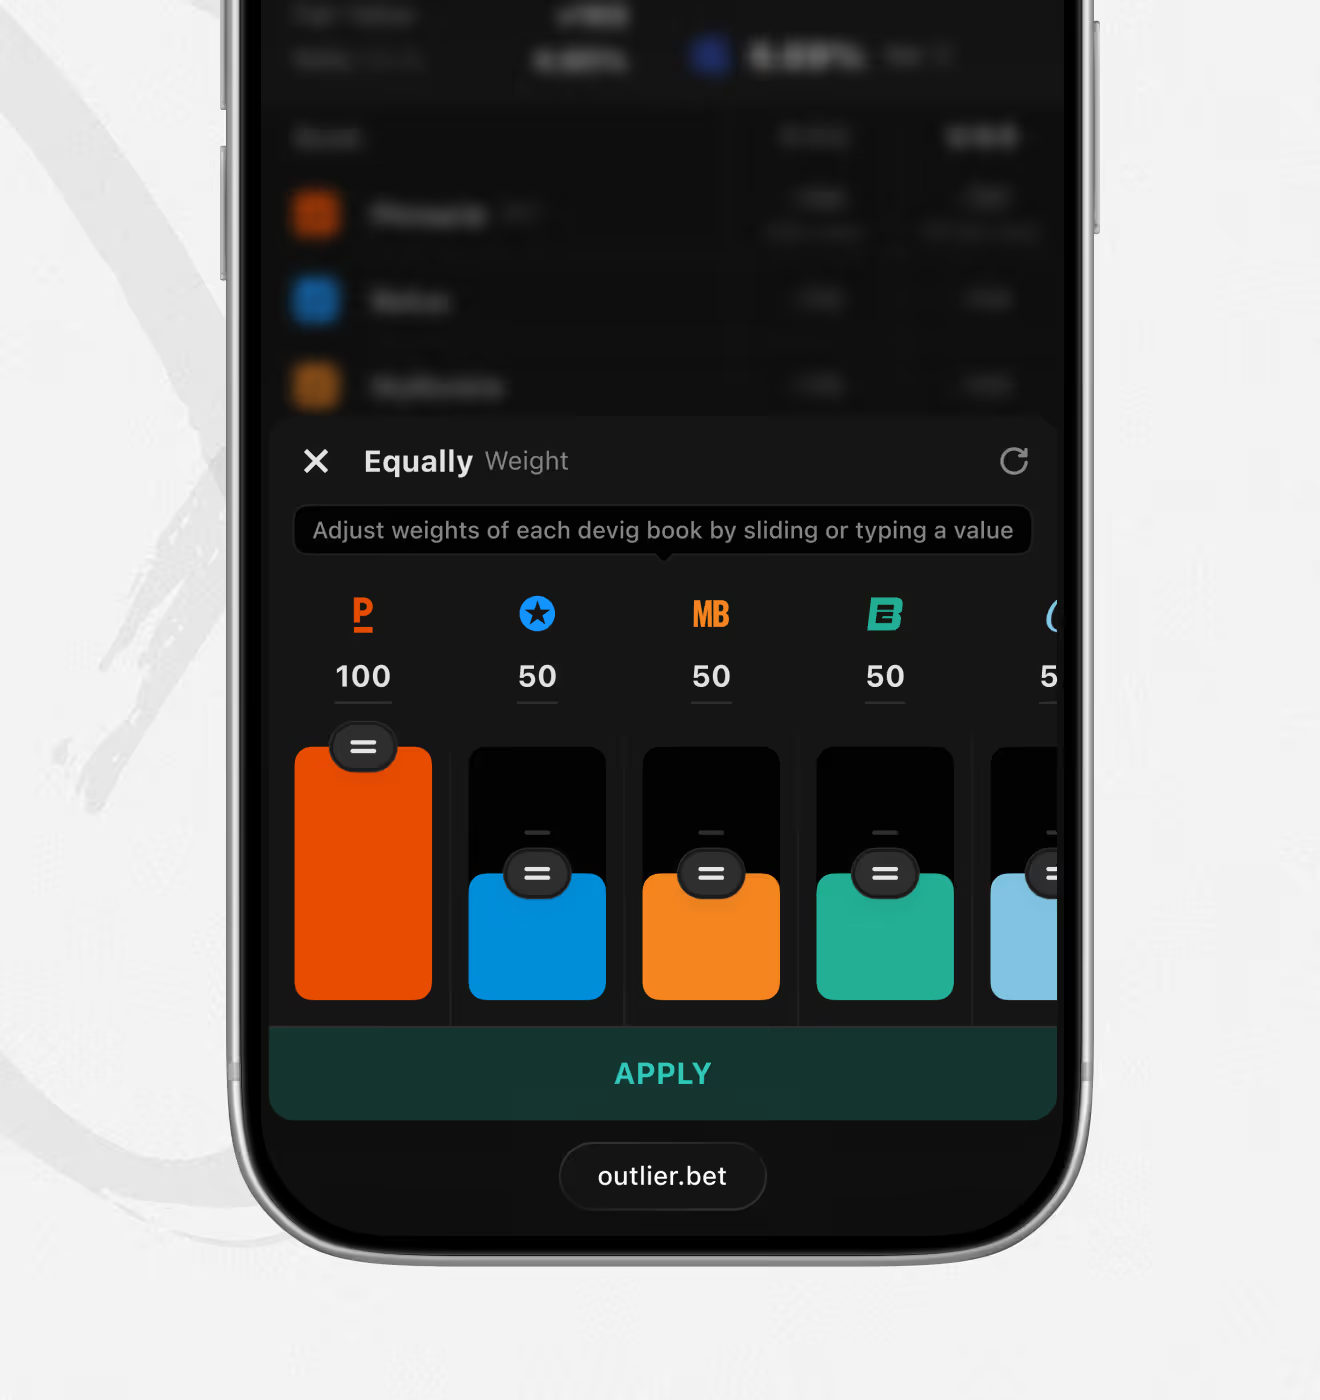
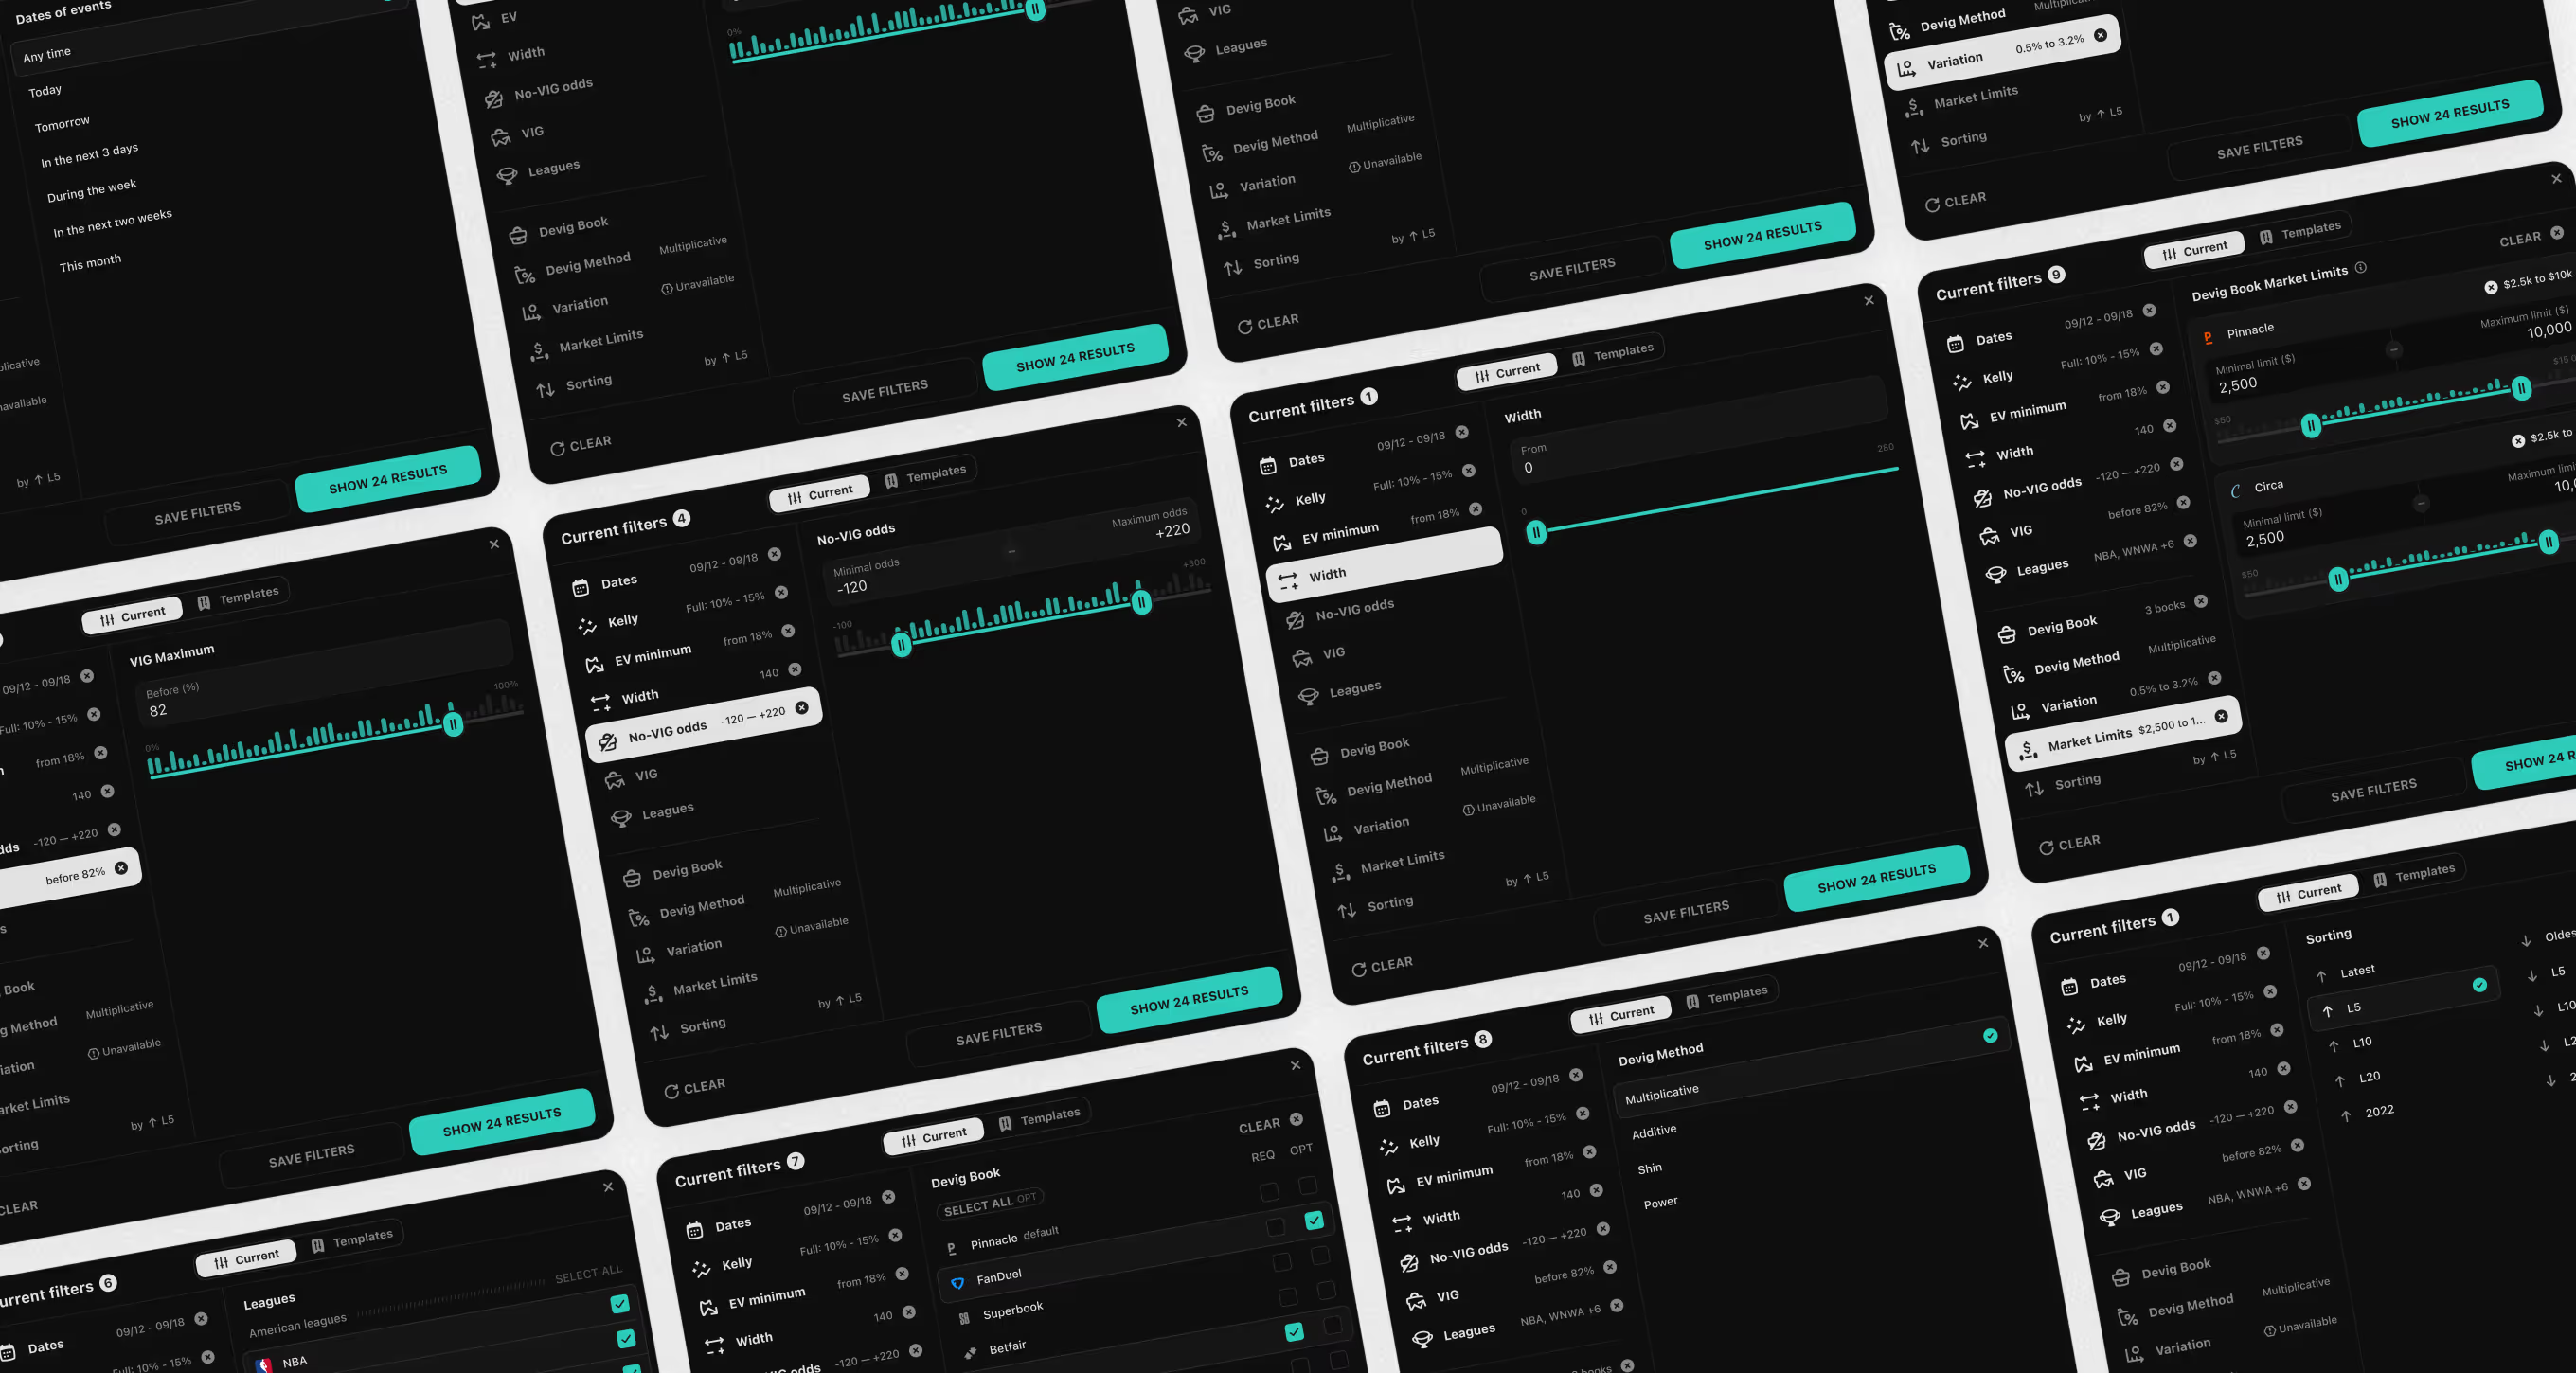
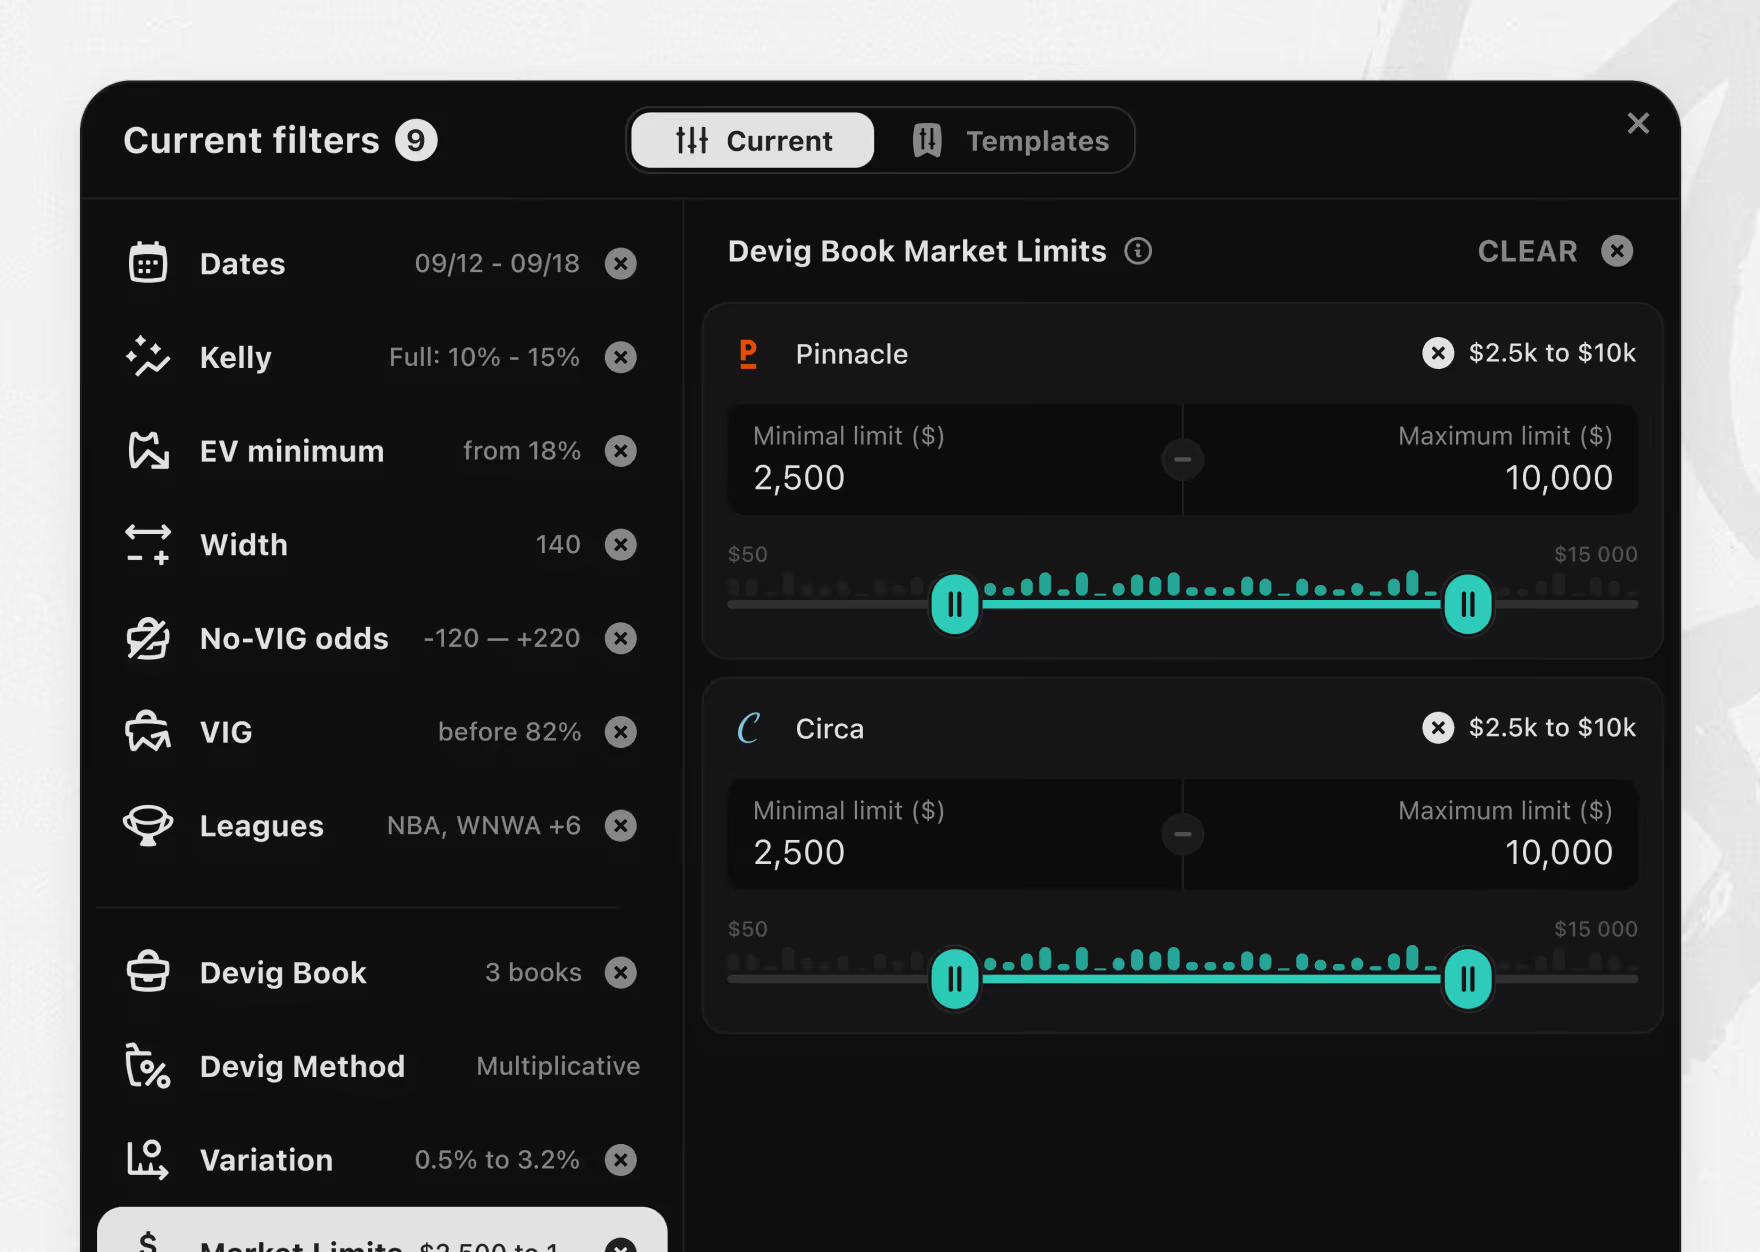
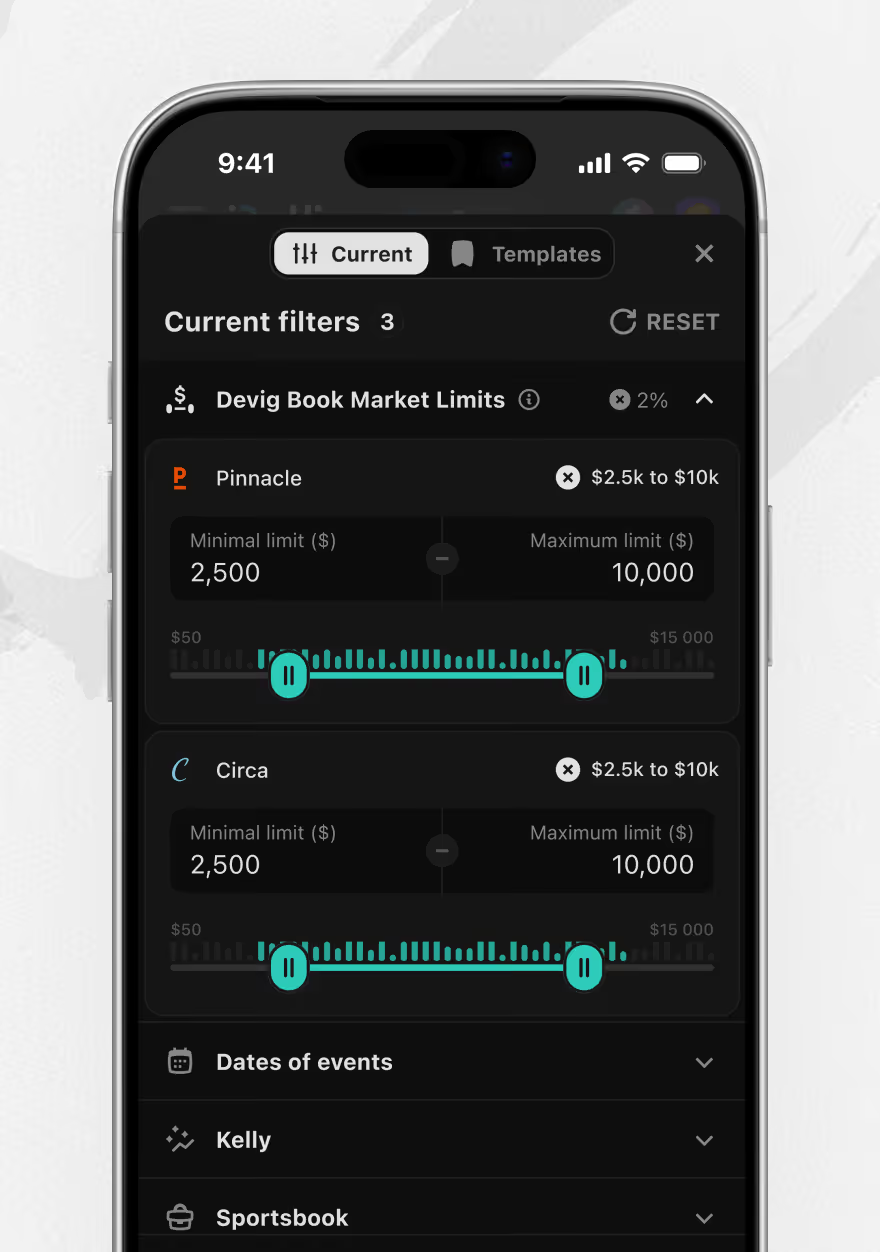
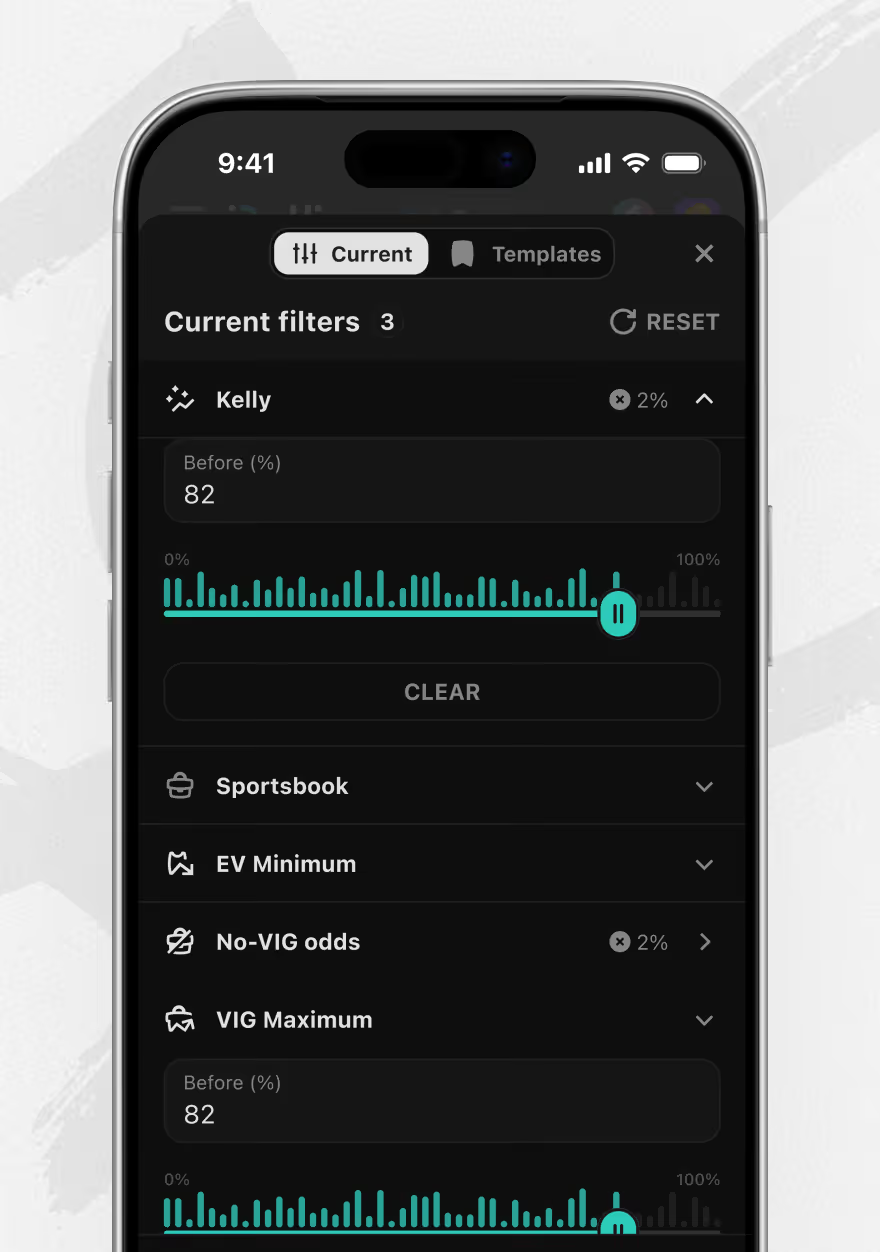
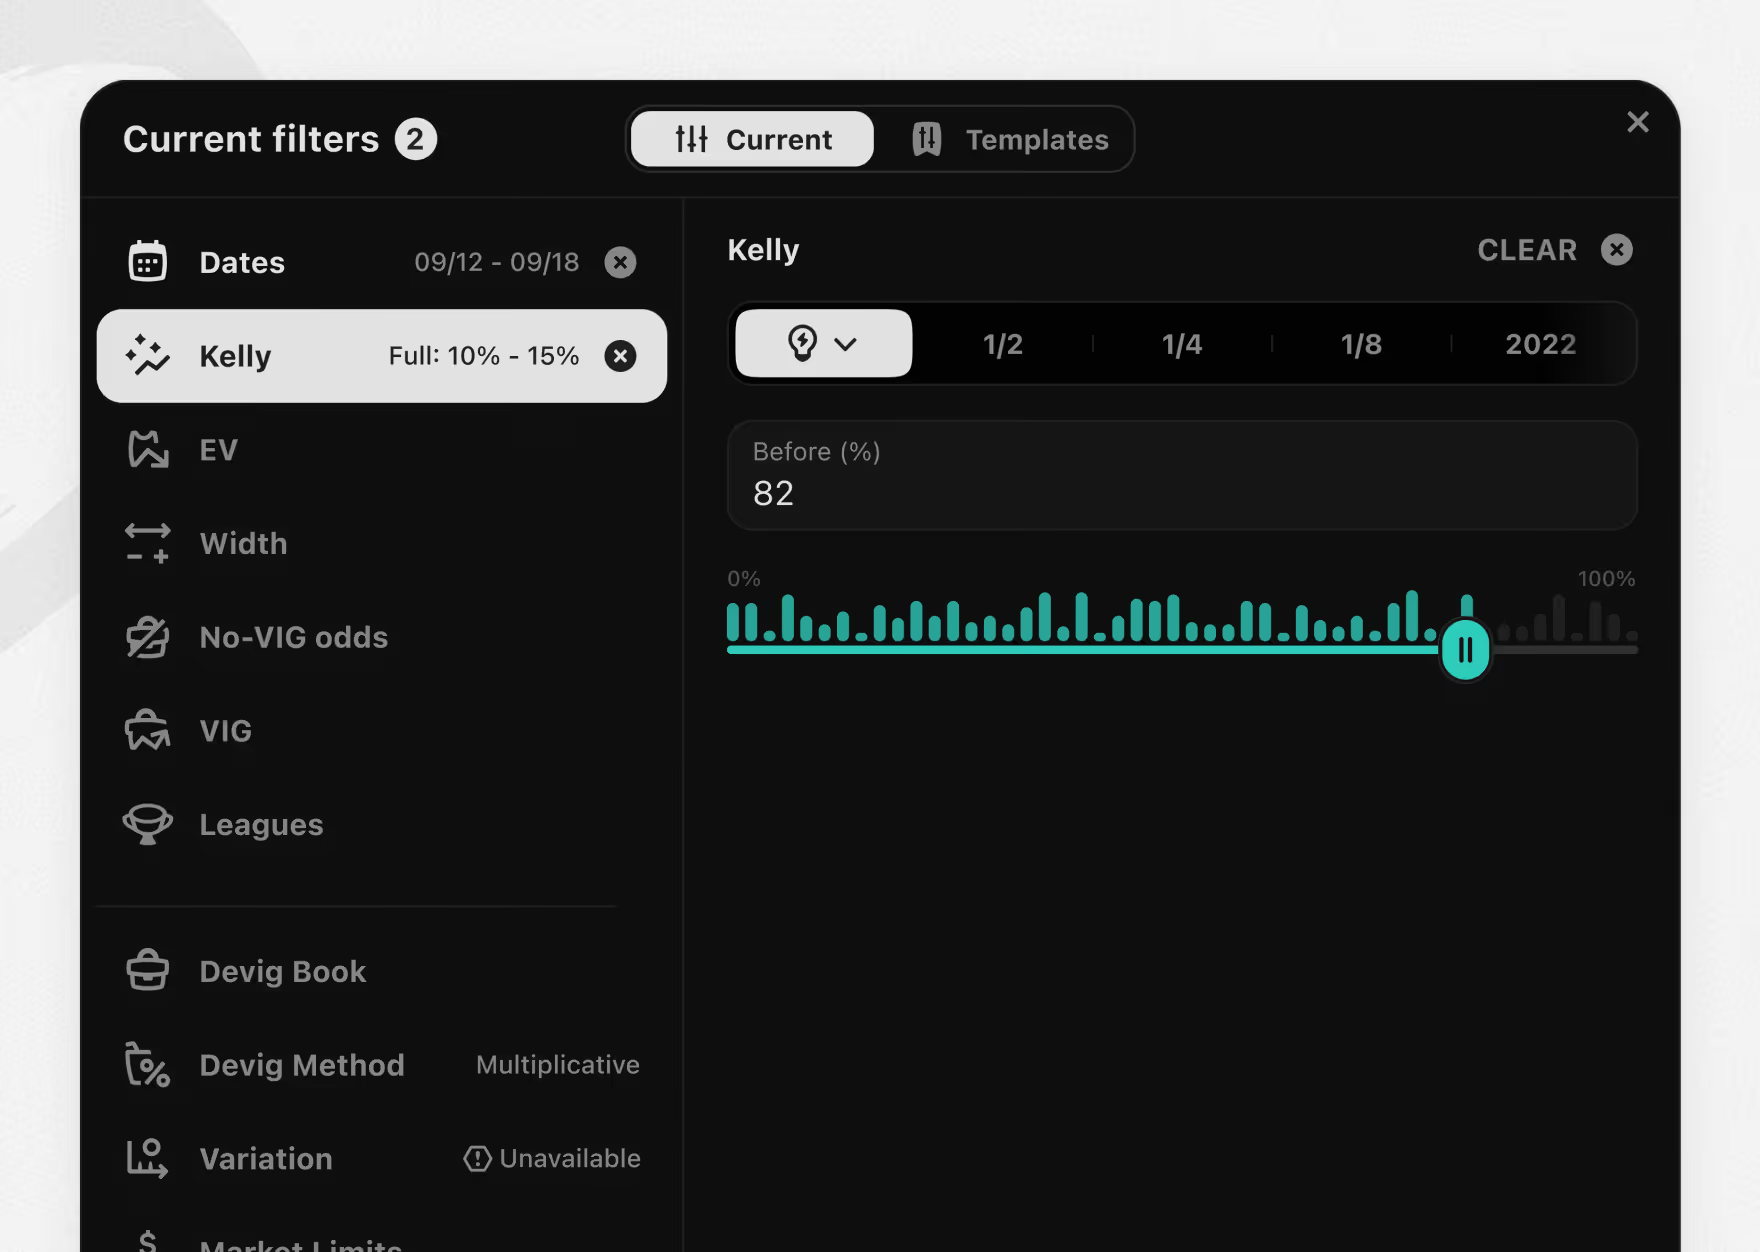
An advanced filter layer for bettors narrowing EV limits. Filters cover dates, Kelly range, minimum EV, width, no-vig odds, de-vig method, and per-book limit ranges.
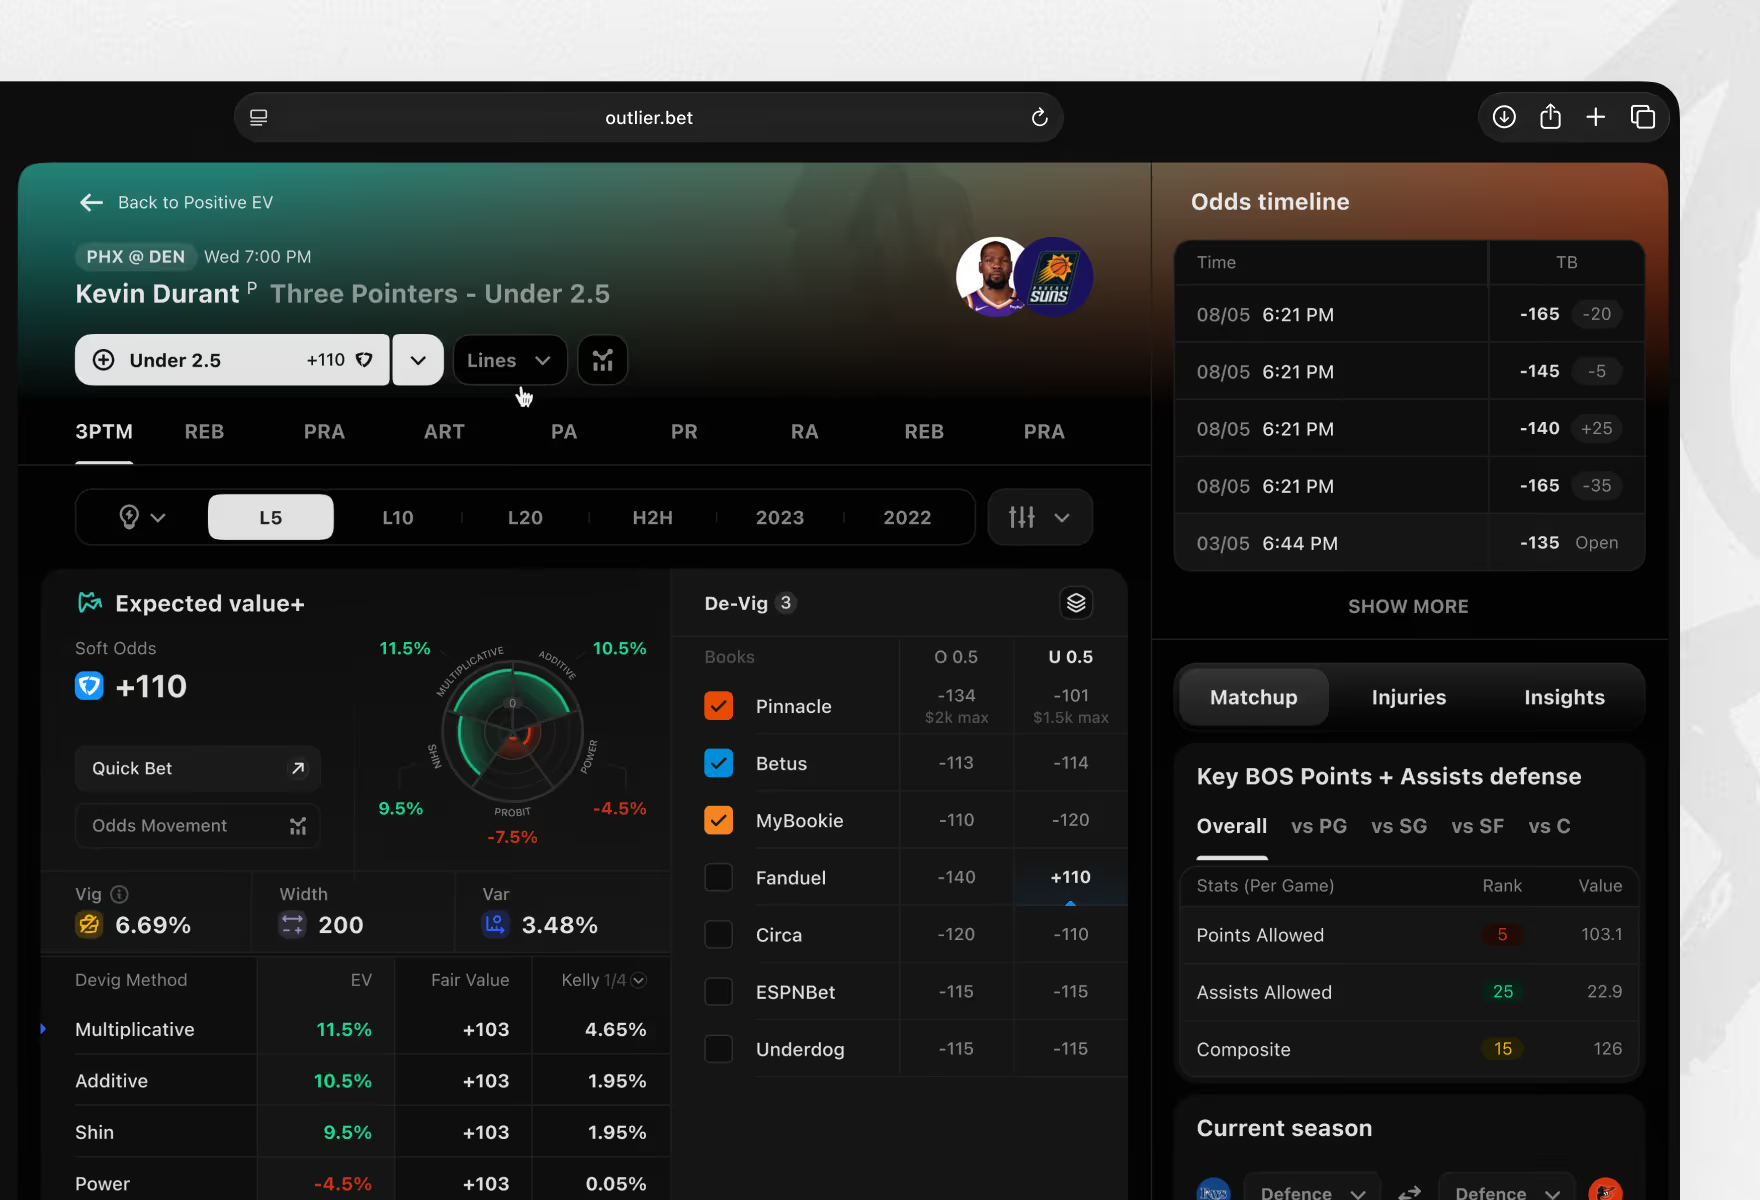
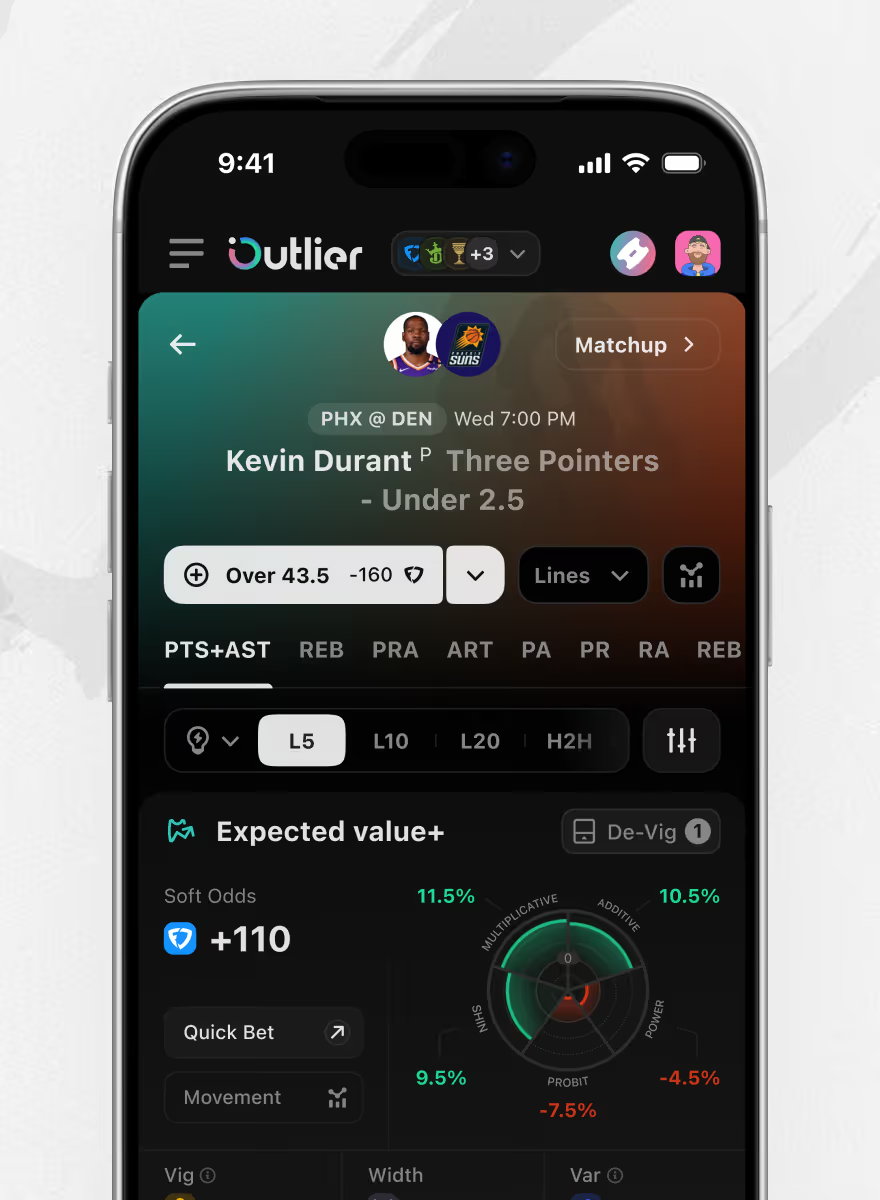
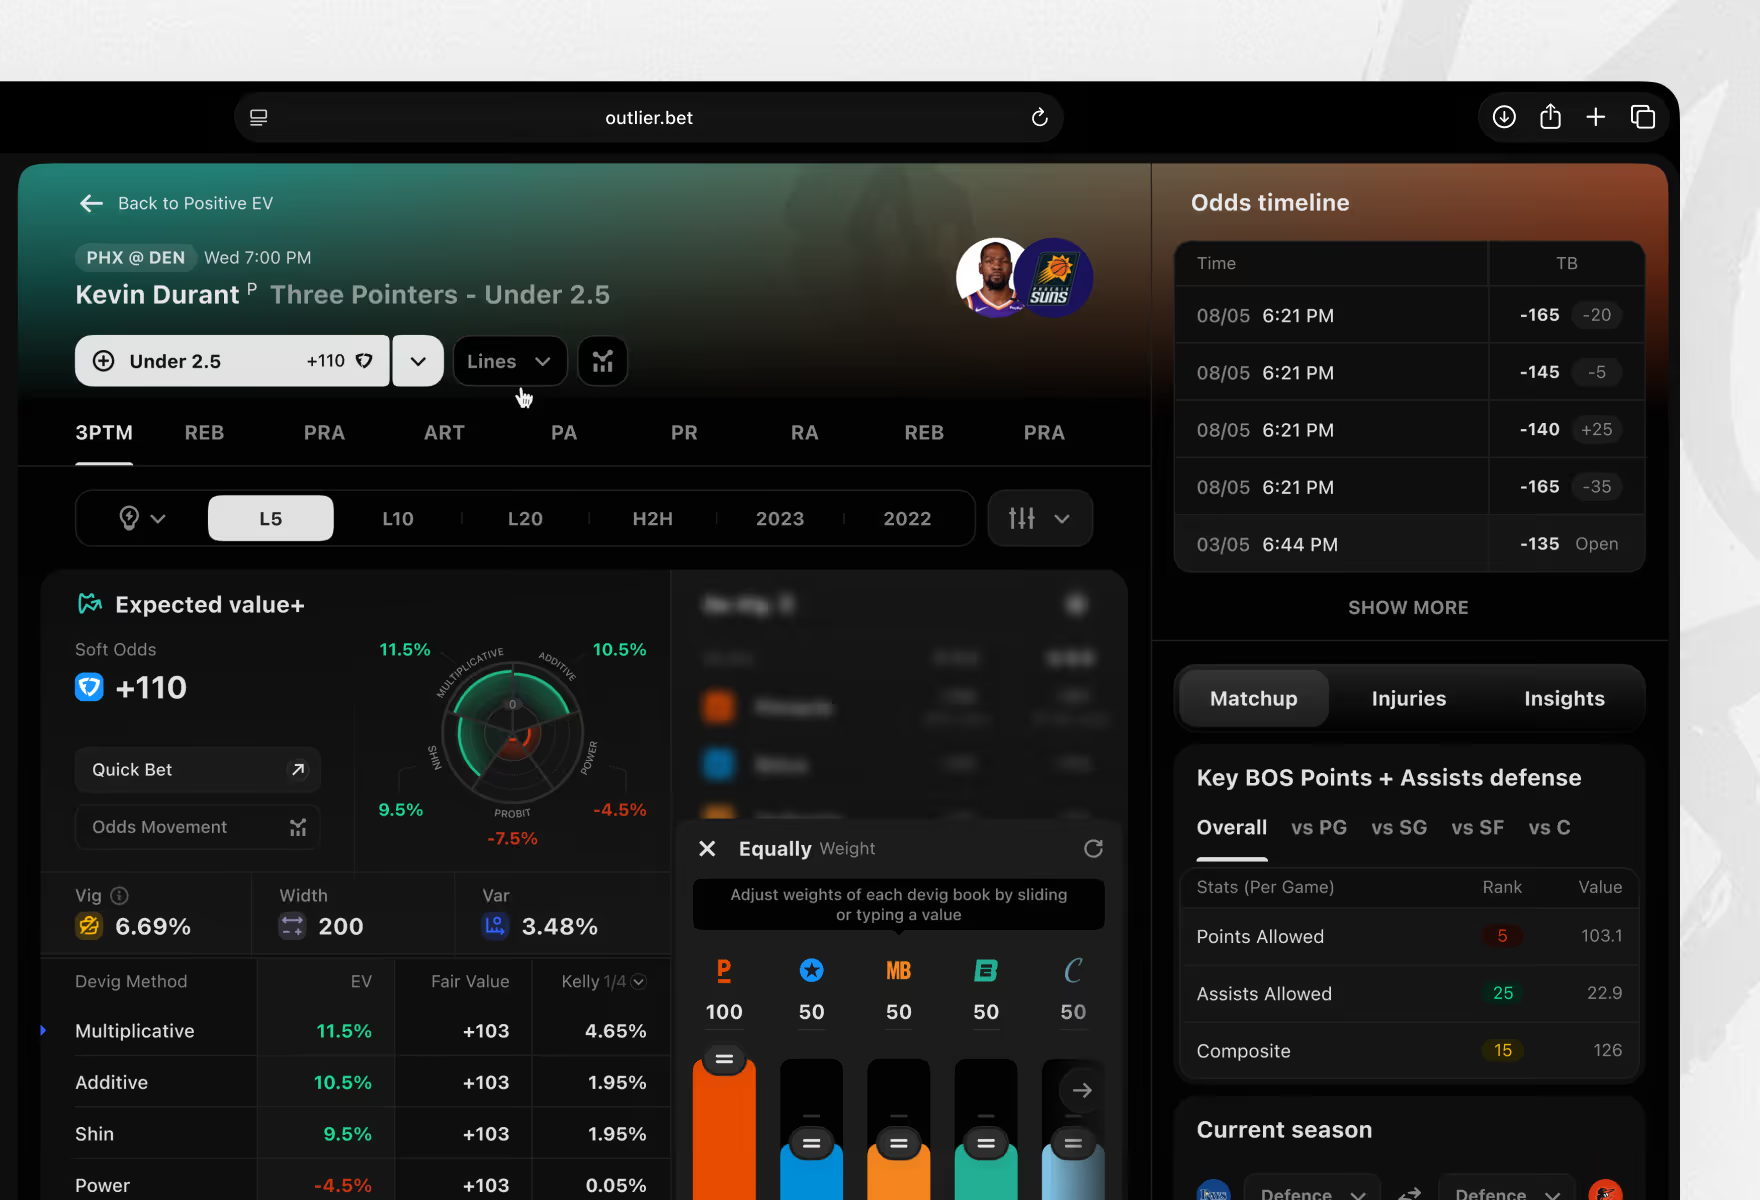
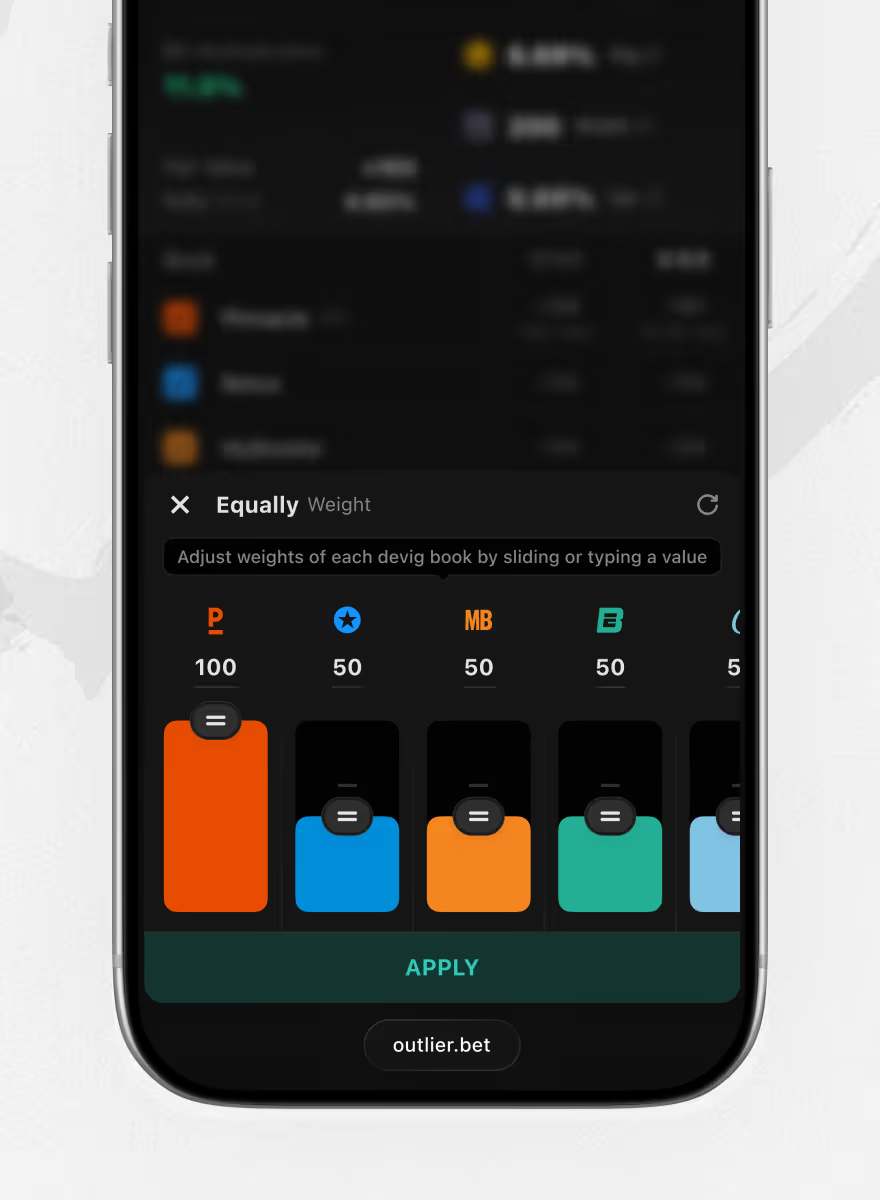
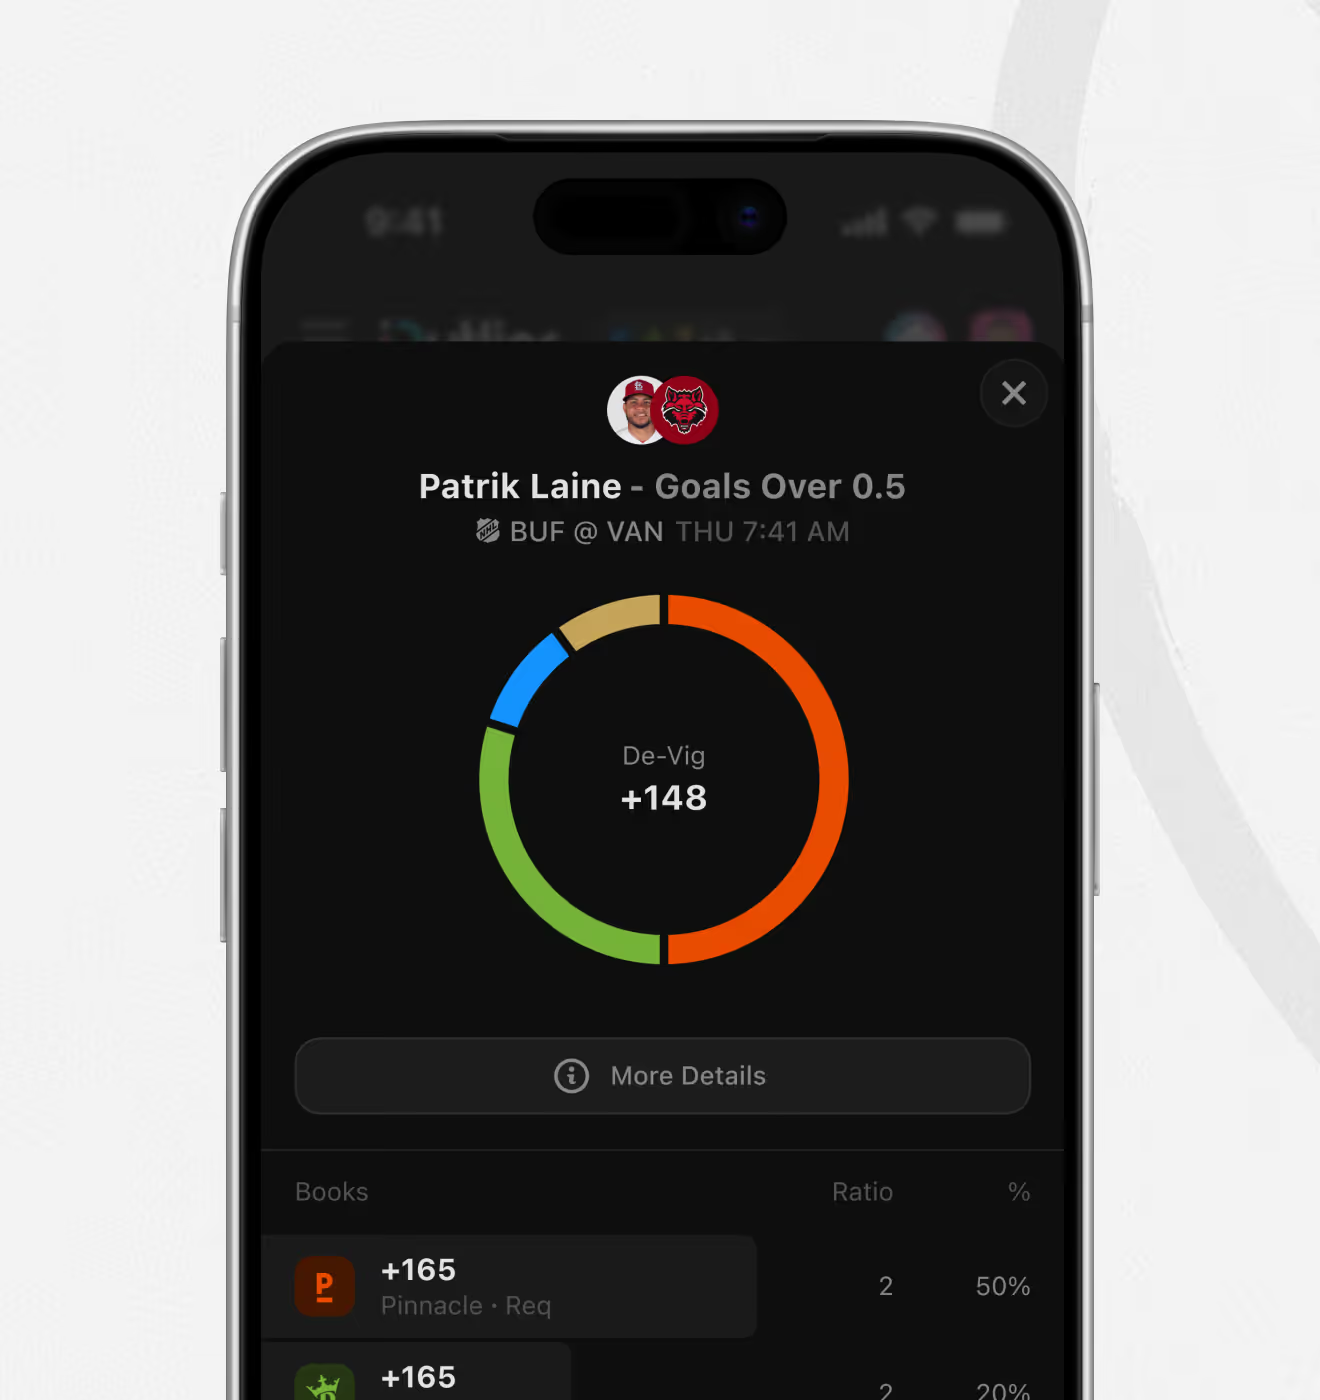
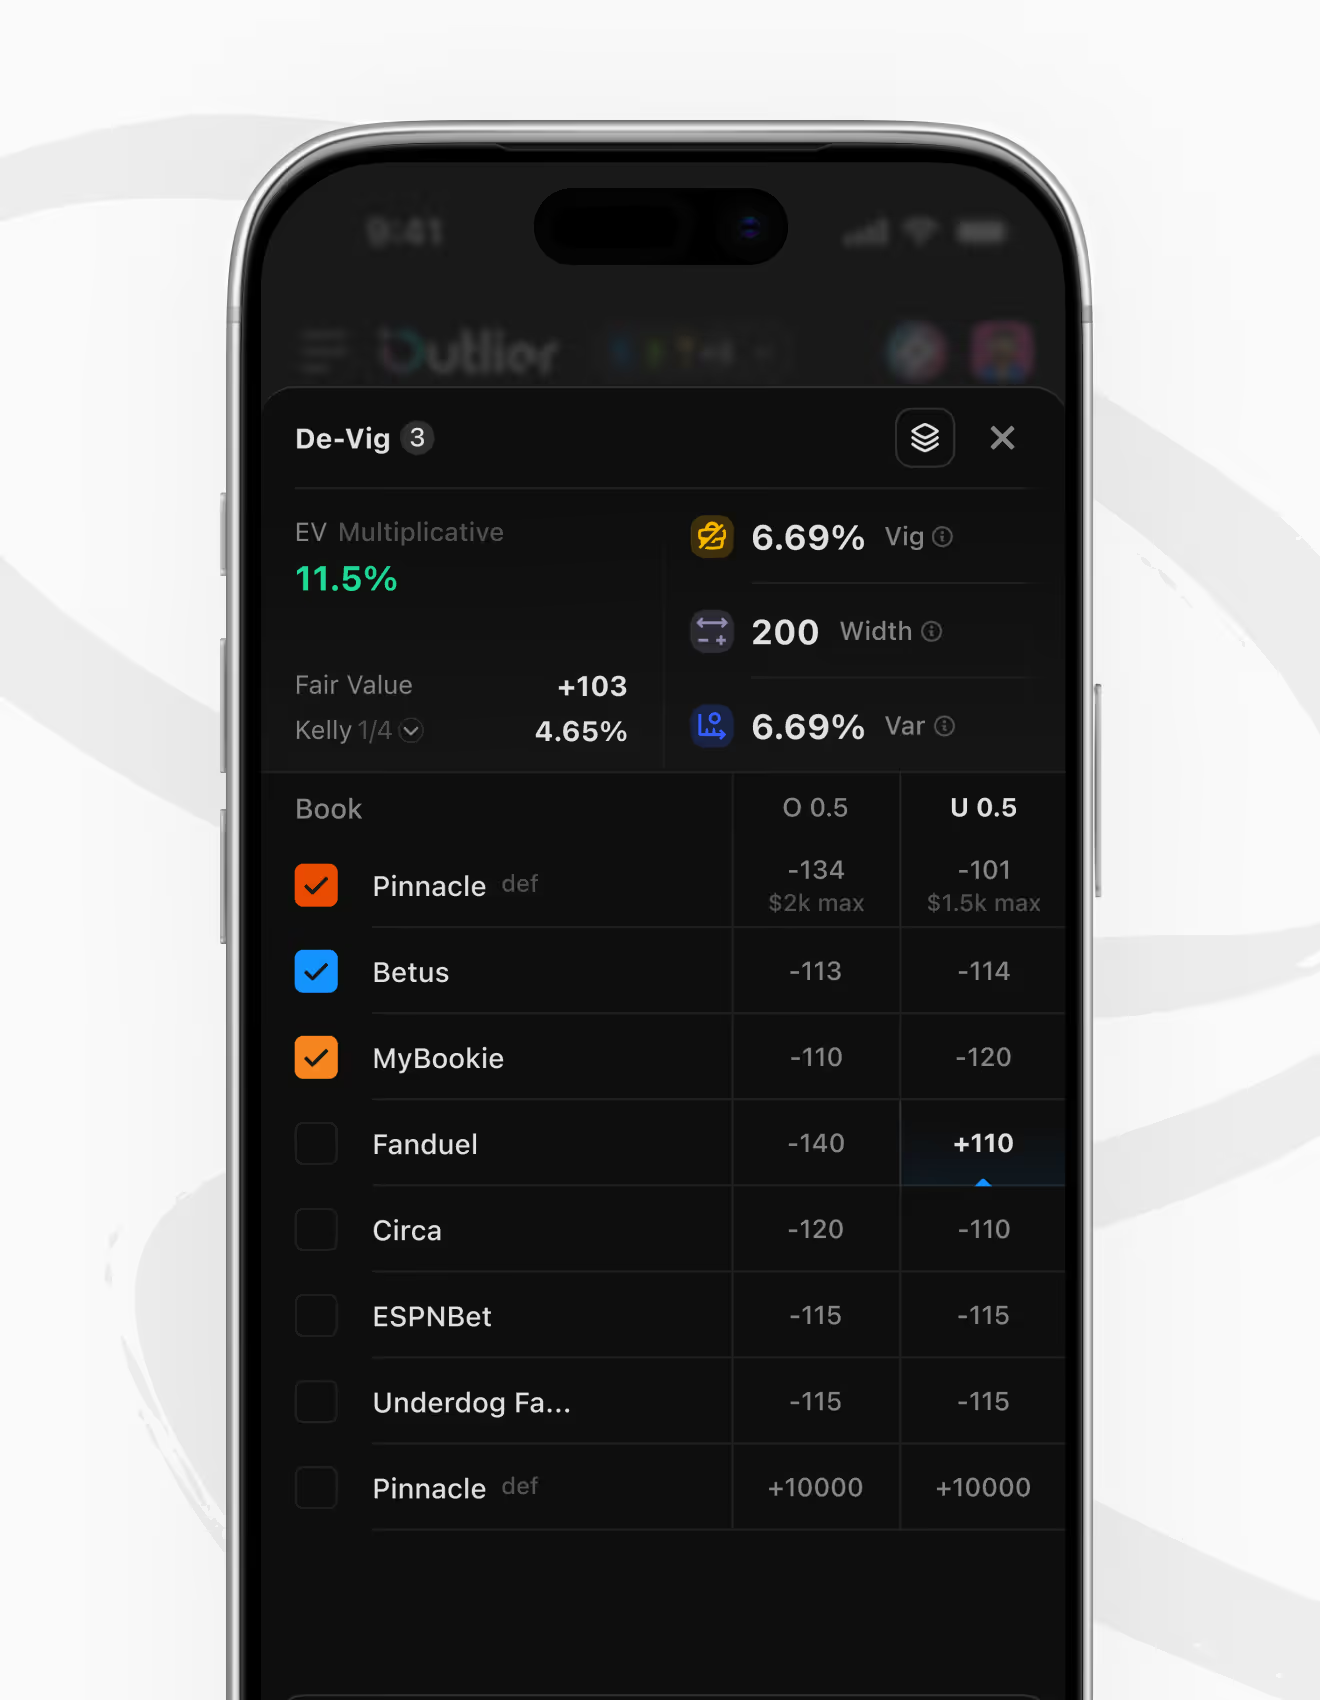
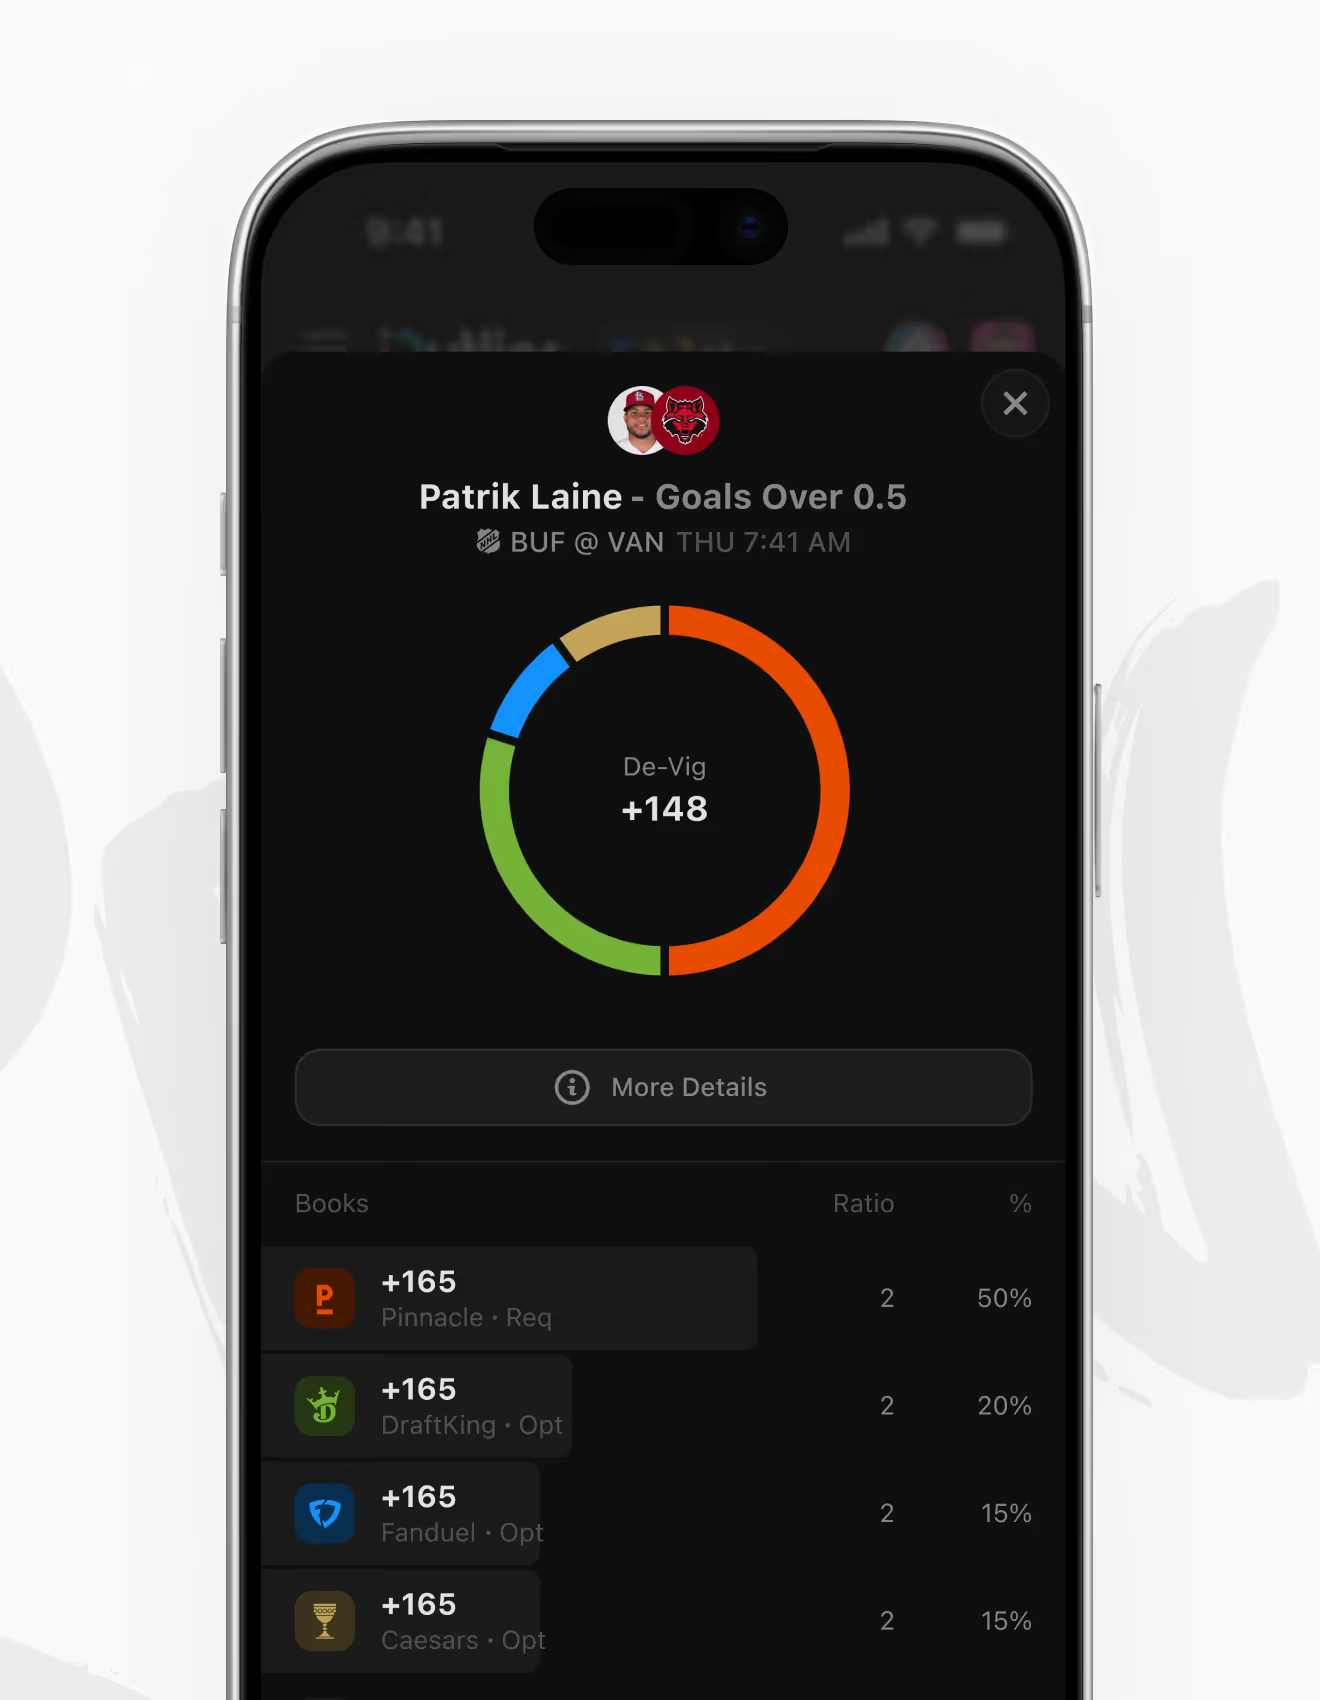
A mobile drill-down showing how a de-vig fair value is built for one bet. EV%, vig%, width, and Kelly stake sit above a book-by-book odds table with stake limits, next to a ring chart weighting each book's share of the fair line.
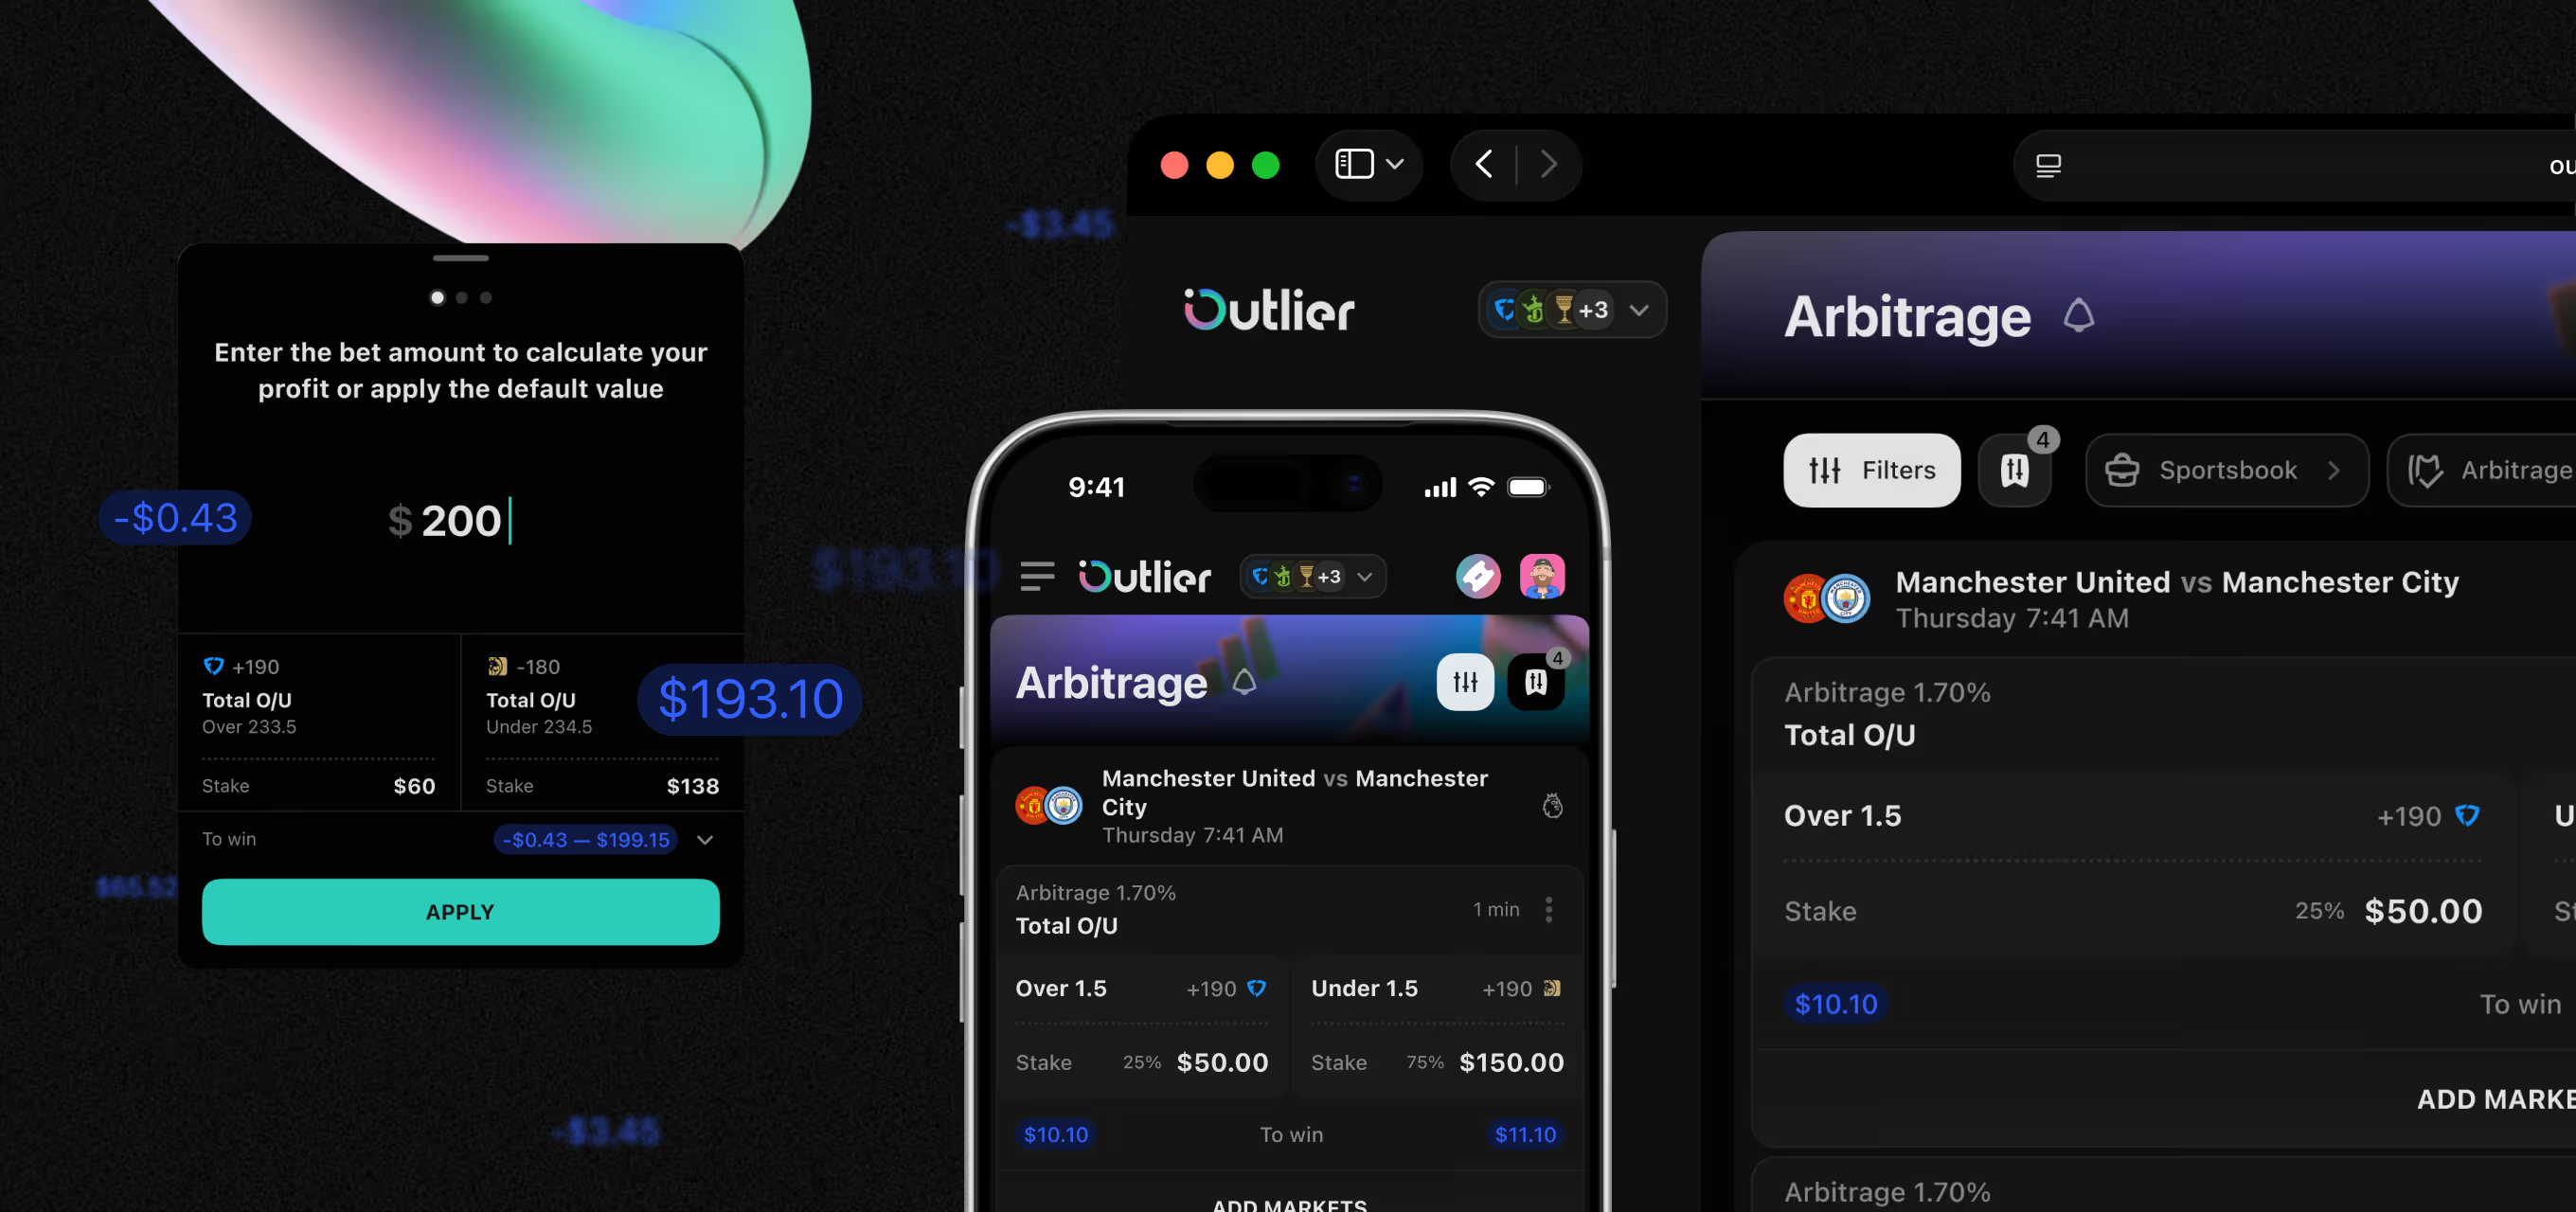
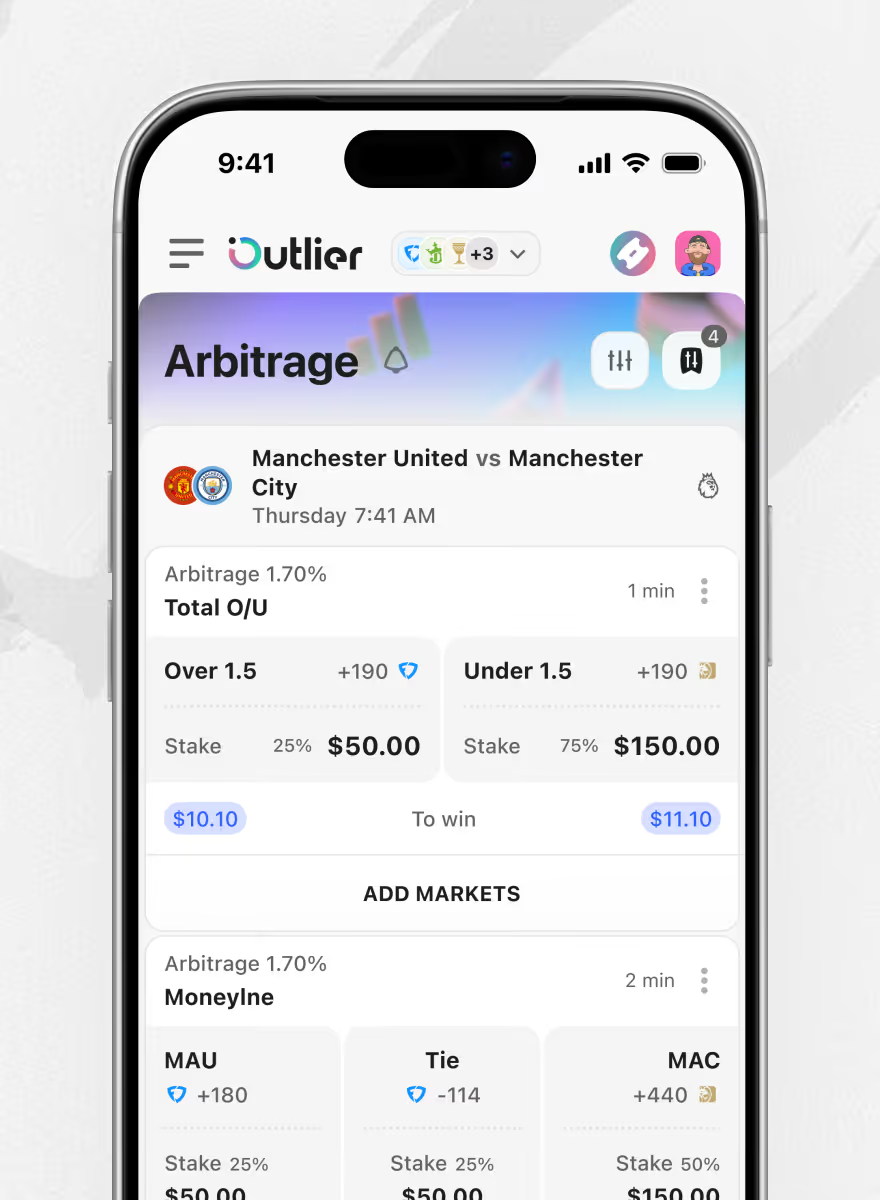
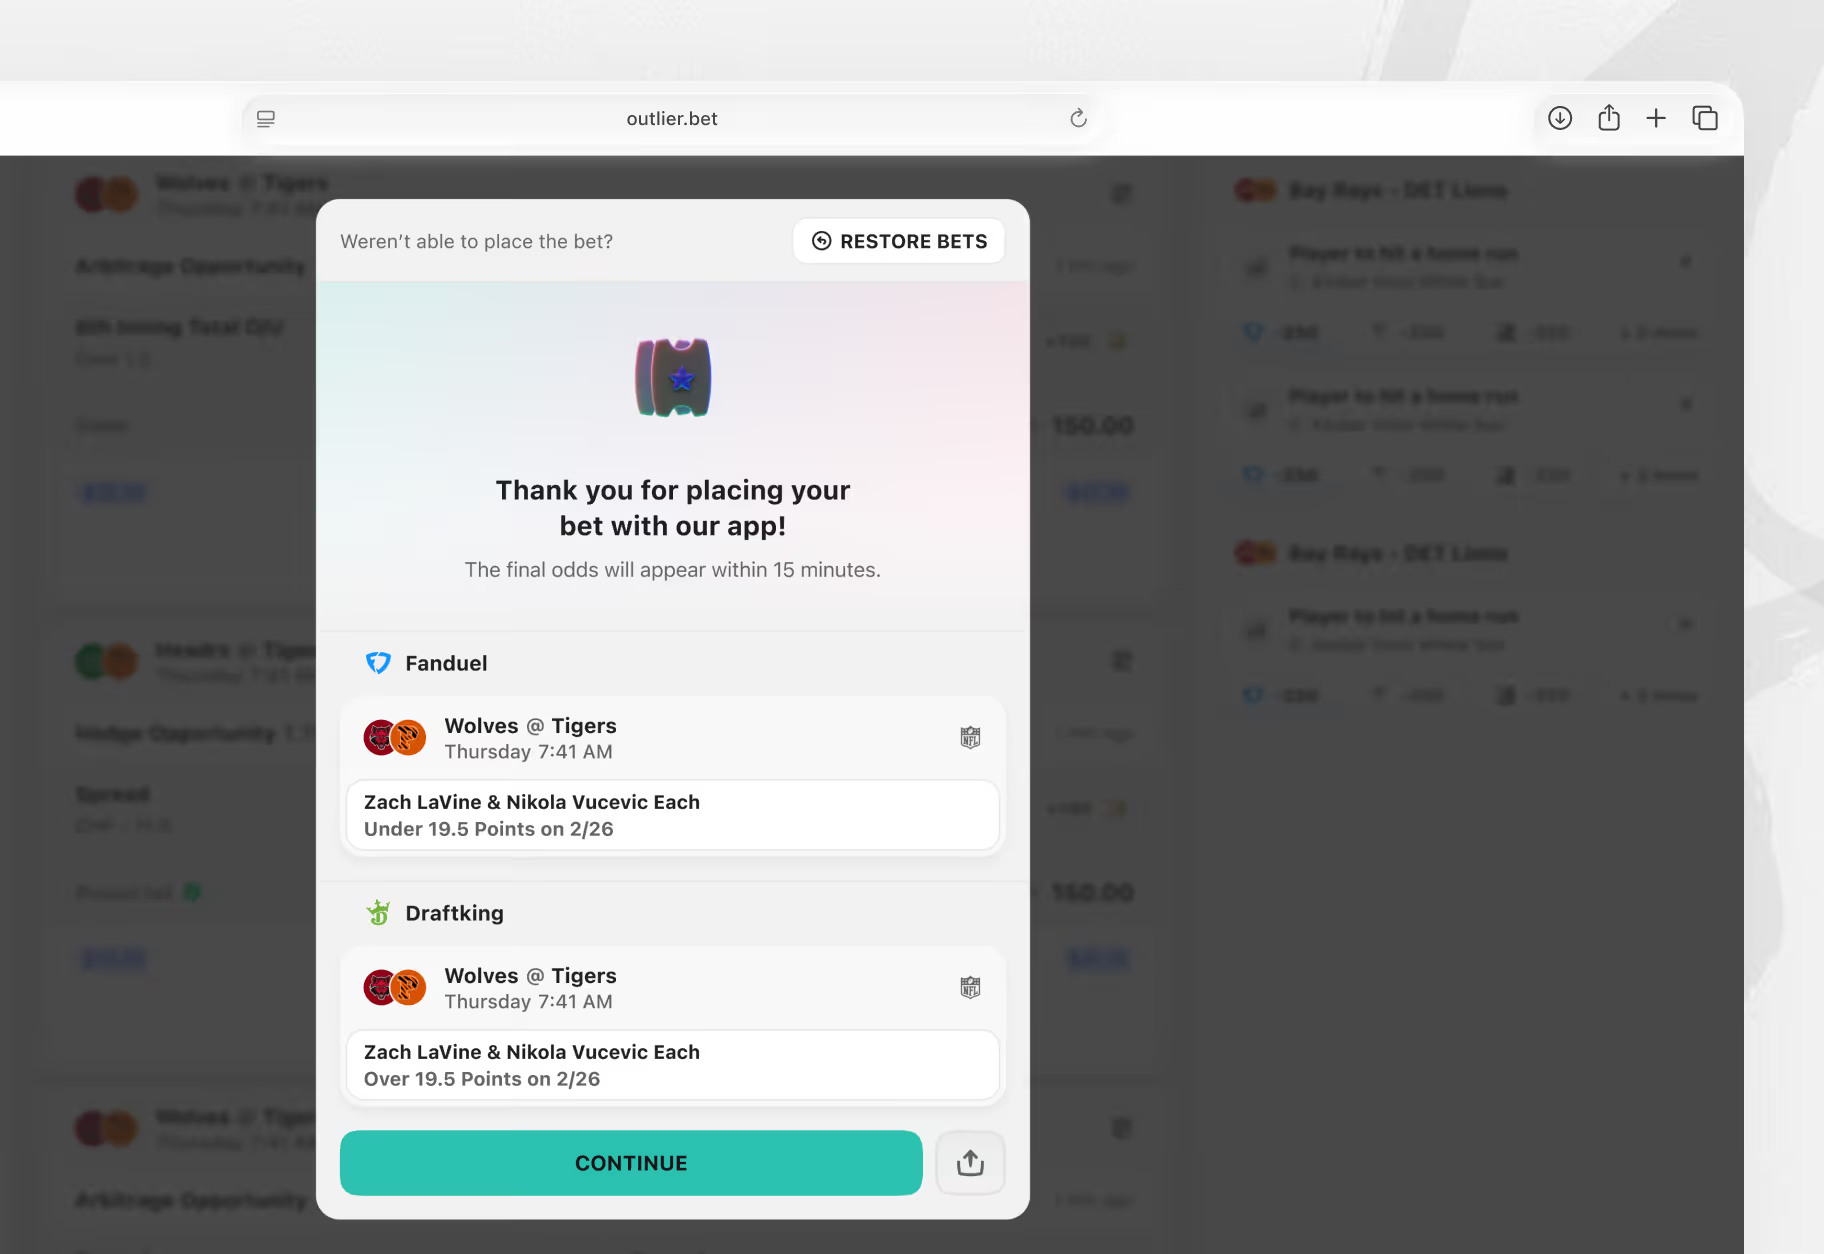
An arbitrage calculator that splits stake across two or three sportsbooks for a guaranteed return. Bettors enter one amount, see the stake split and arbitrage percentage, then hand off to bookmakers via a QR code and confirm the bet.
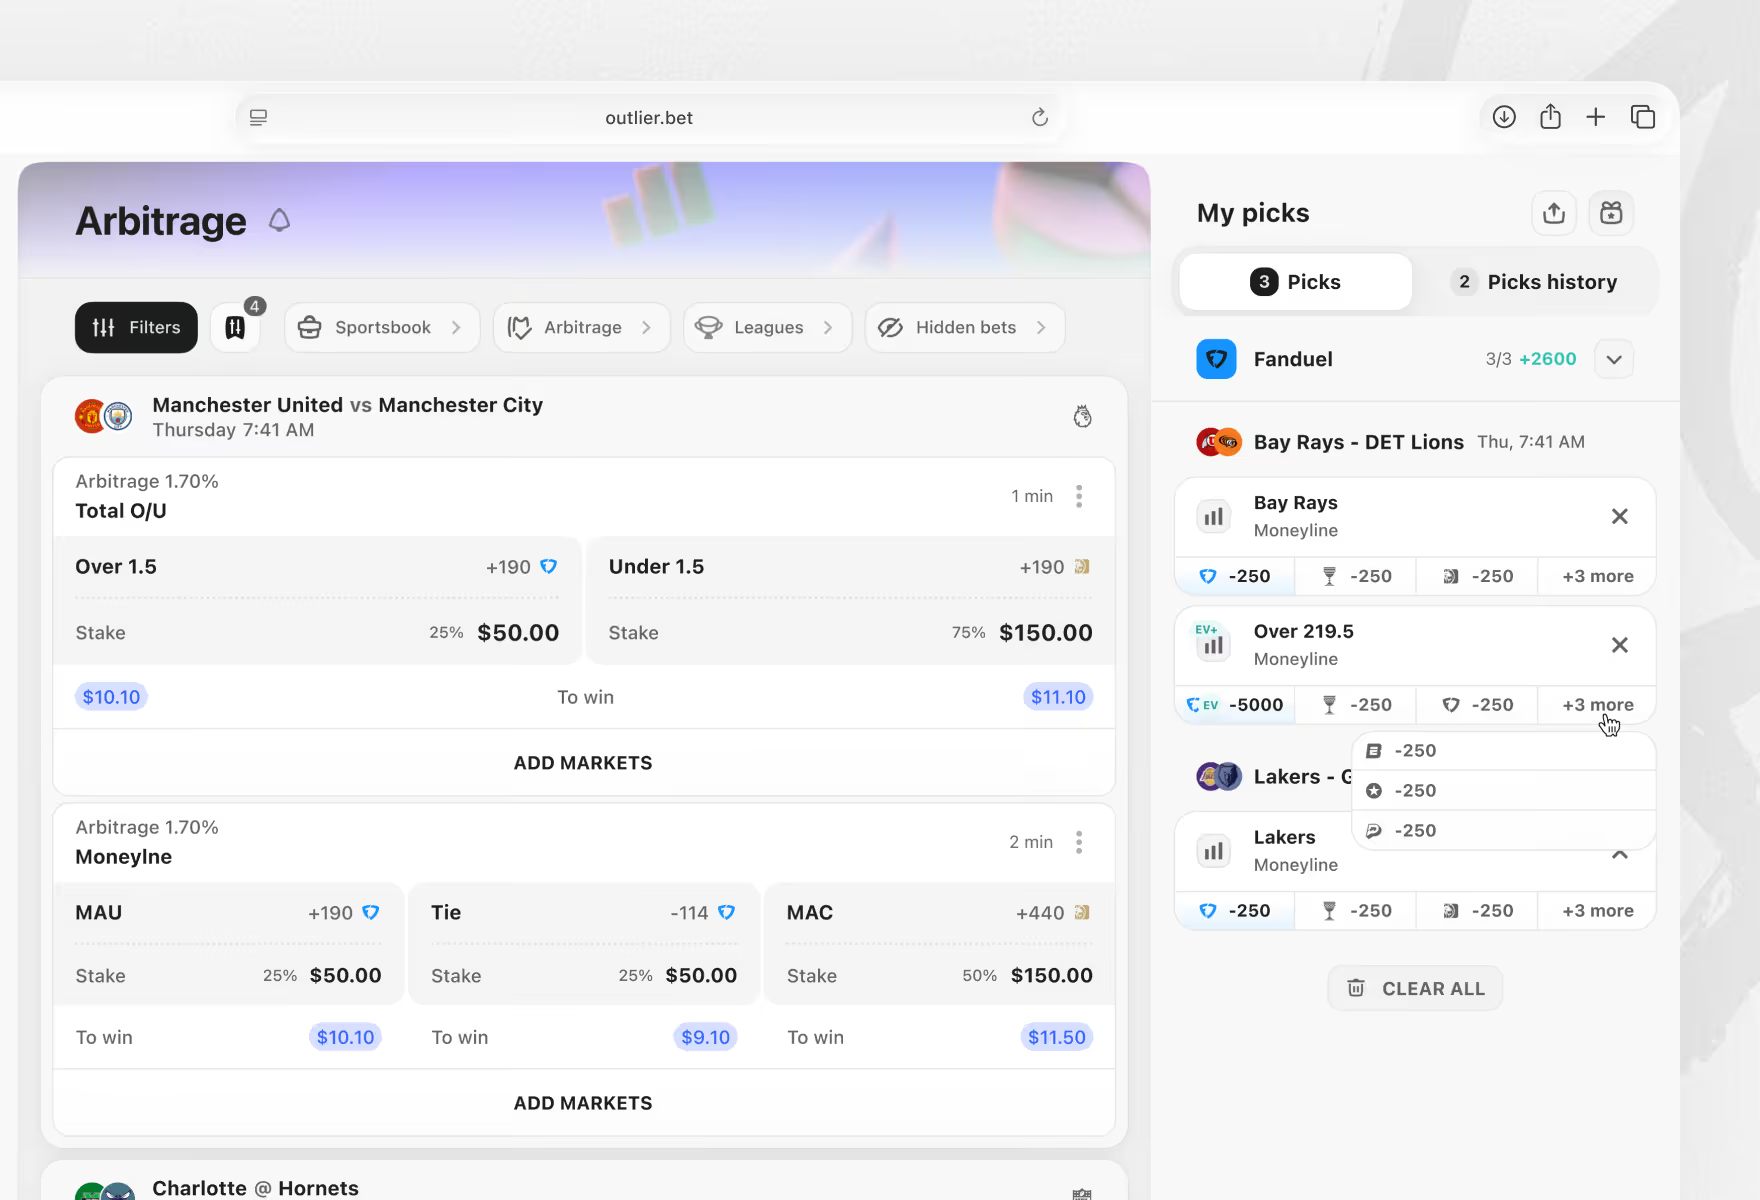
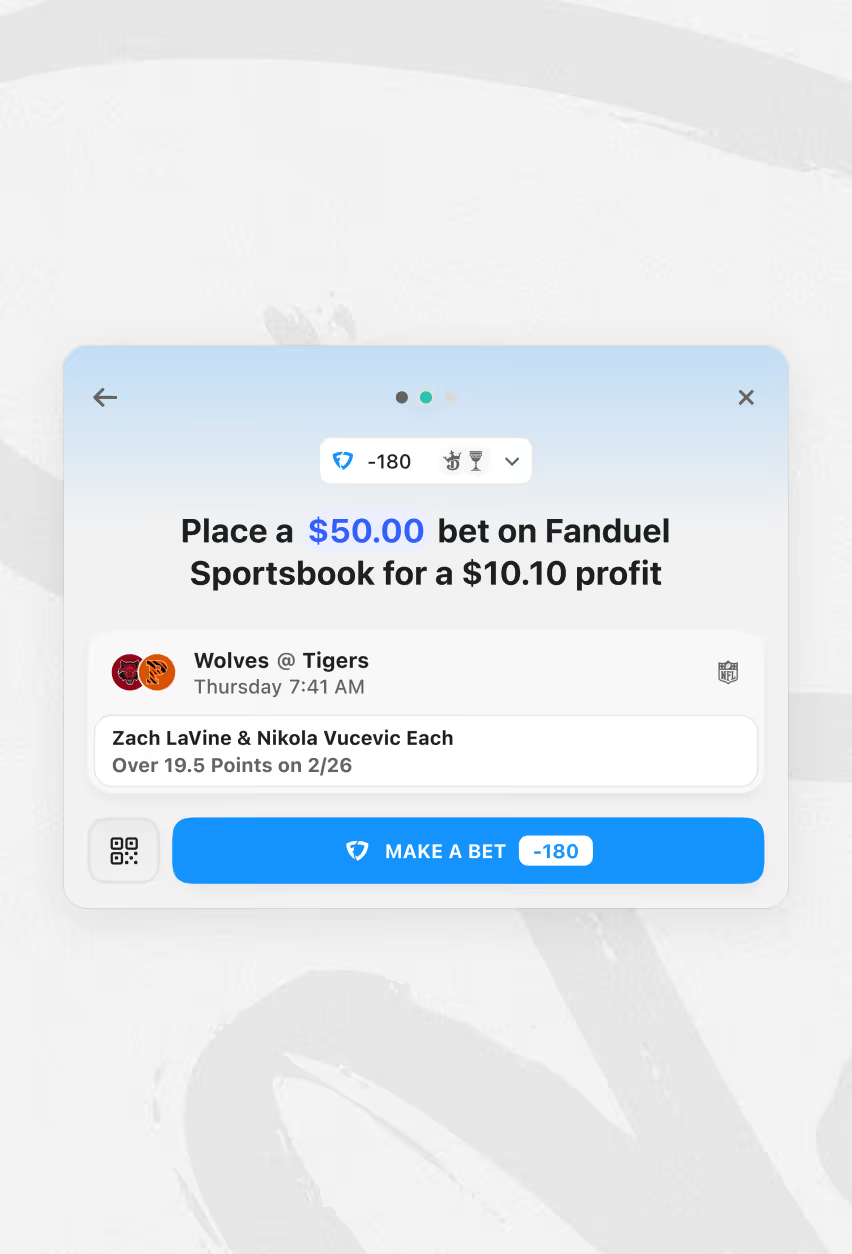
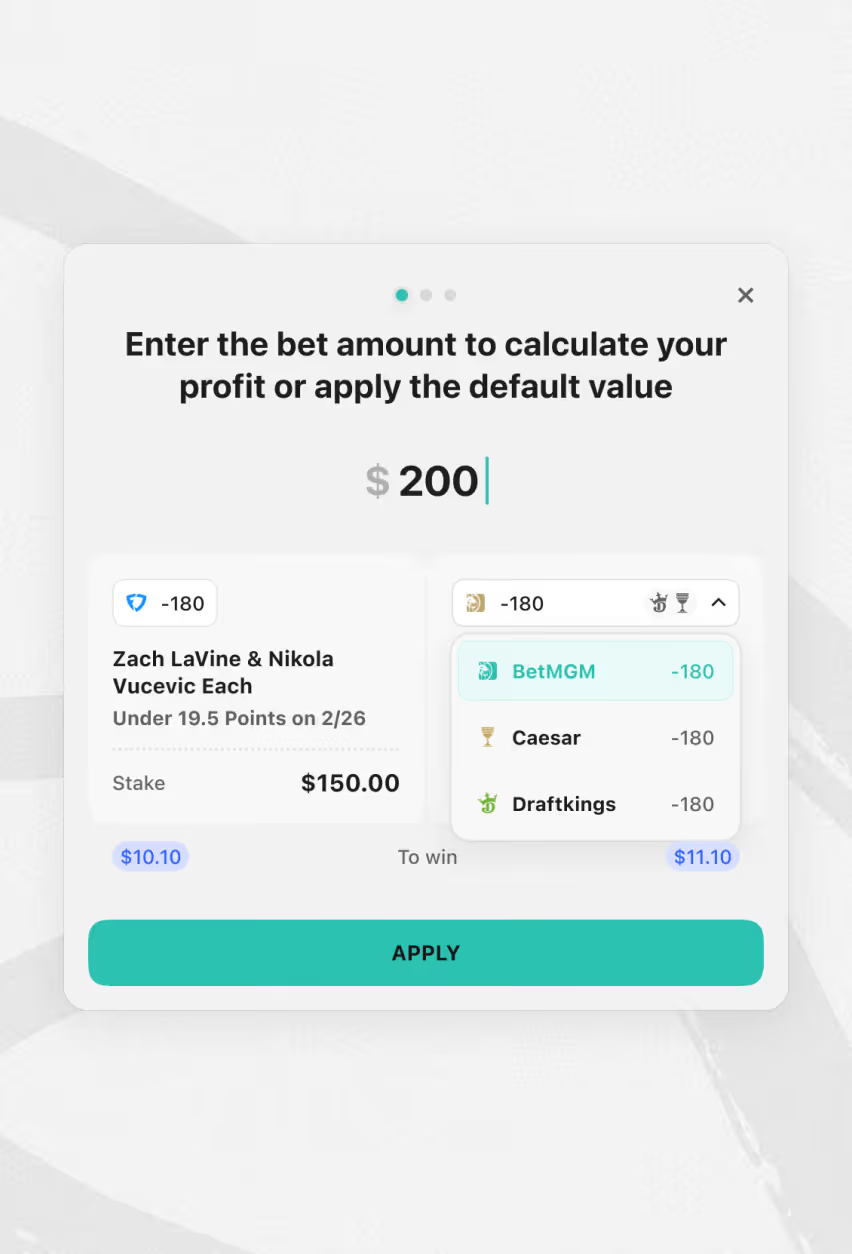
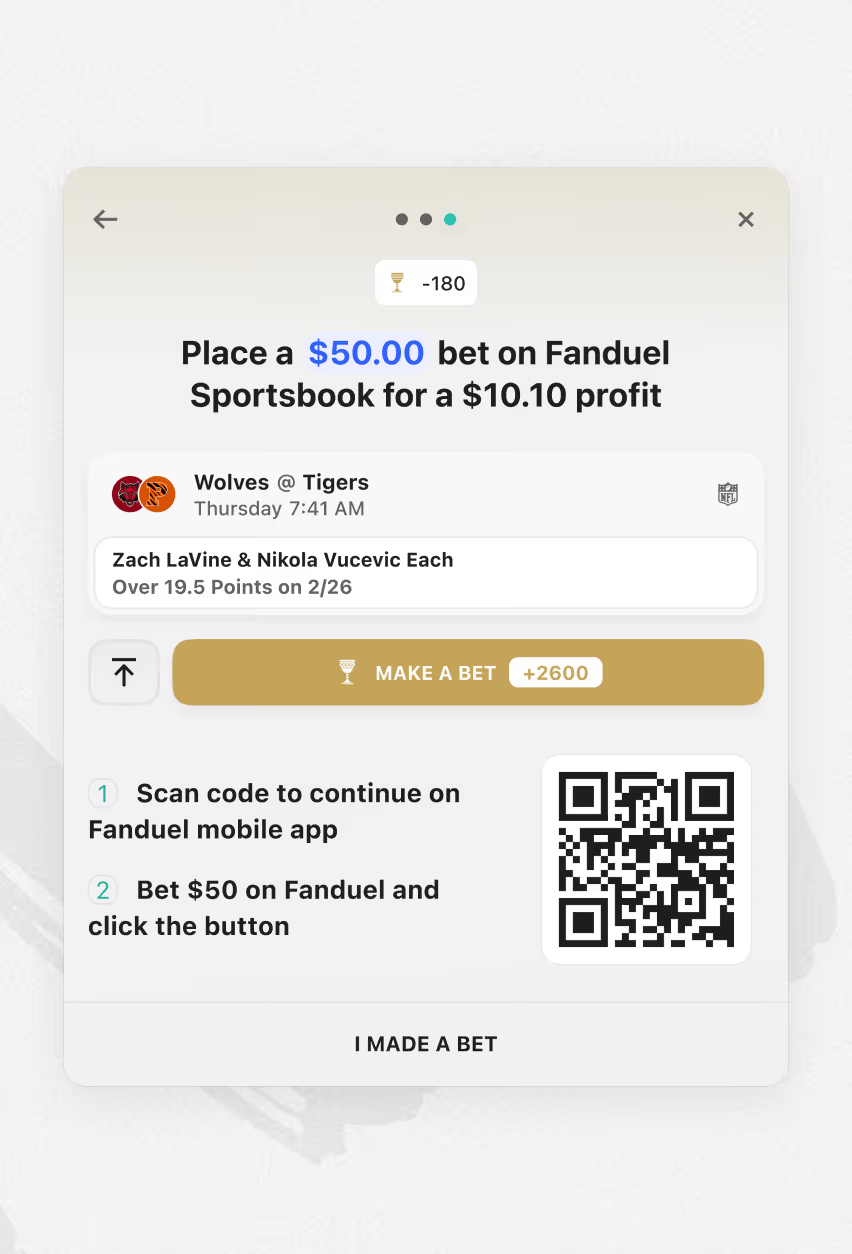
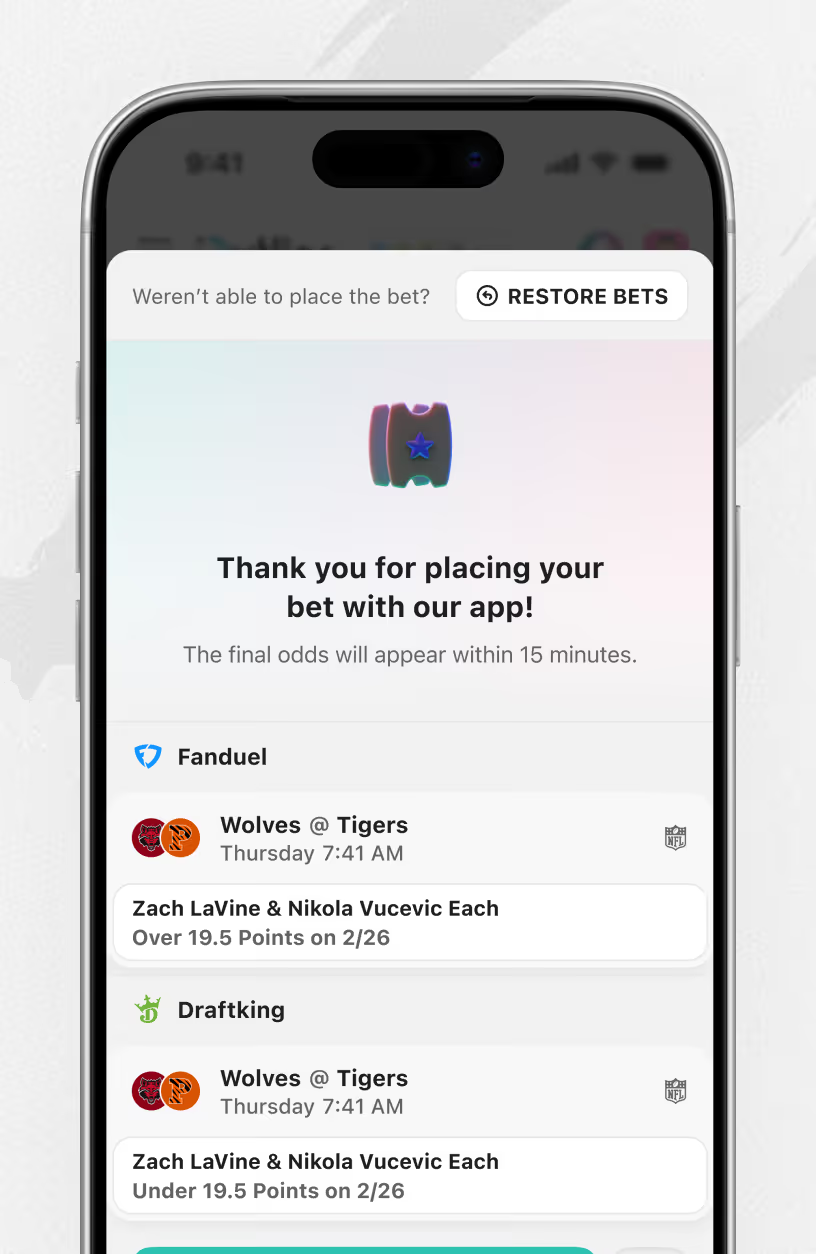
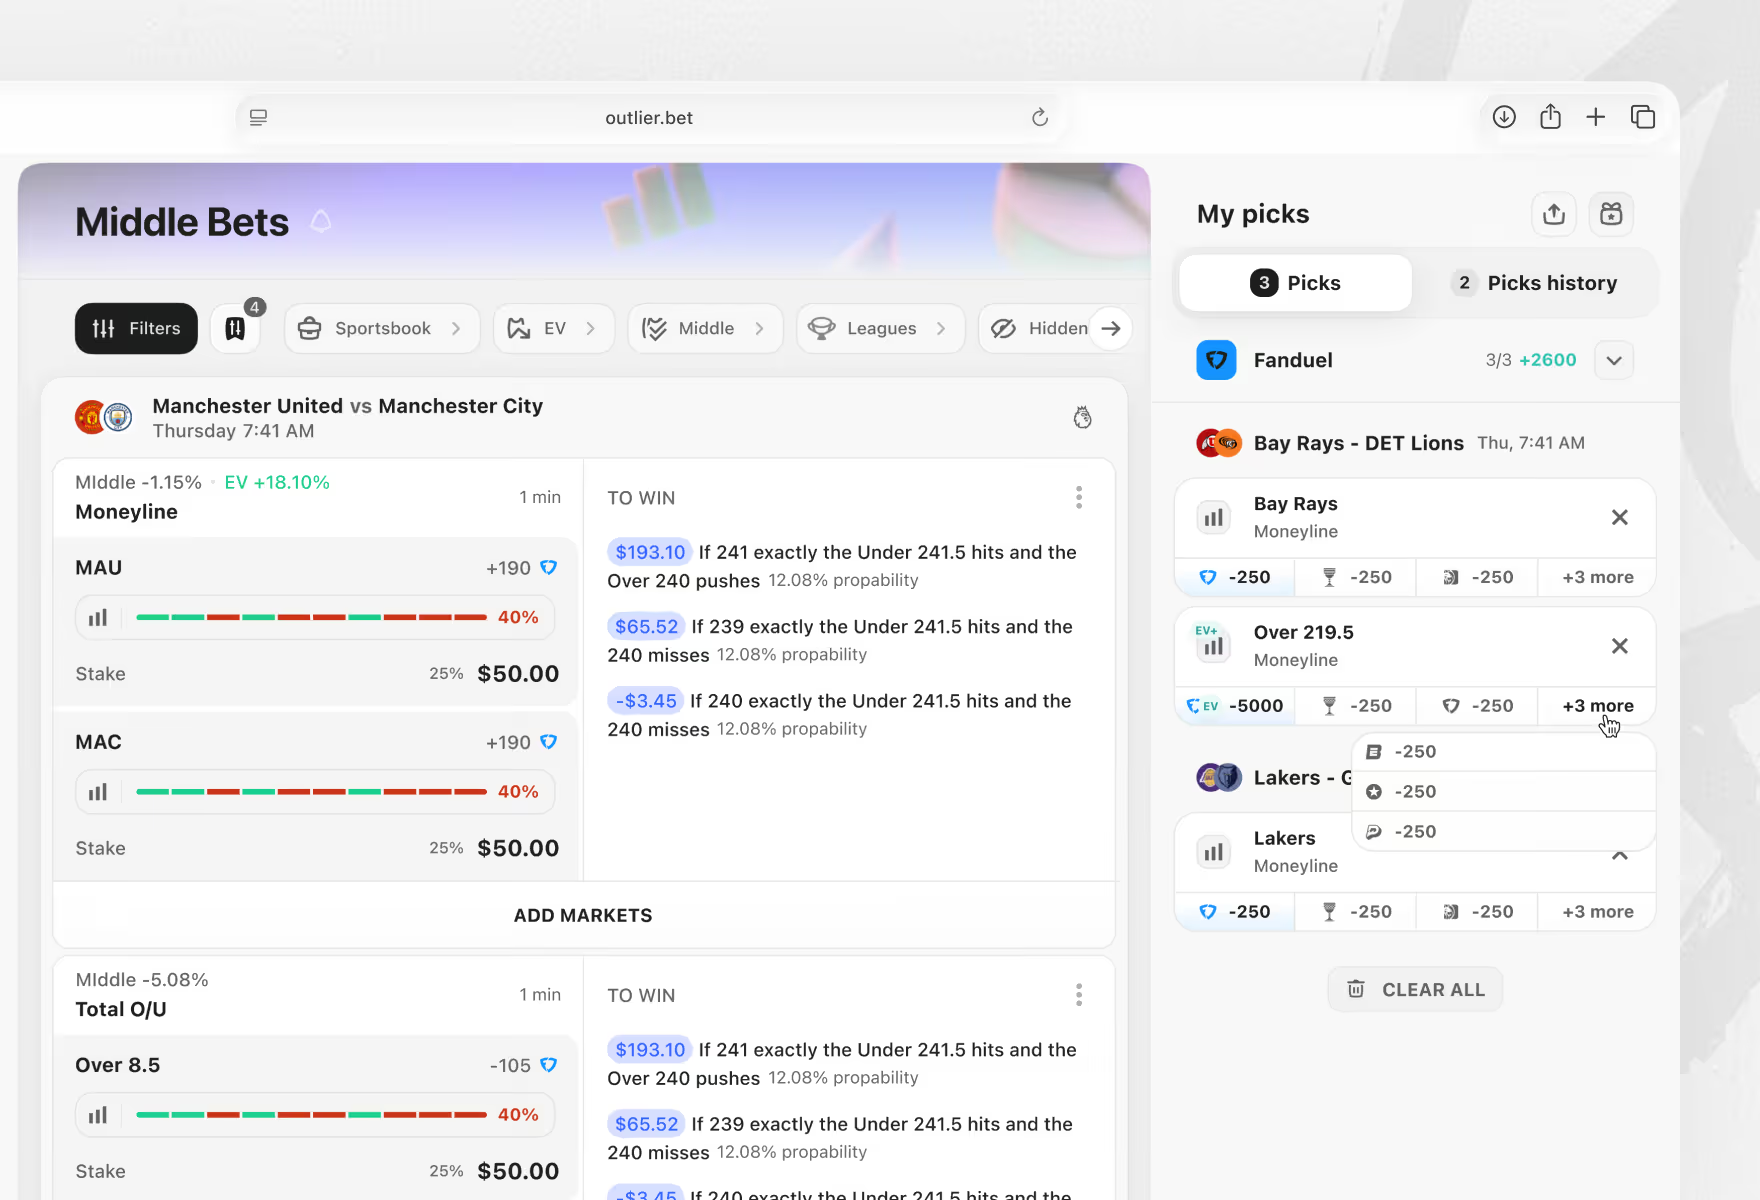
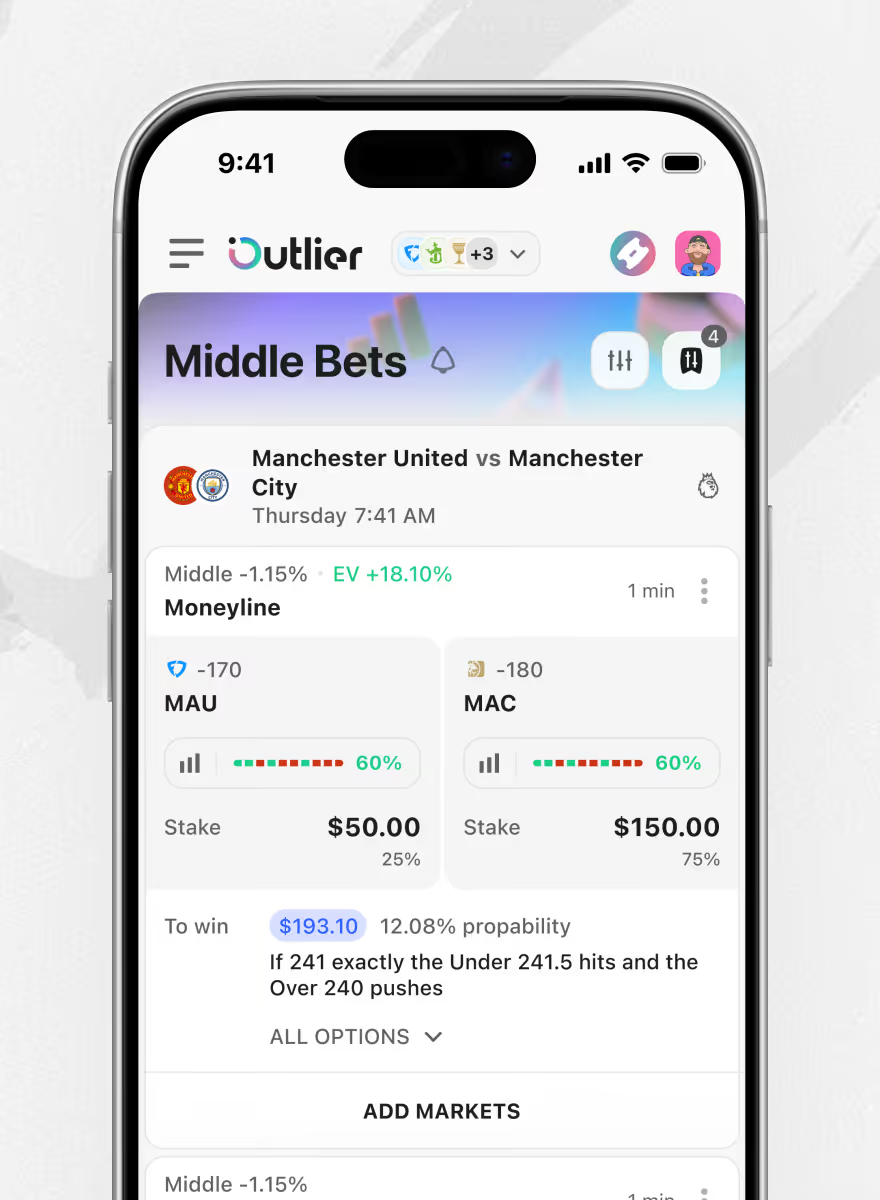
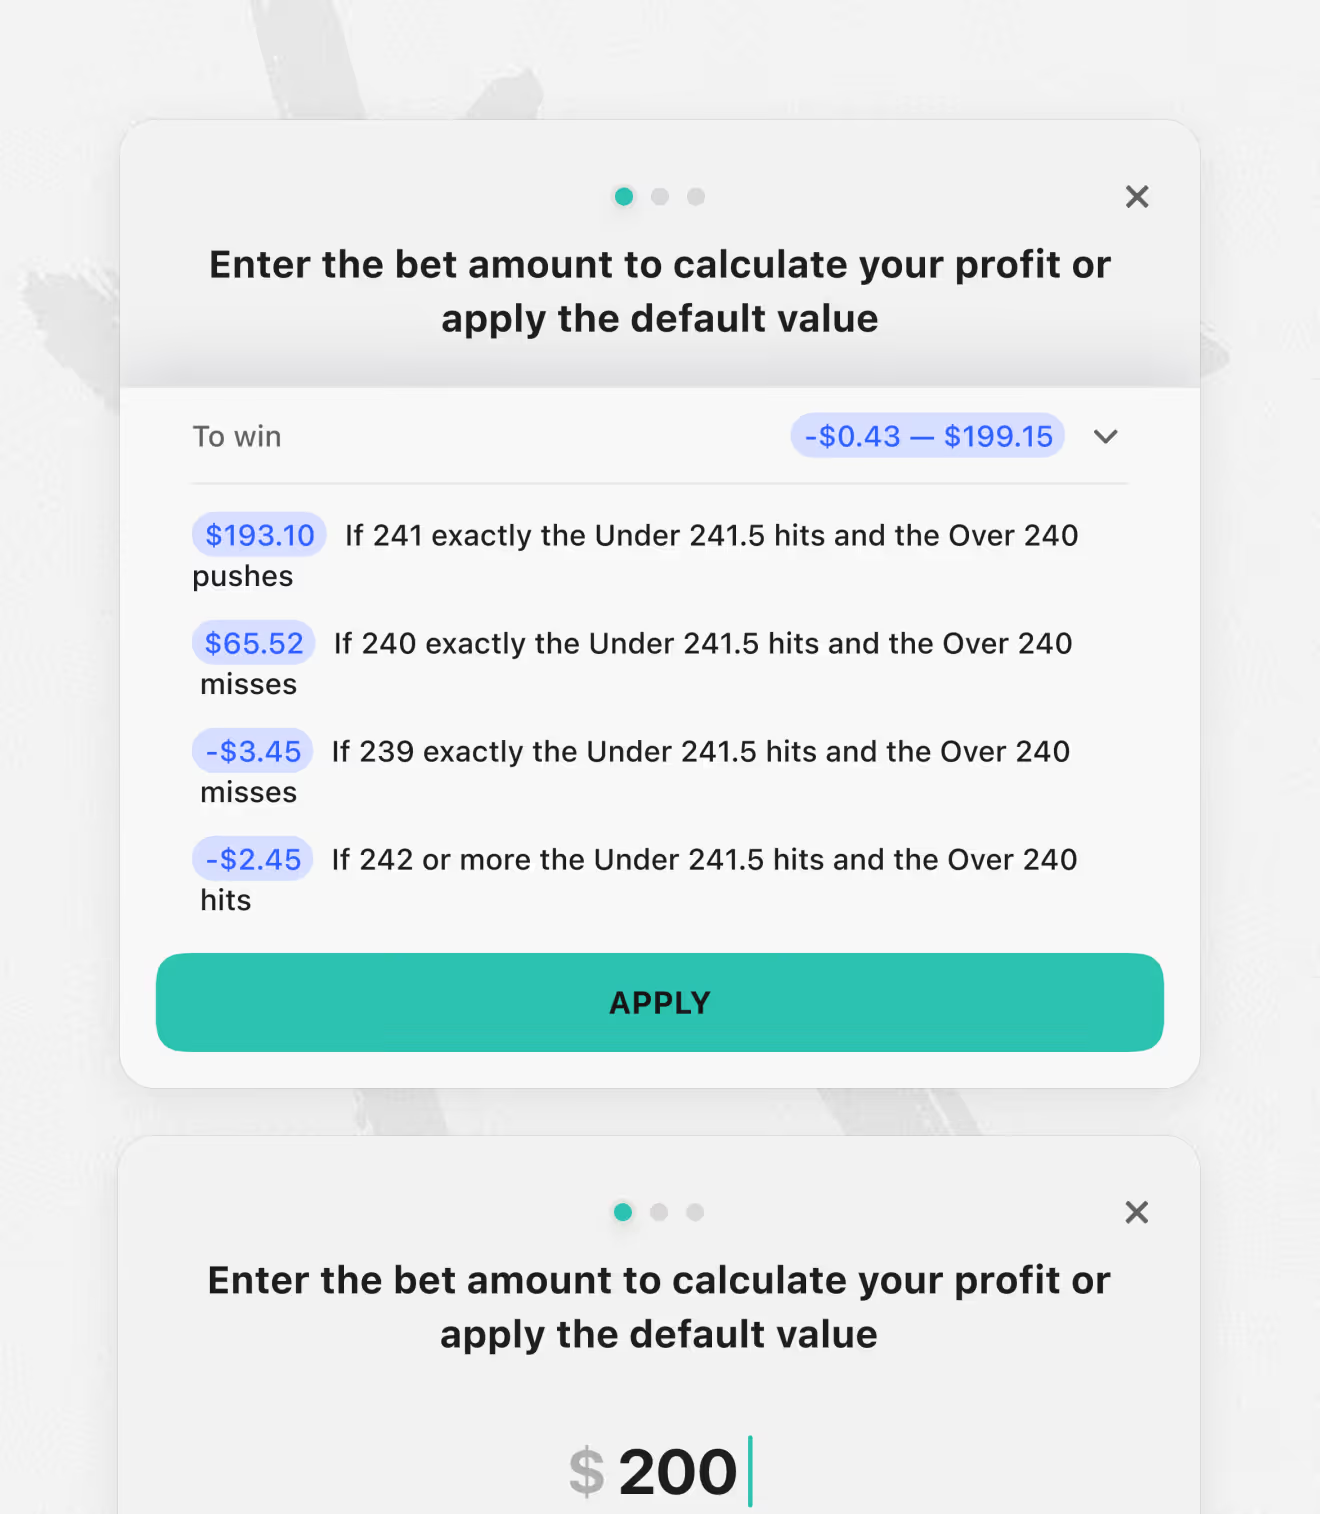
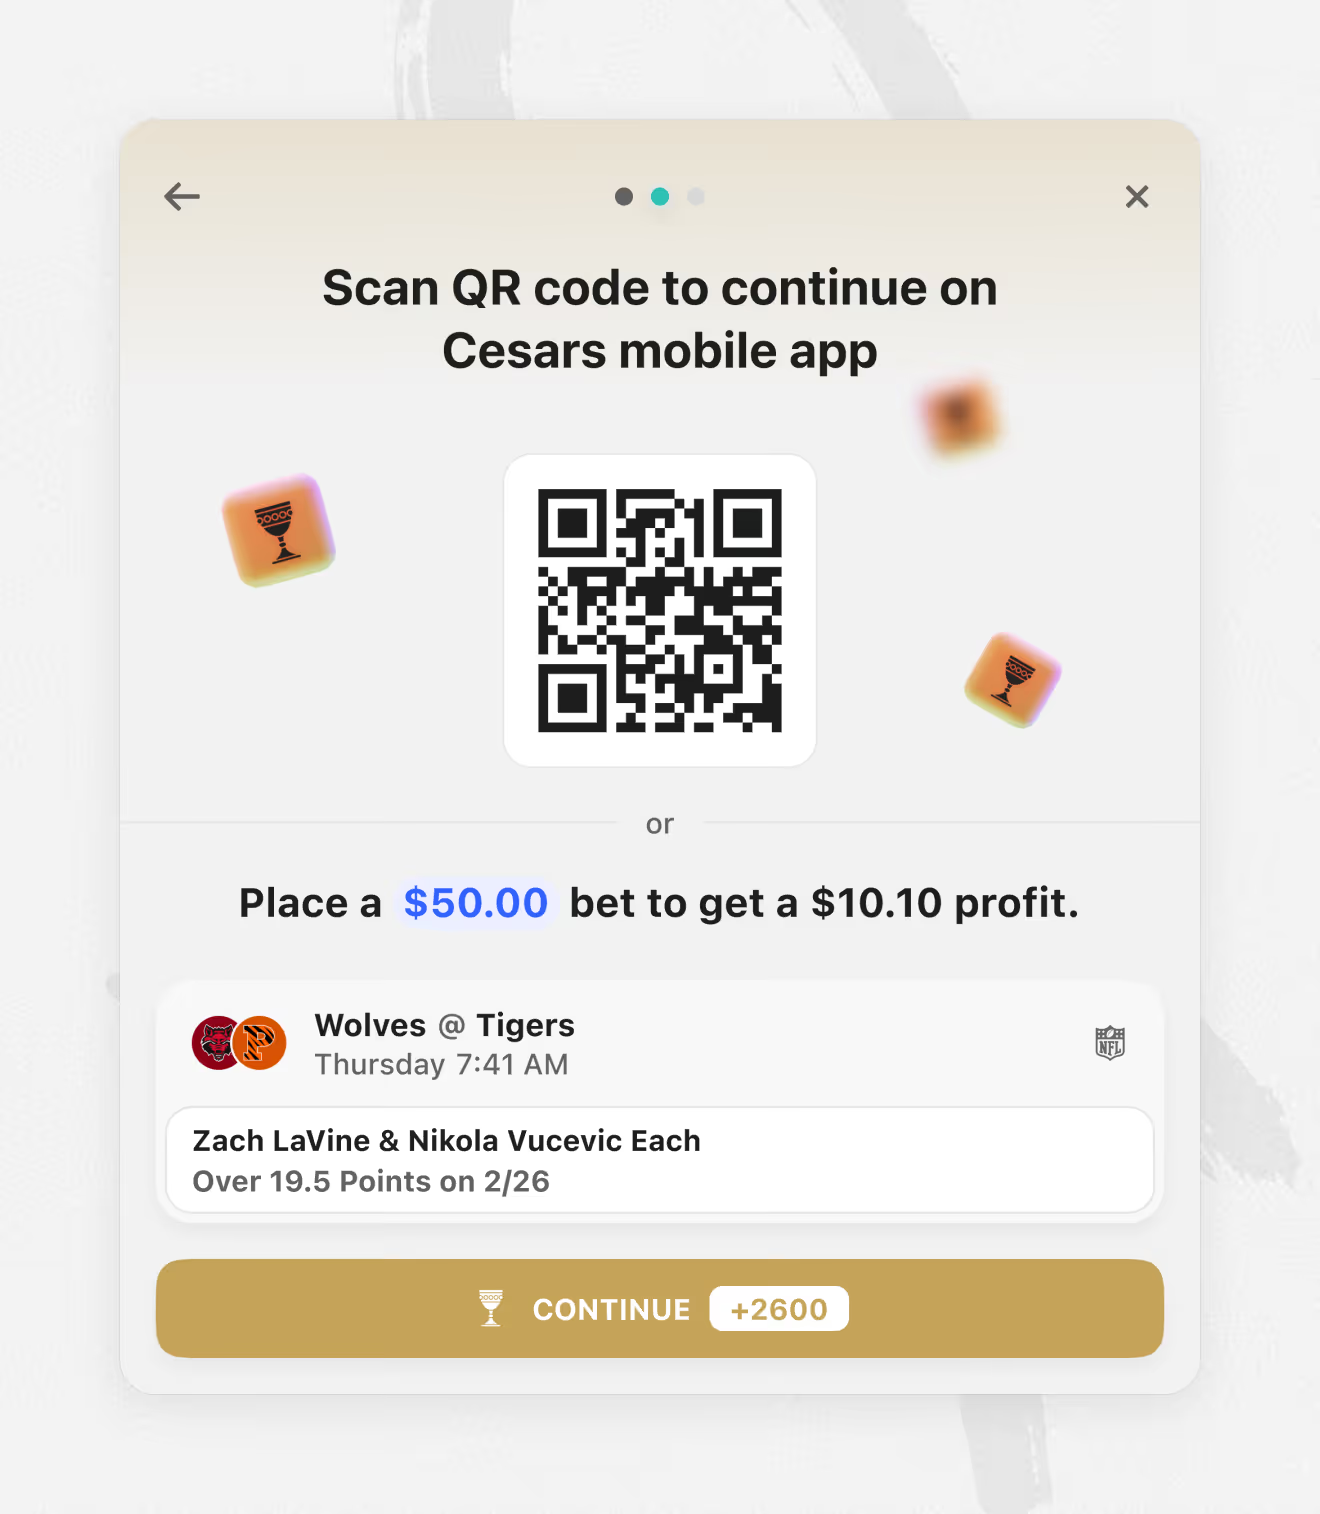
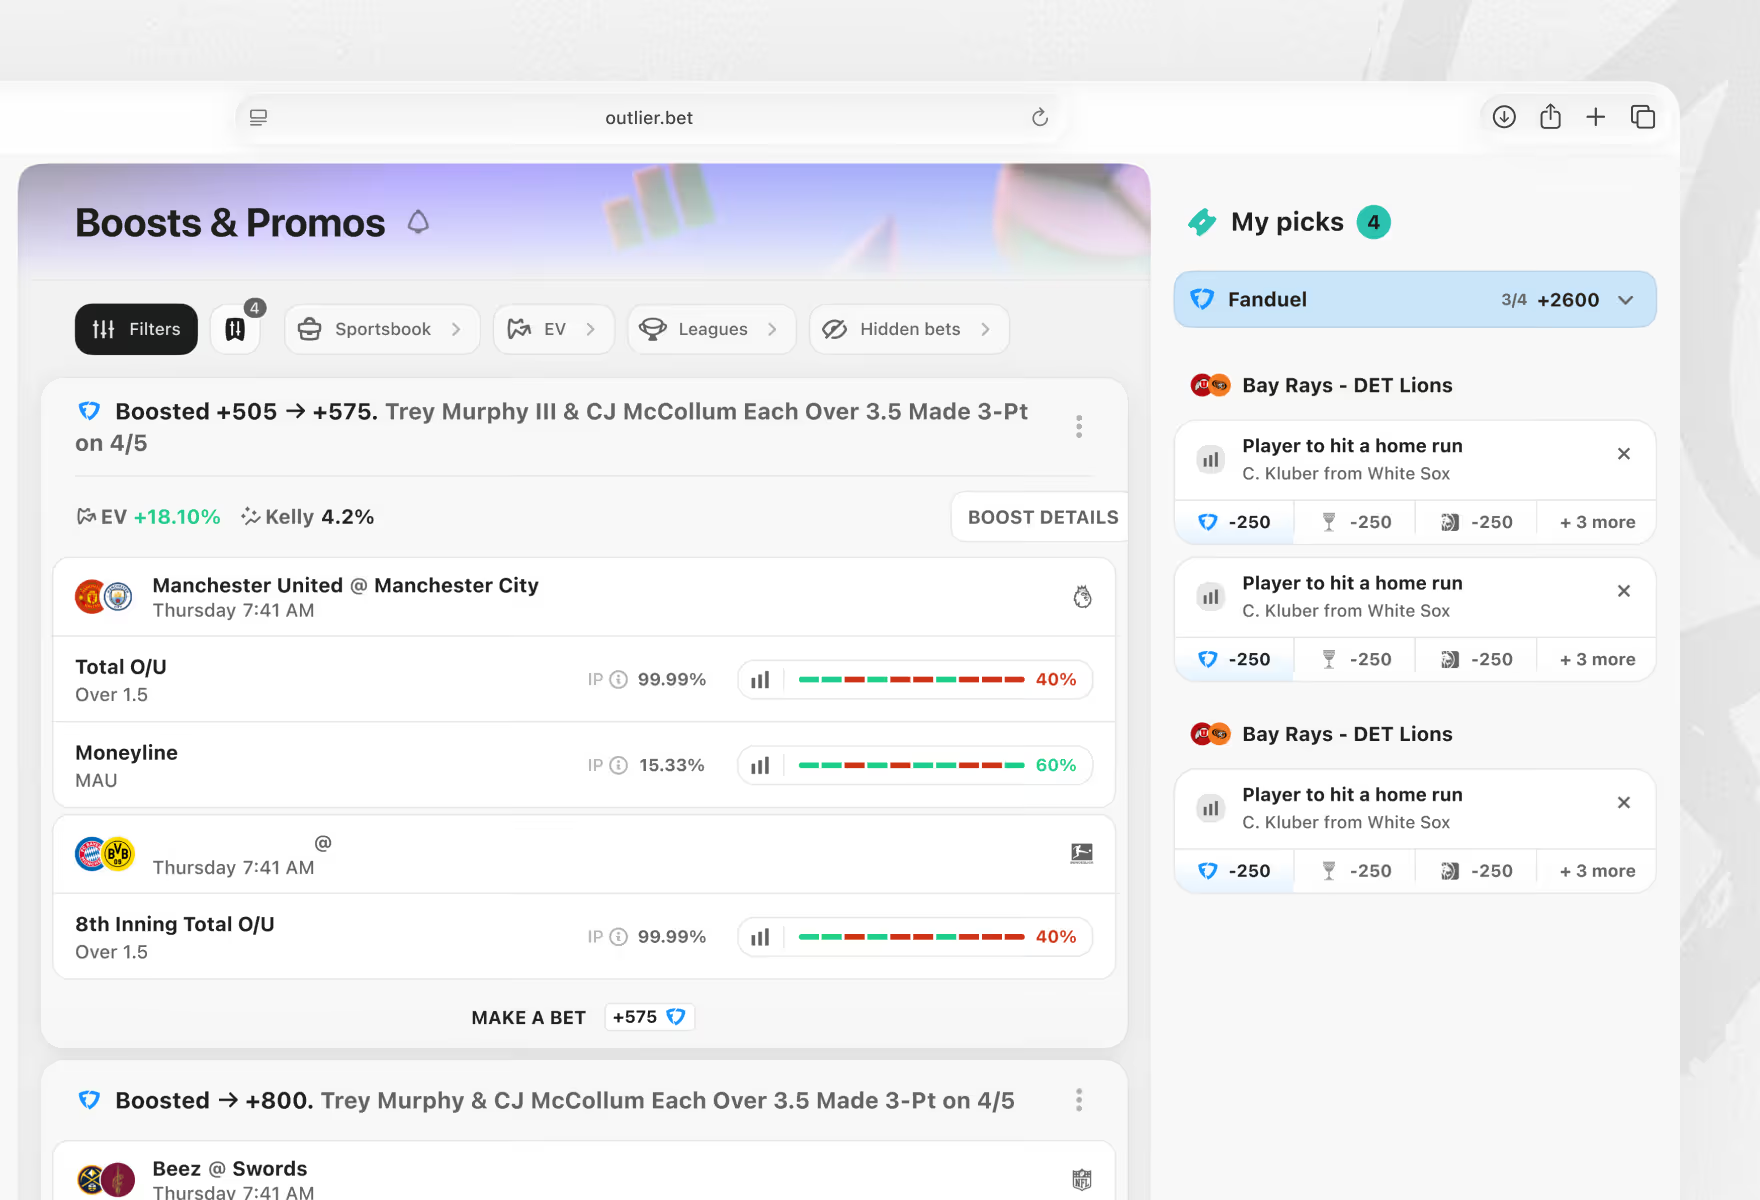
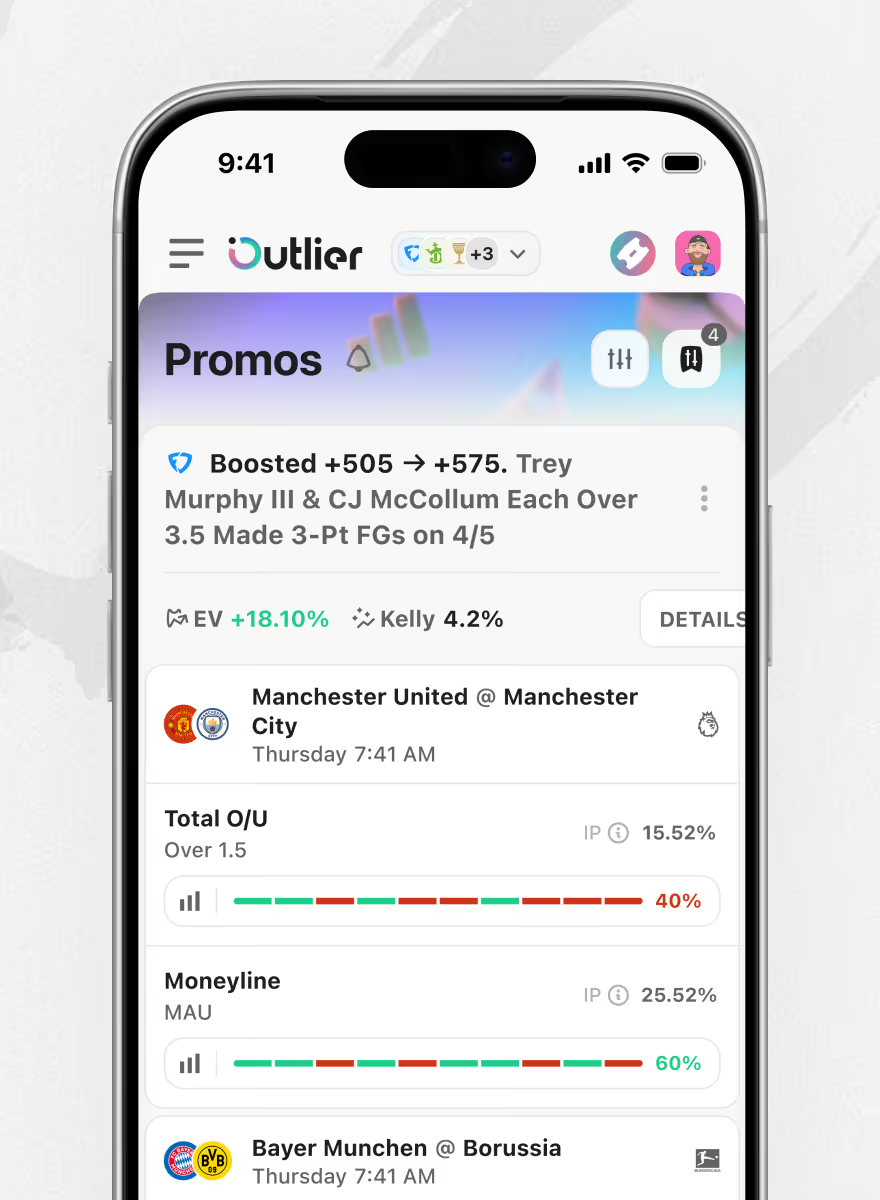
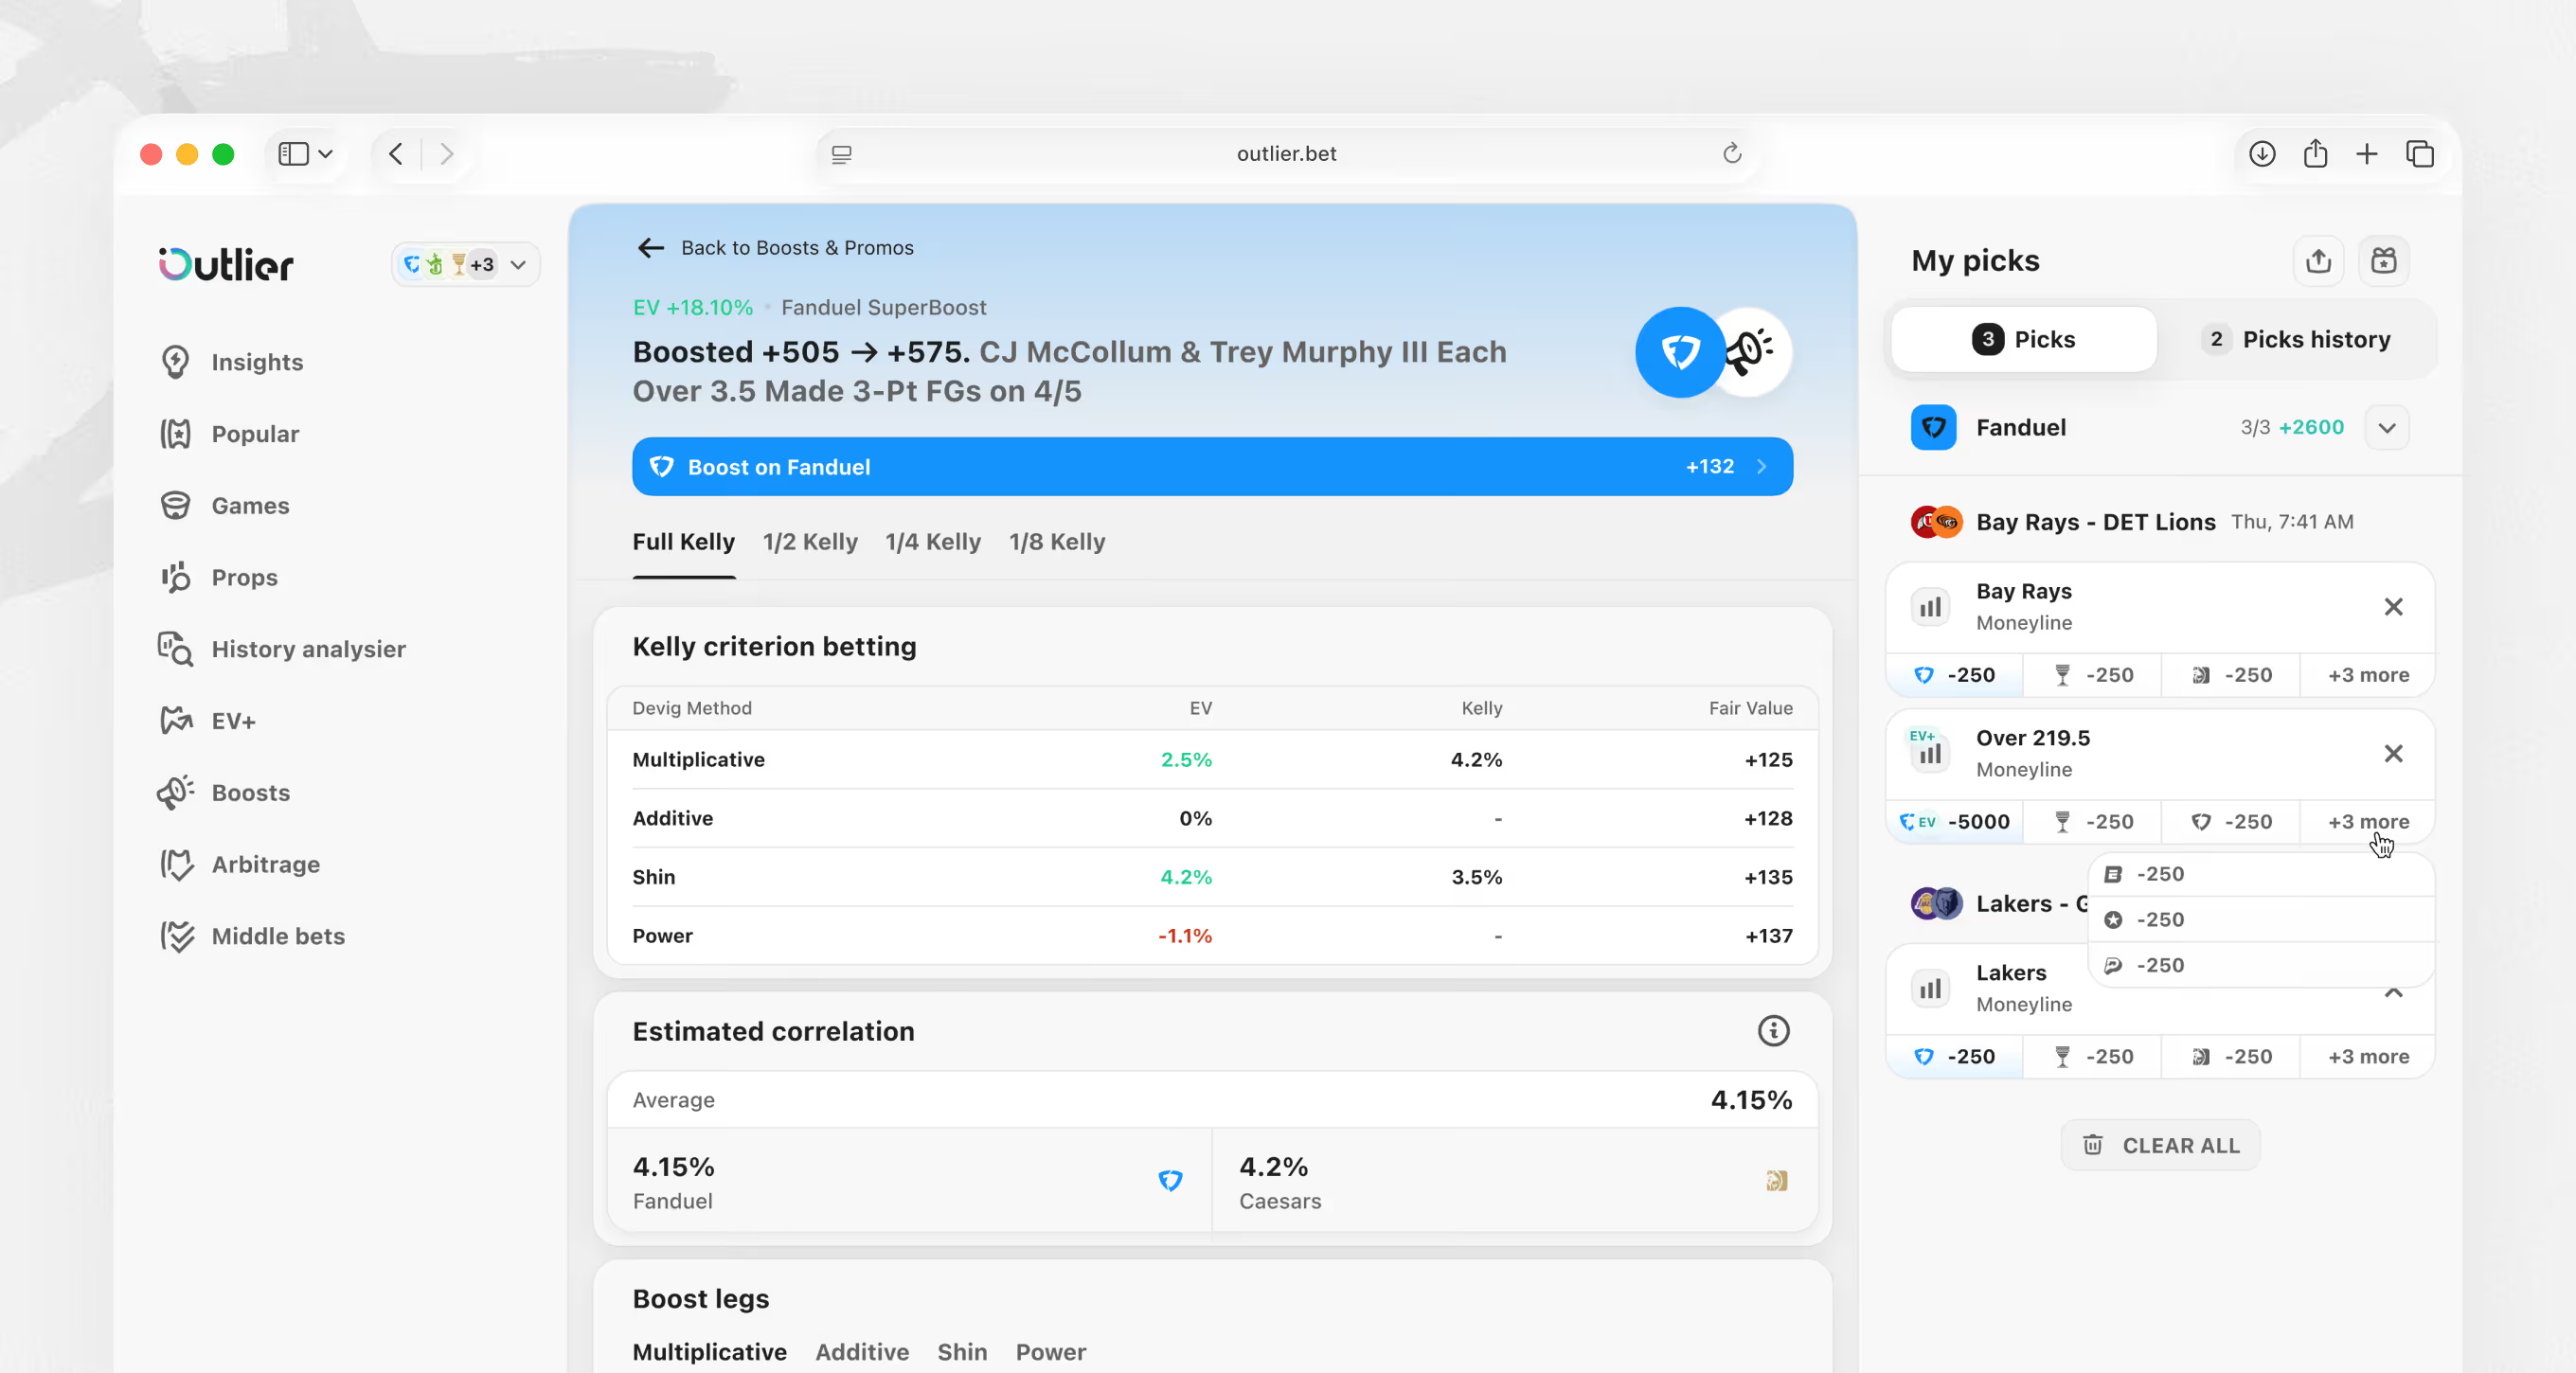
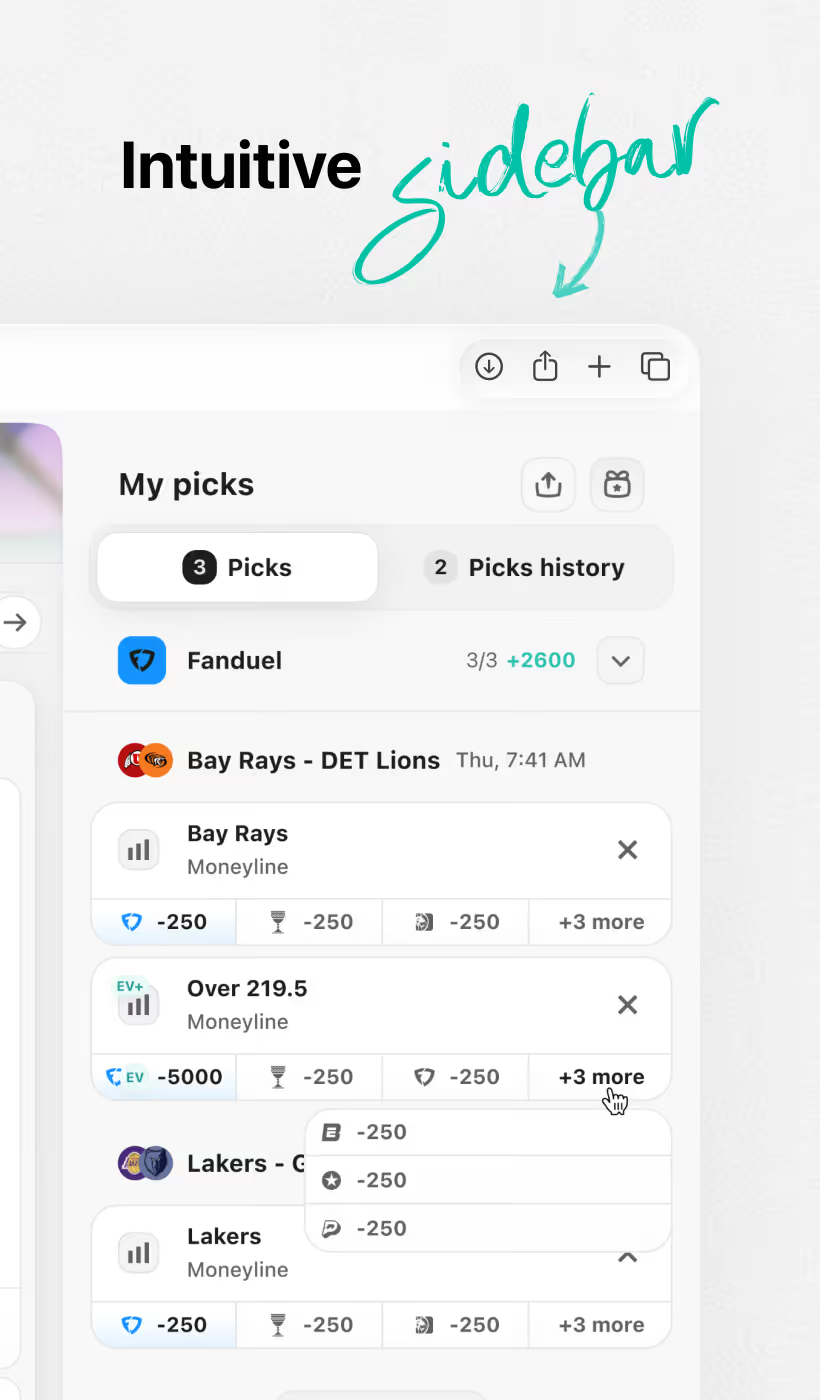
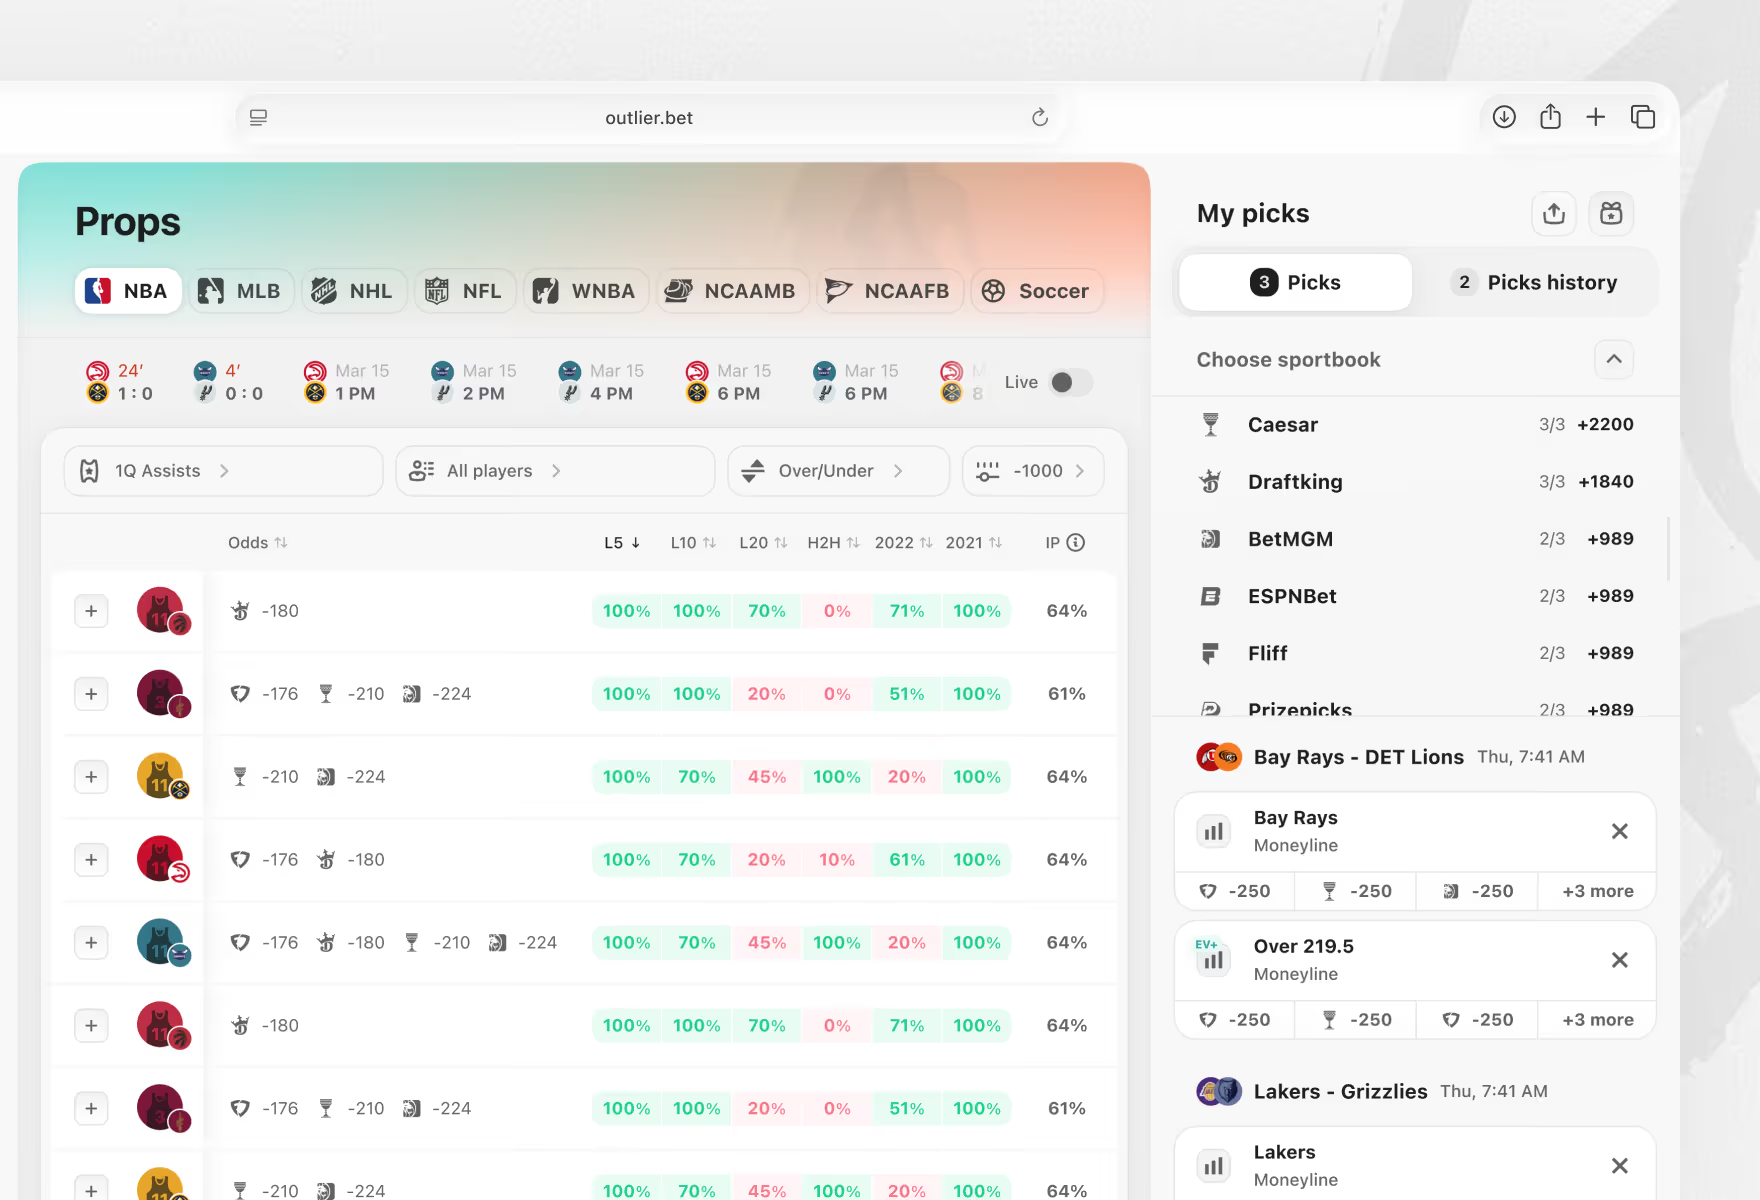
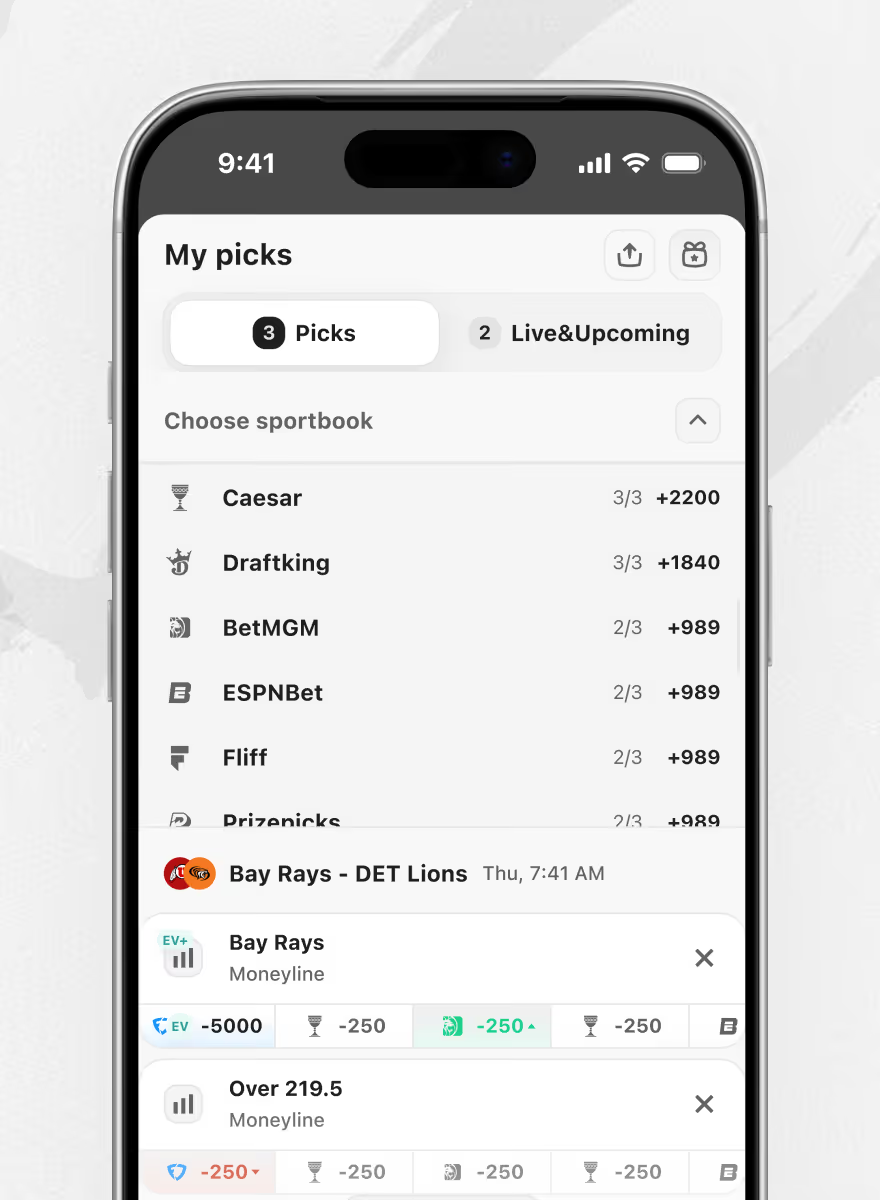
A running bet slip that tracks saved picks and compares payout across sportsbooks. Picks and Picks History sit in separate tabs, with a sportsbook dropdown ranking payout.
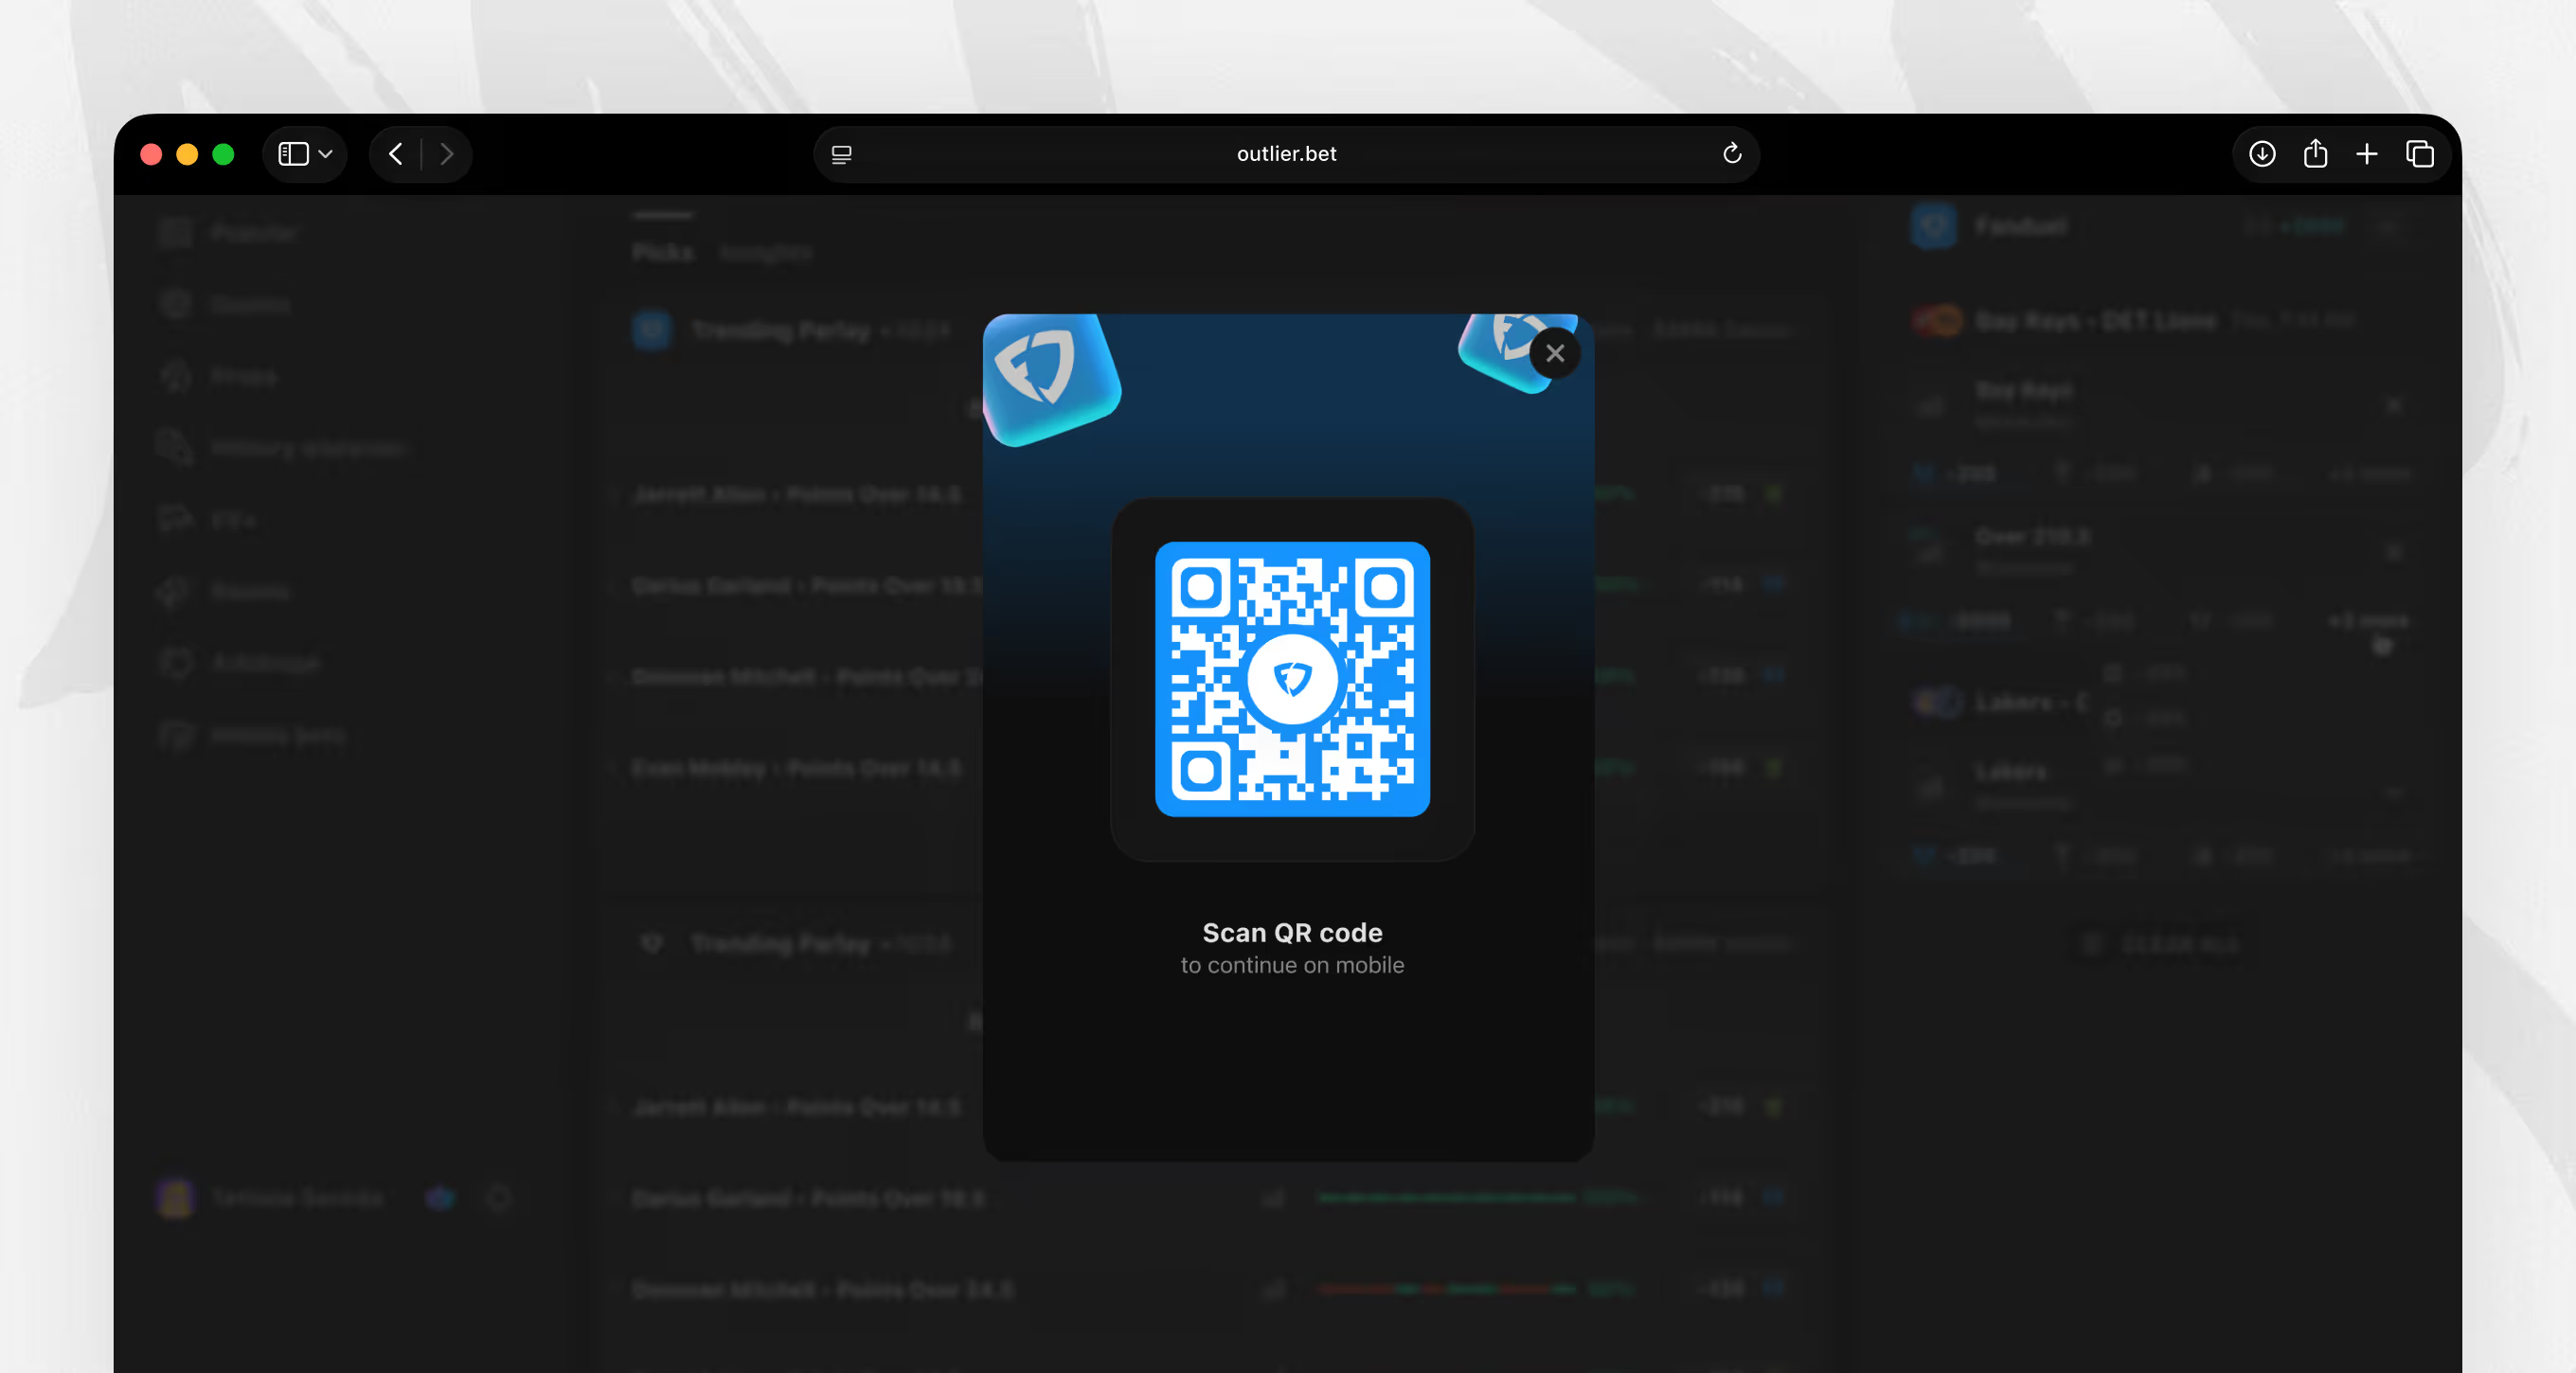
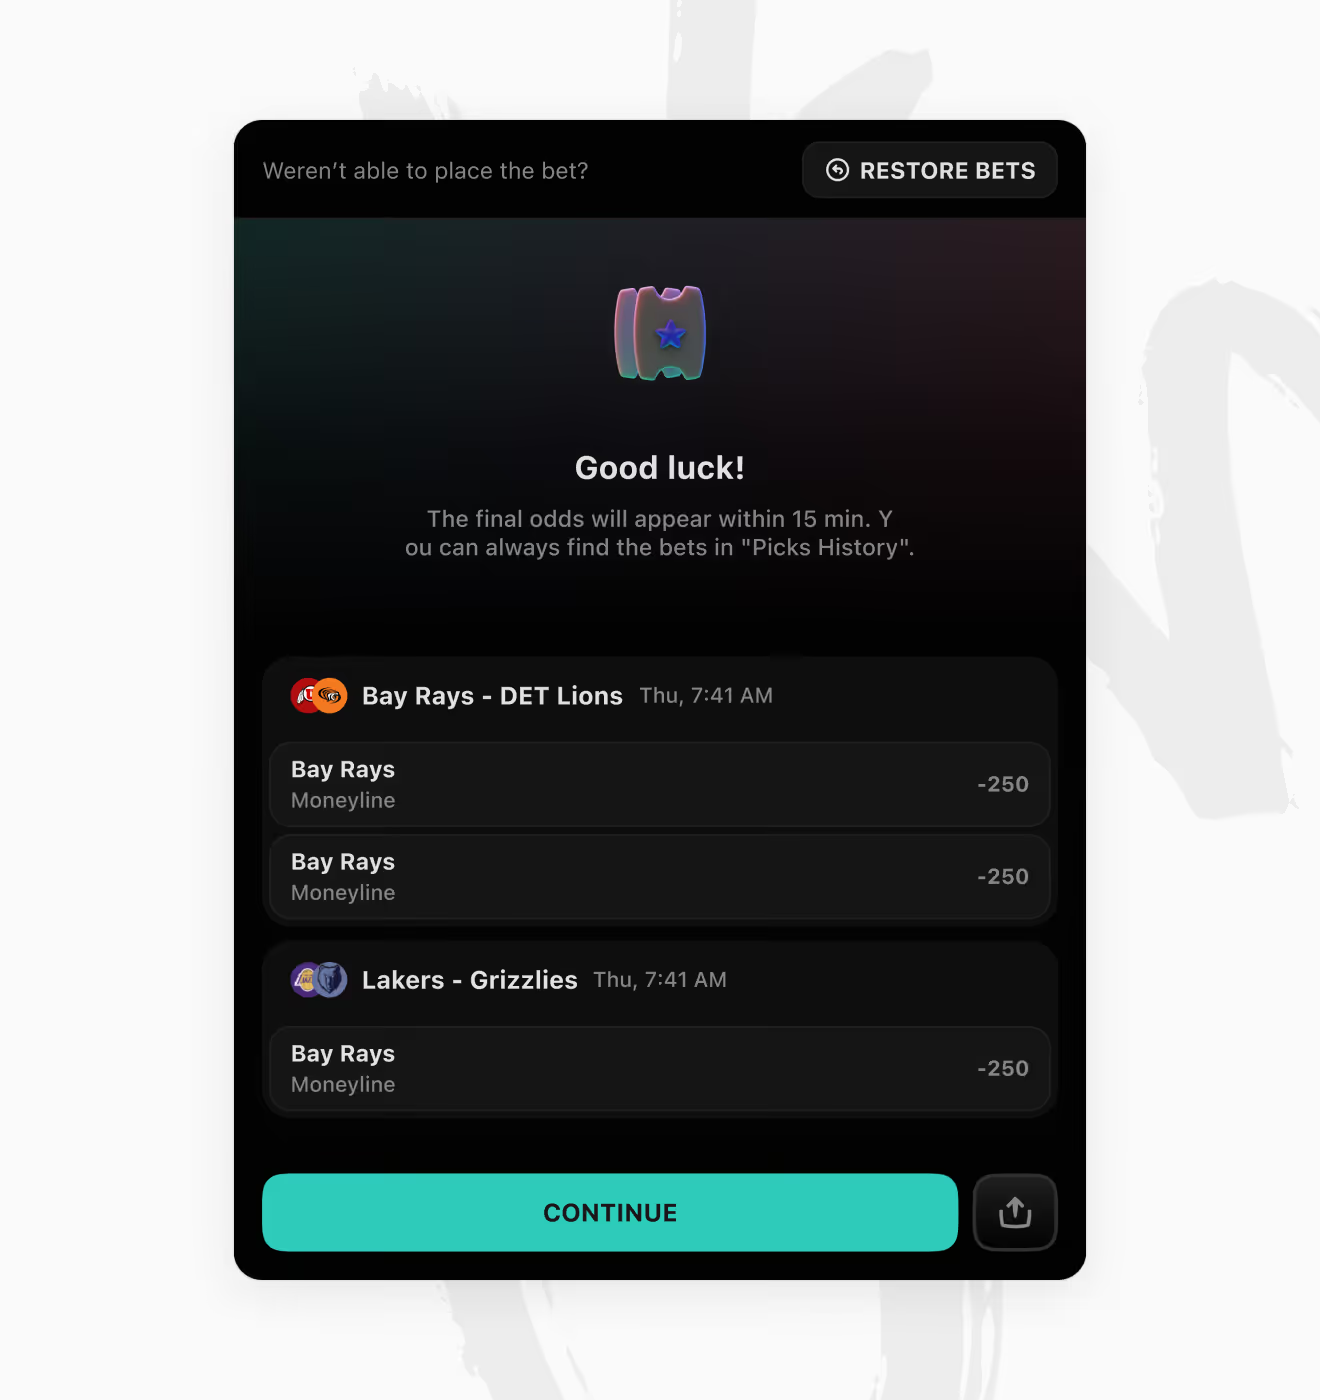
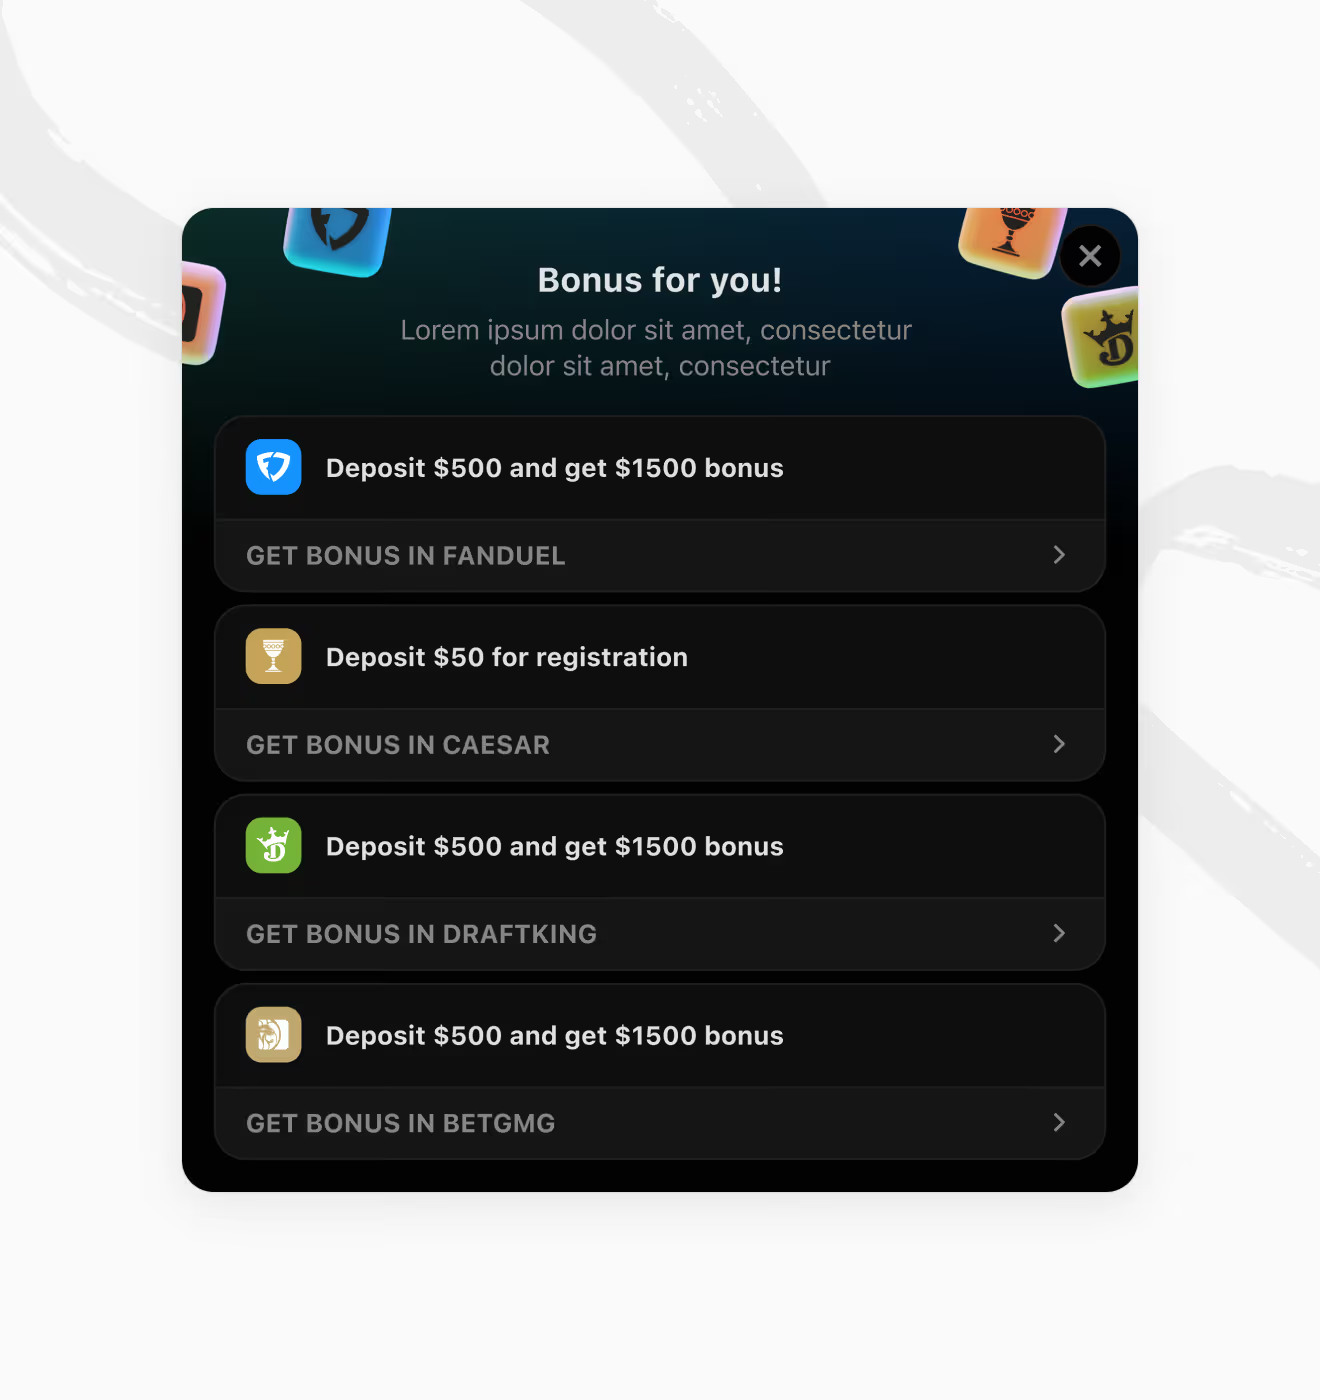
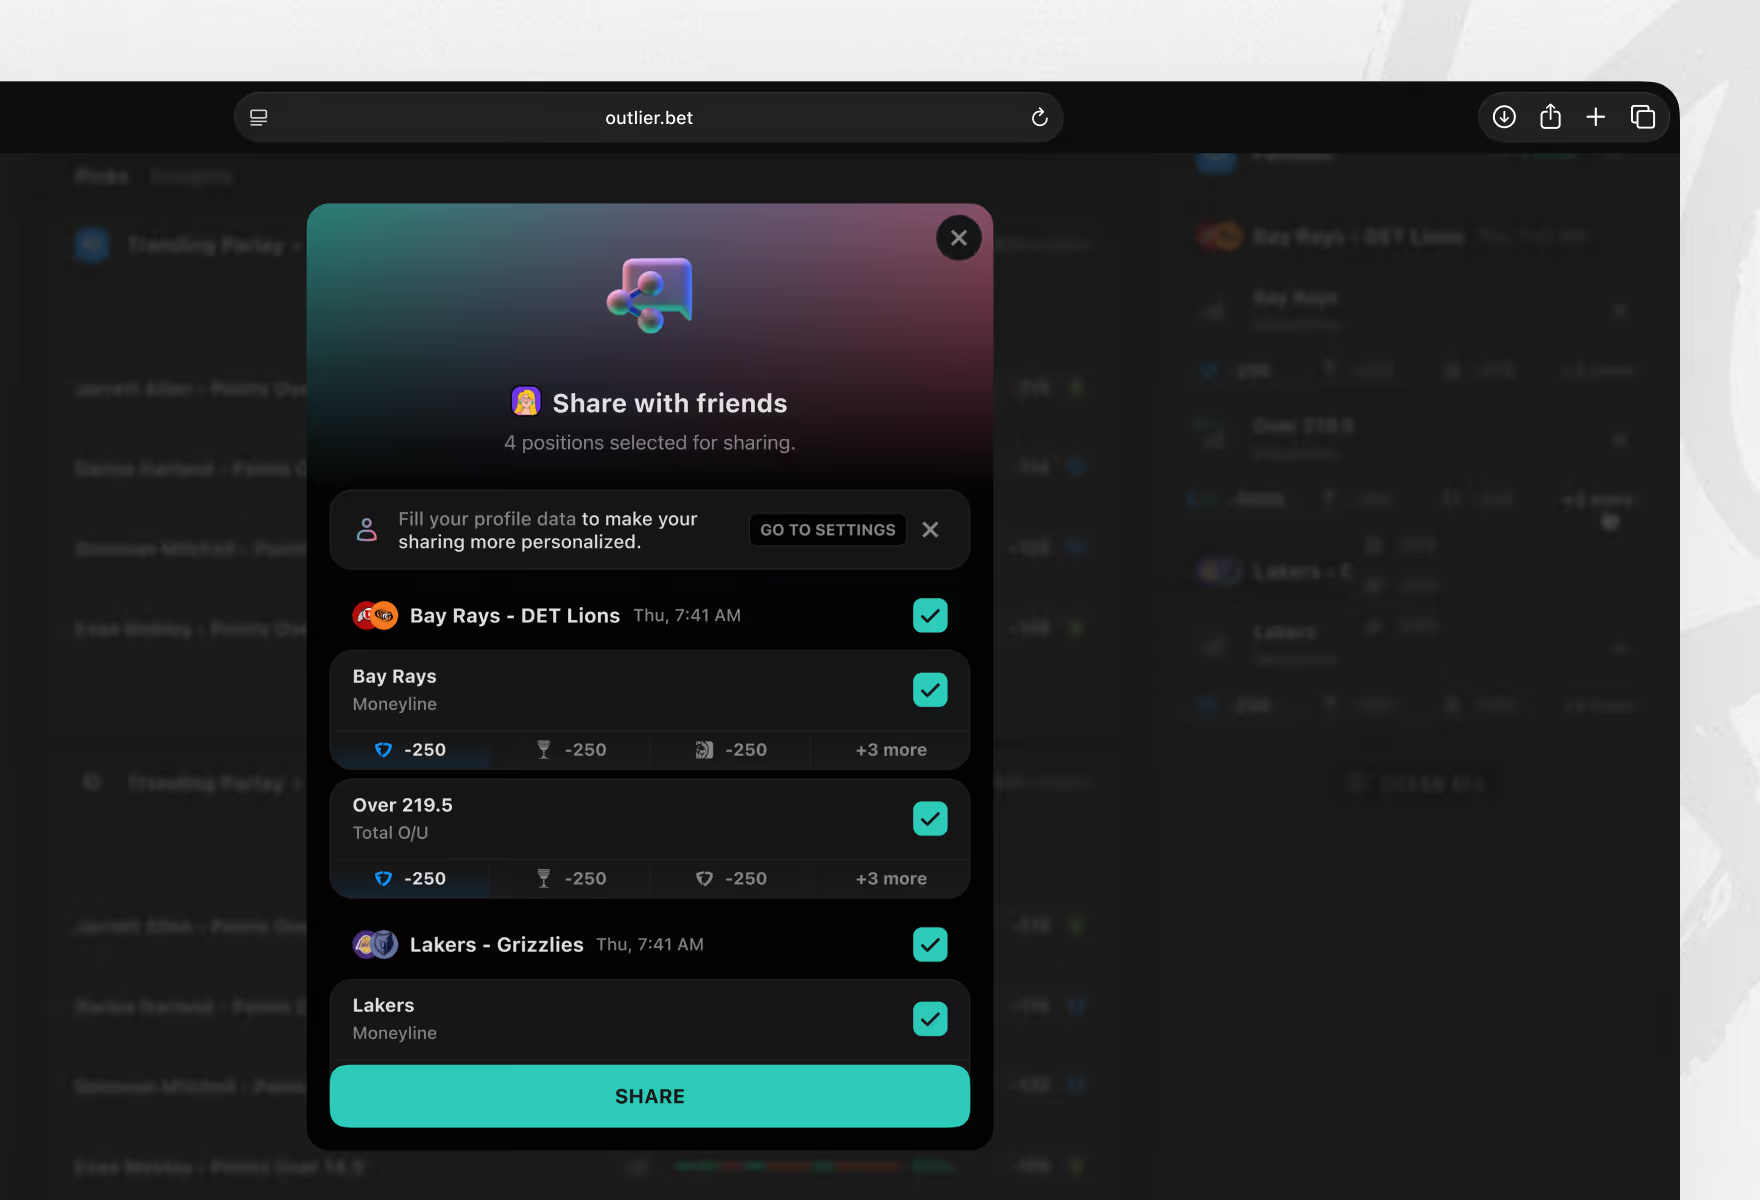
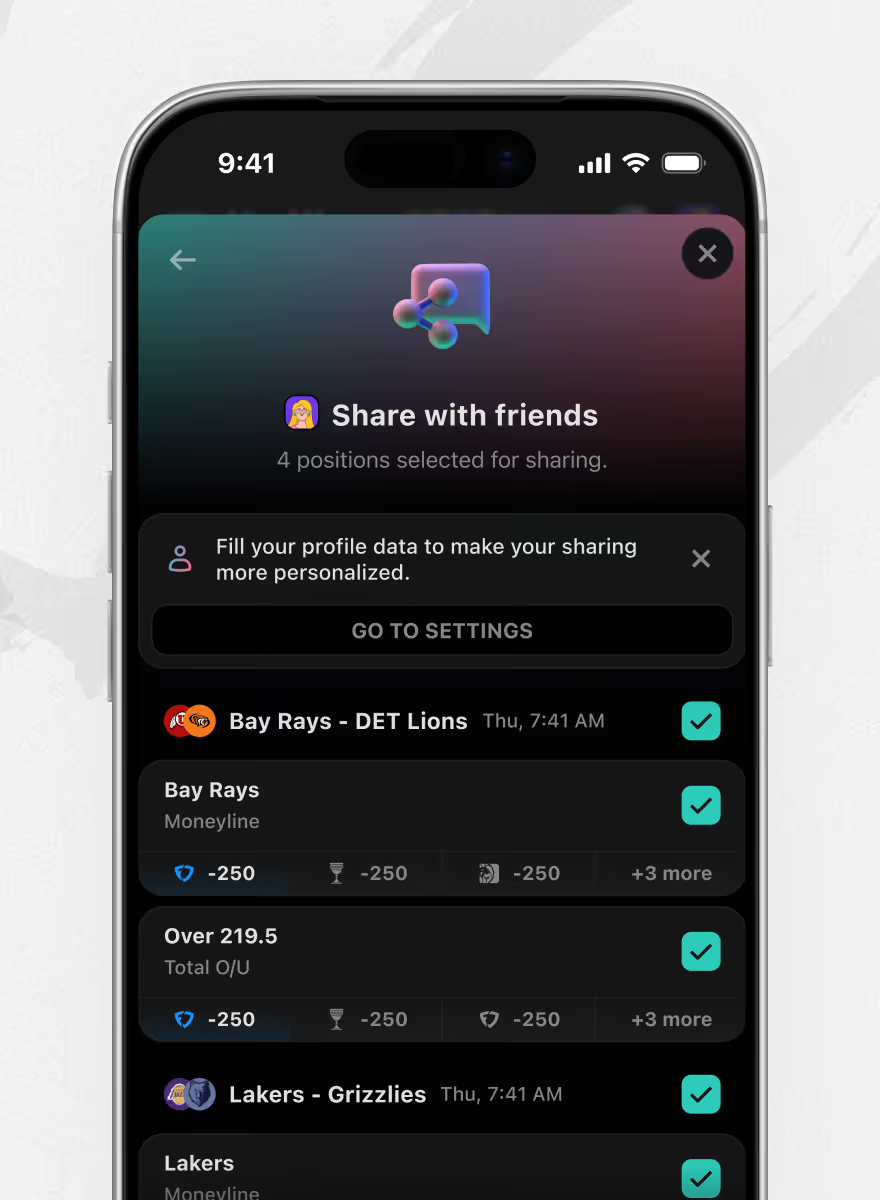
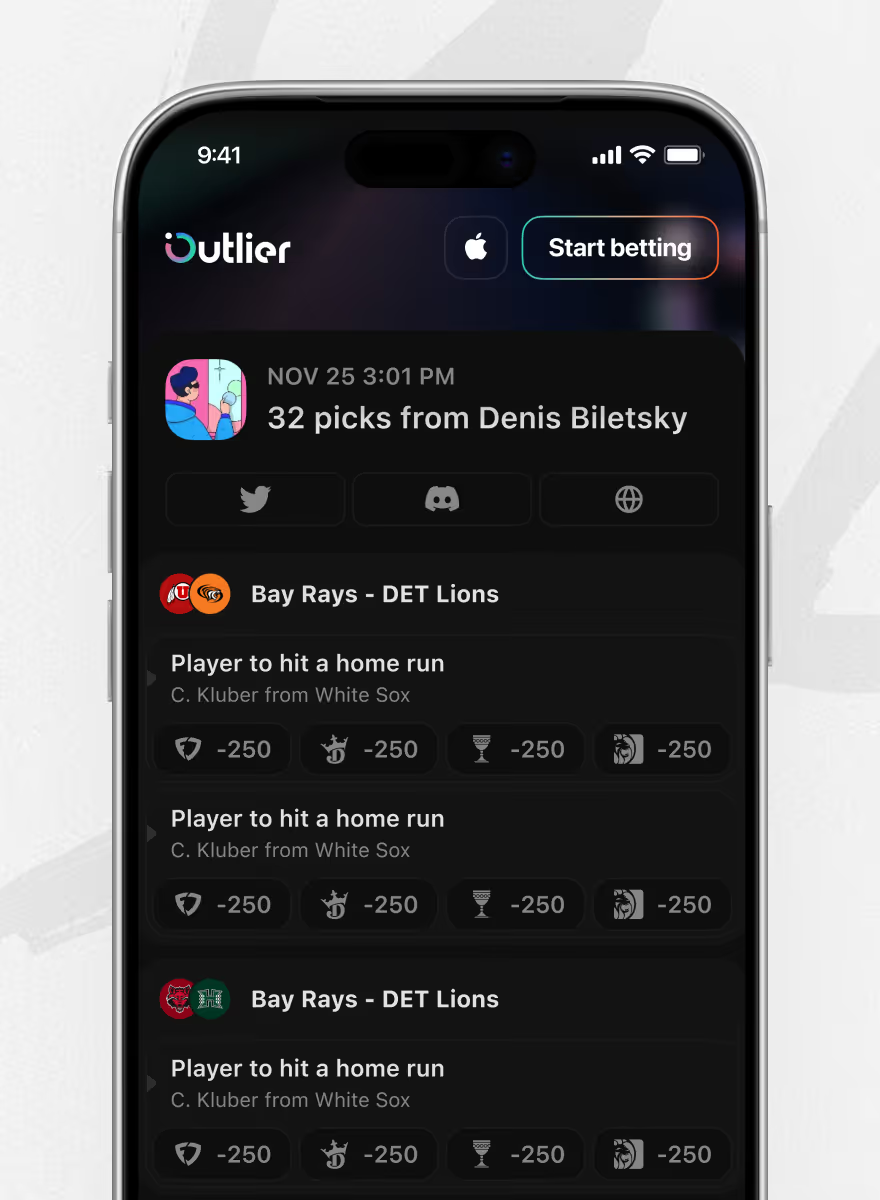
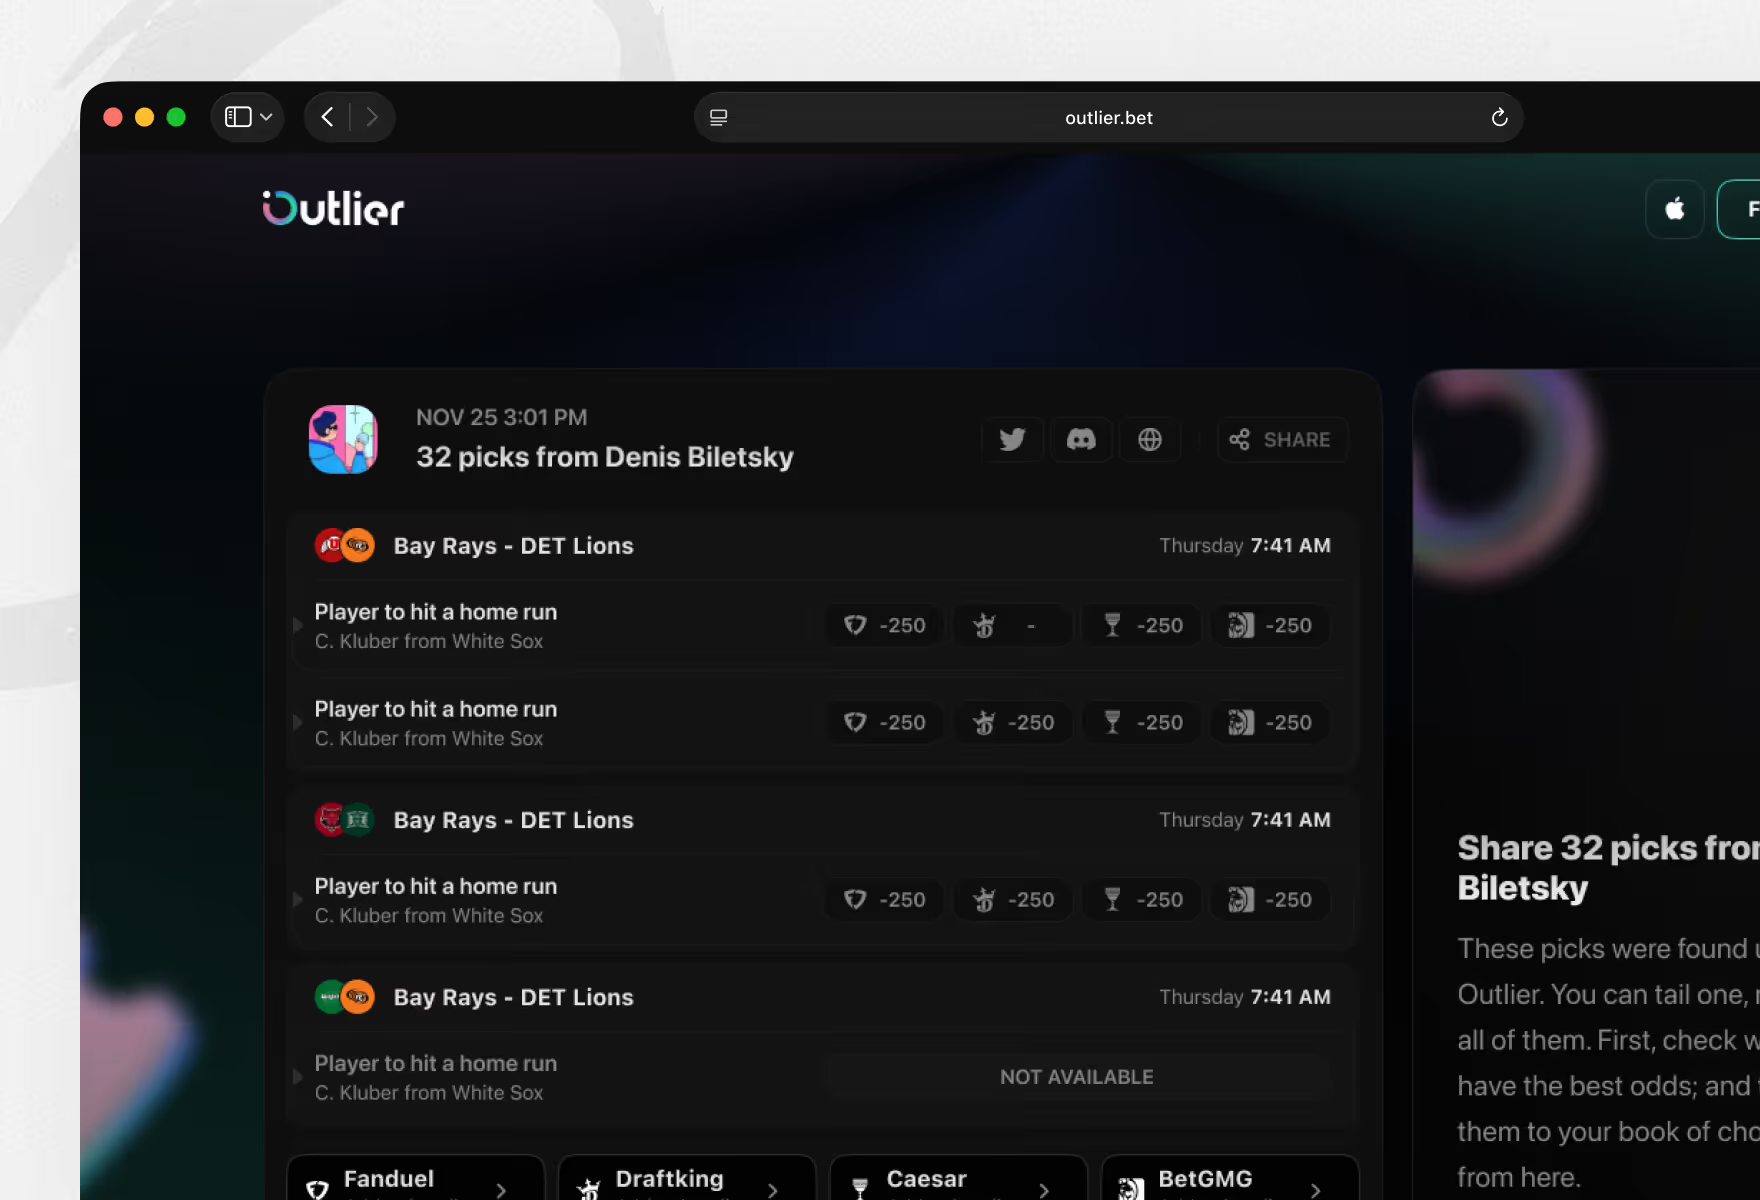
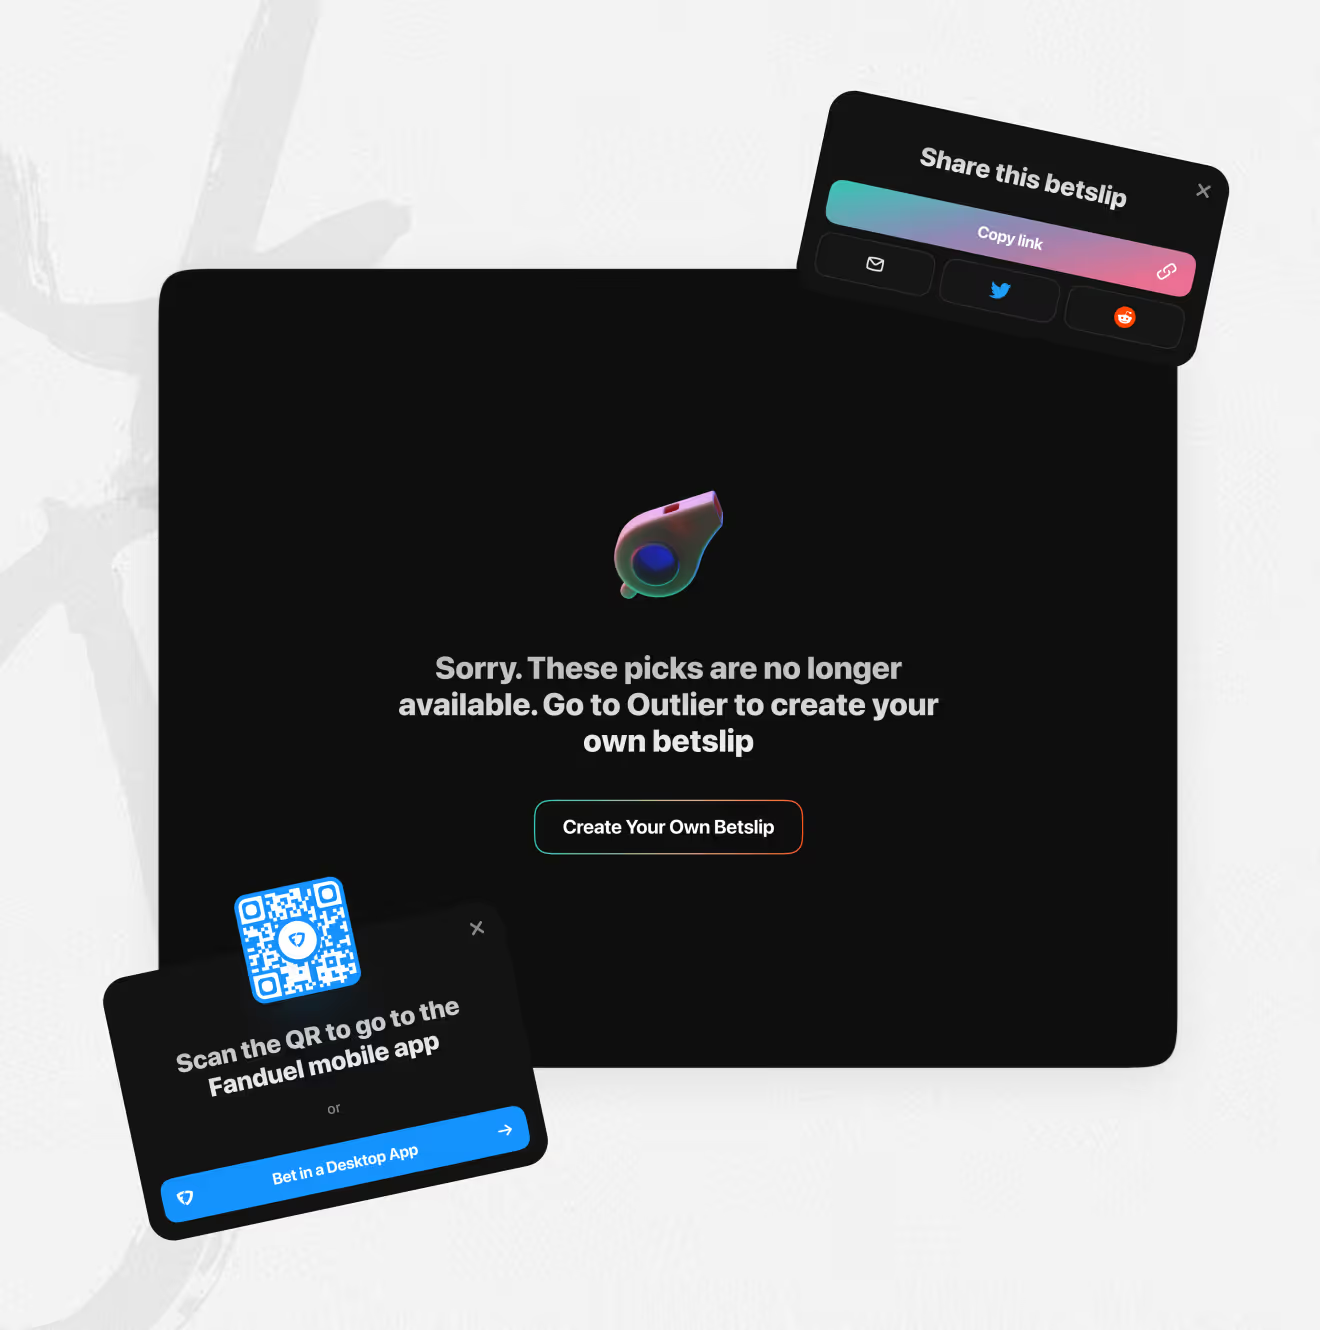
A QR code moves the bet slip from desktop to mobile, then offers a bonus or a share option. A confirmation notes a 15-minute odds delay, plus a per-book bonus list and a share panel listing selected picks for friends.
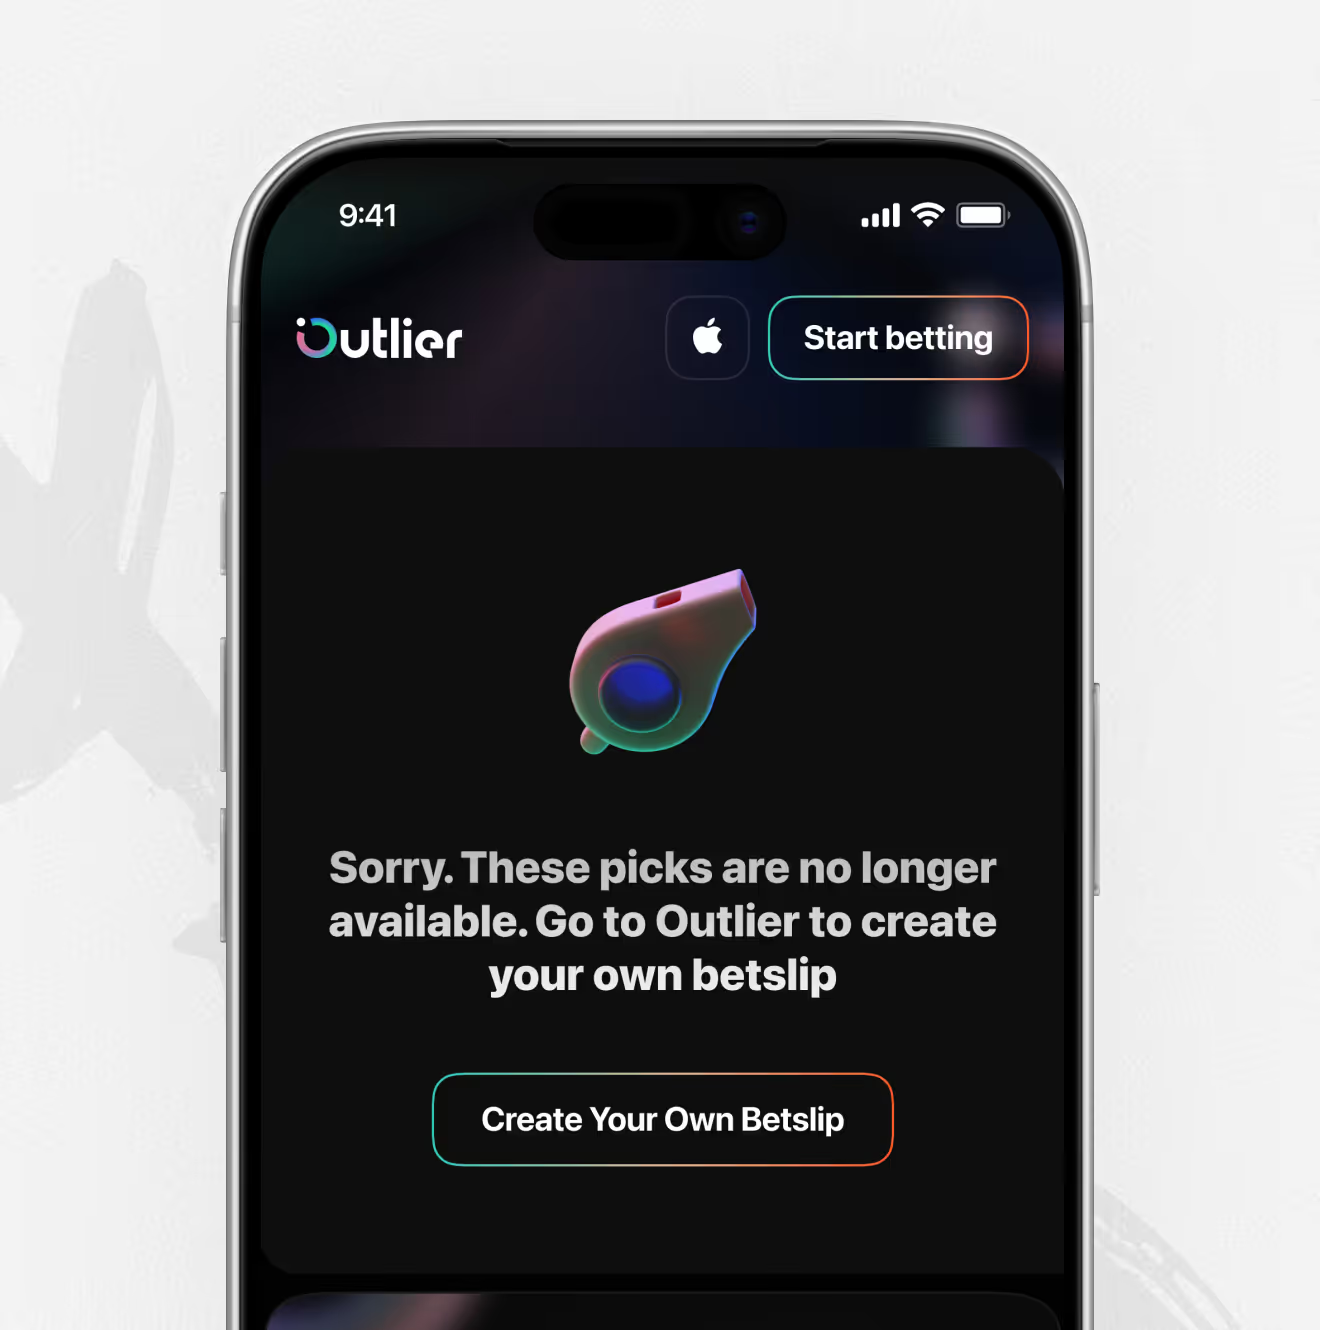
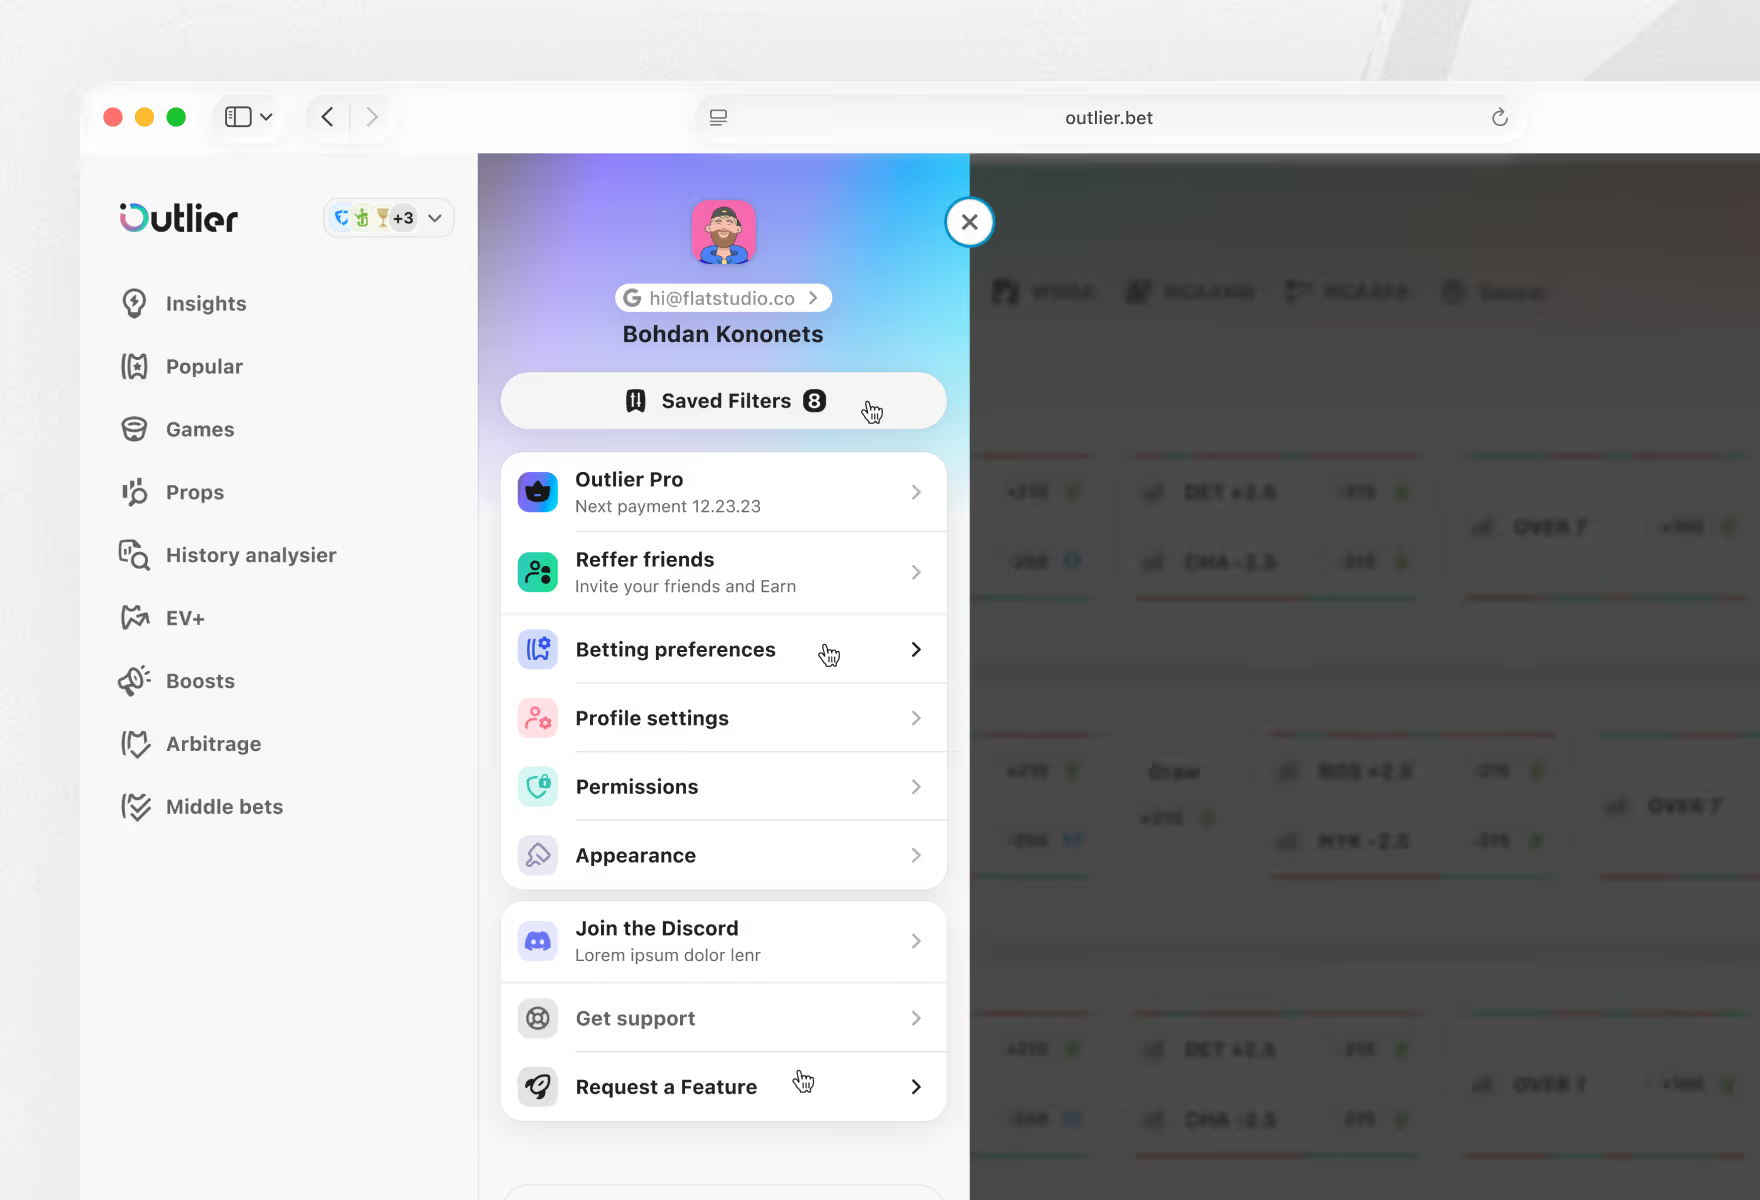
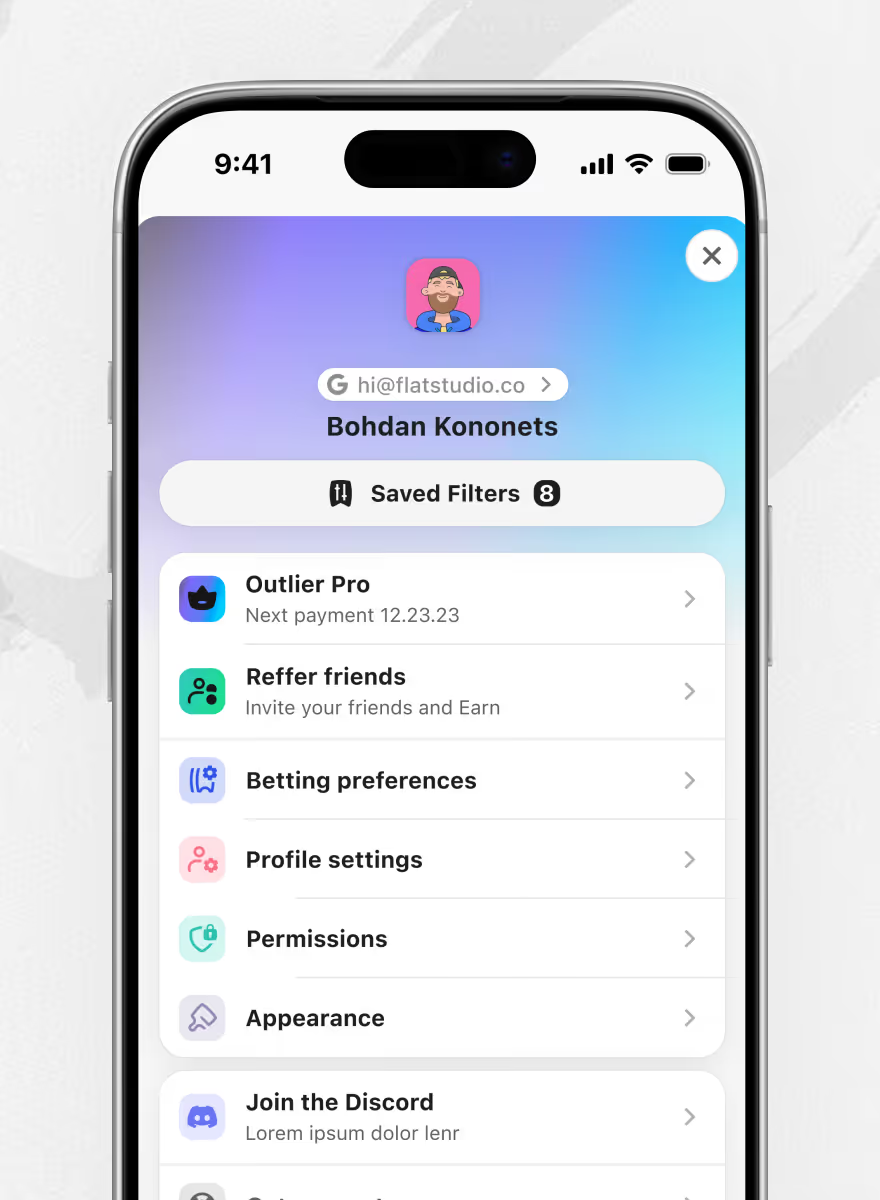
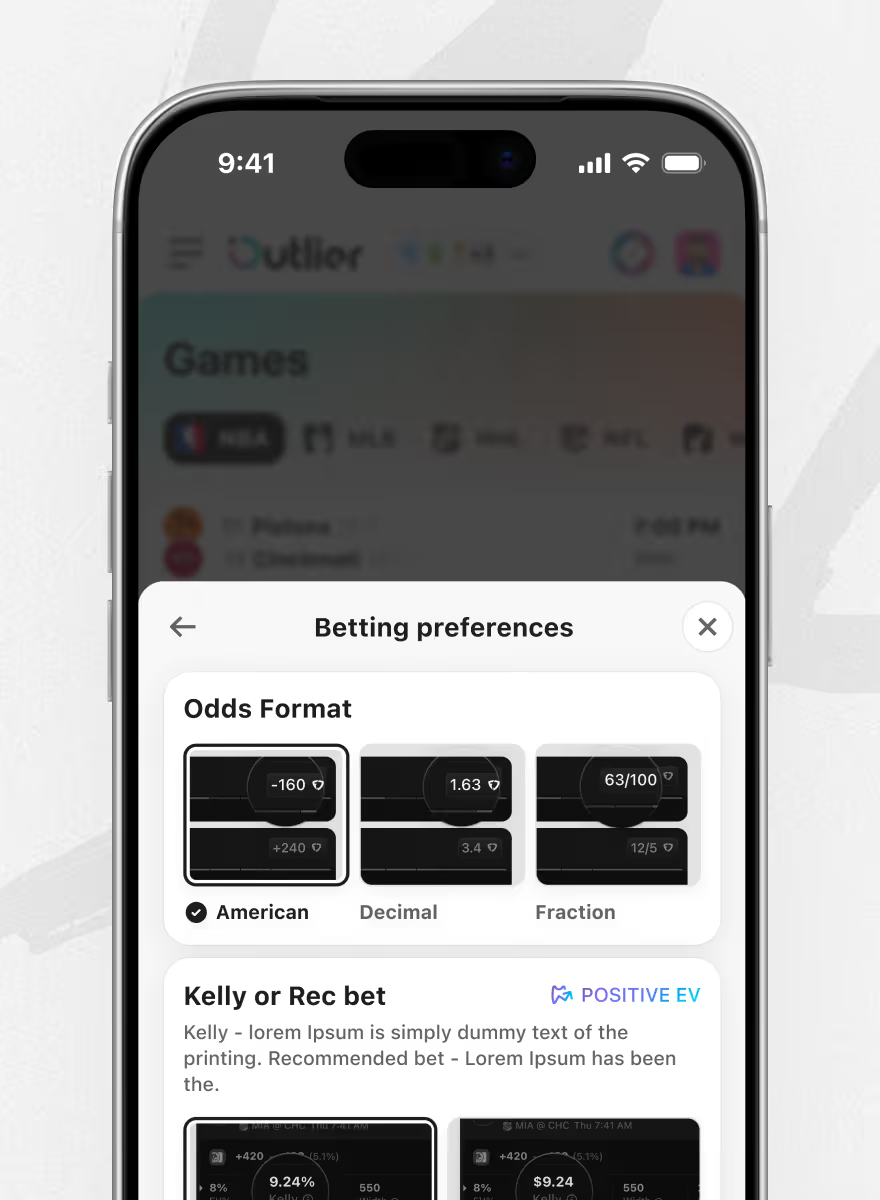
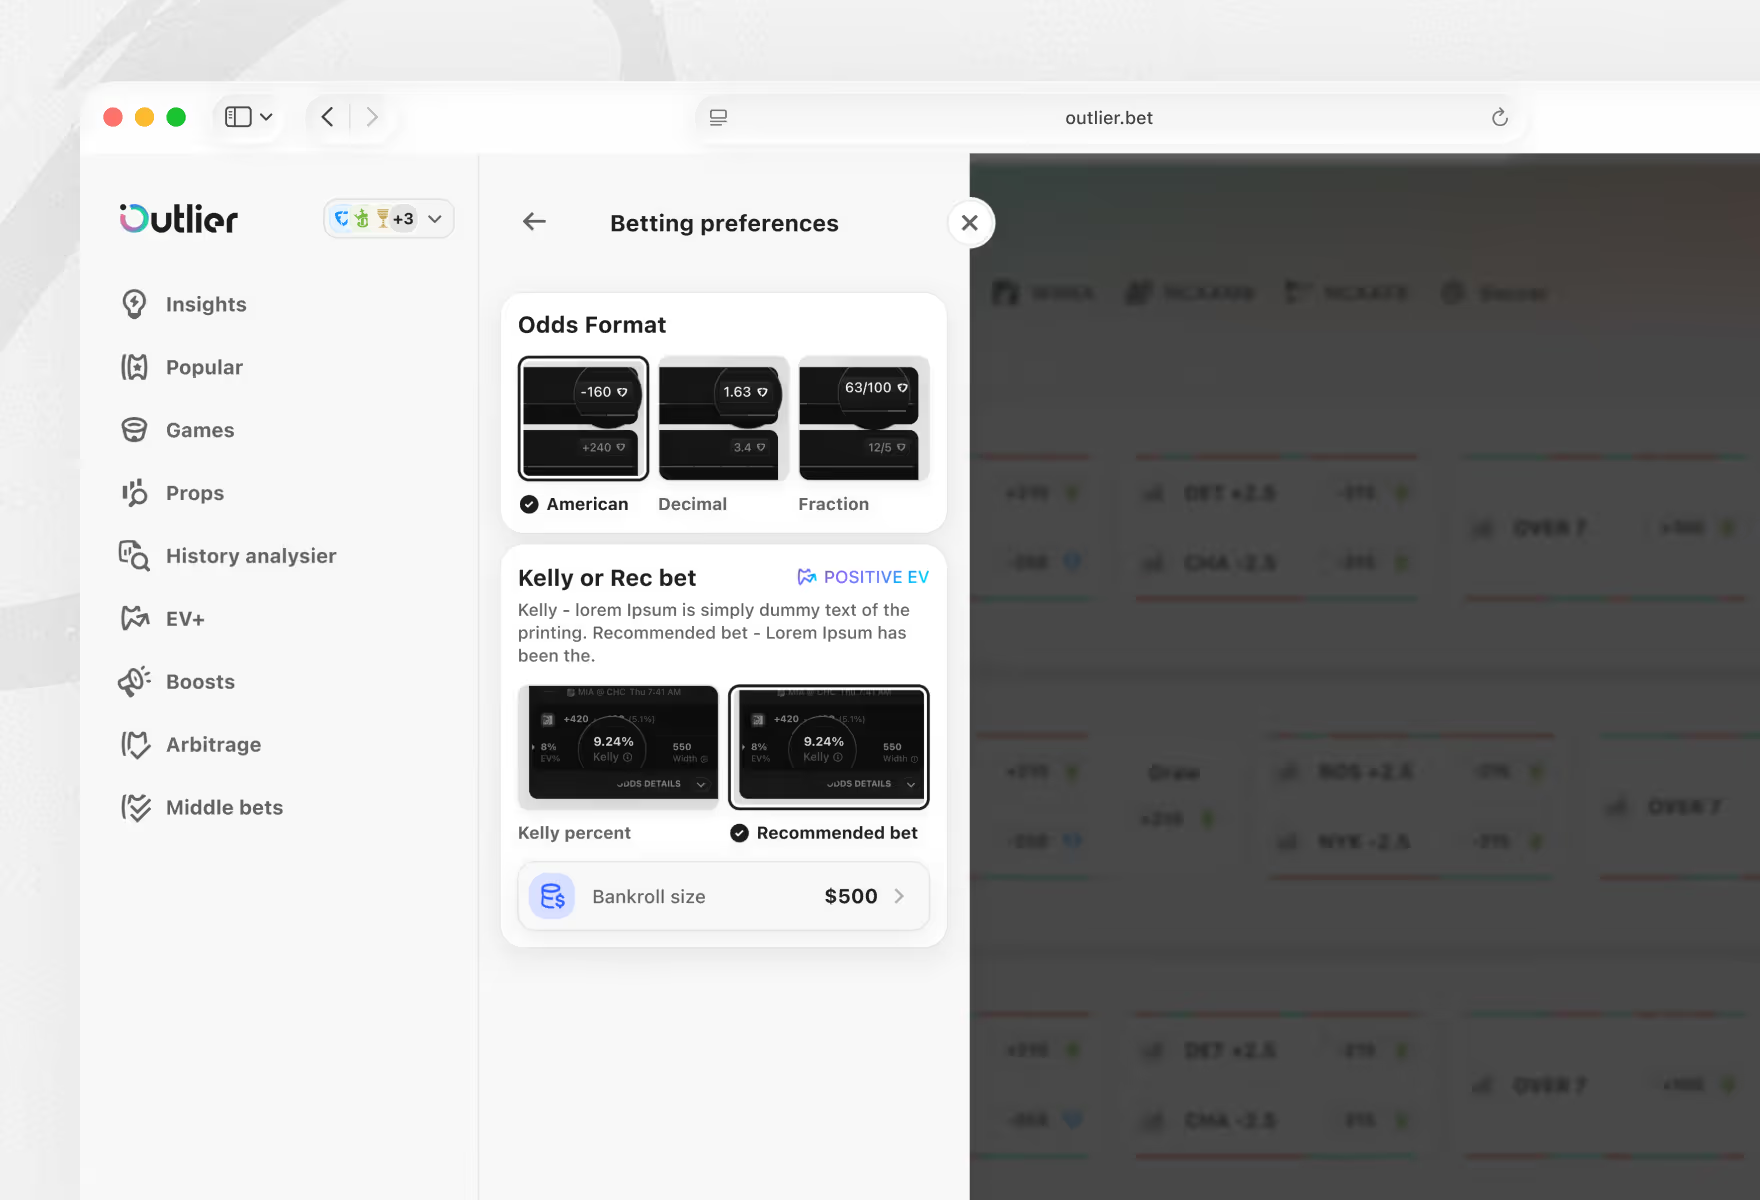
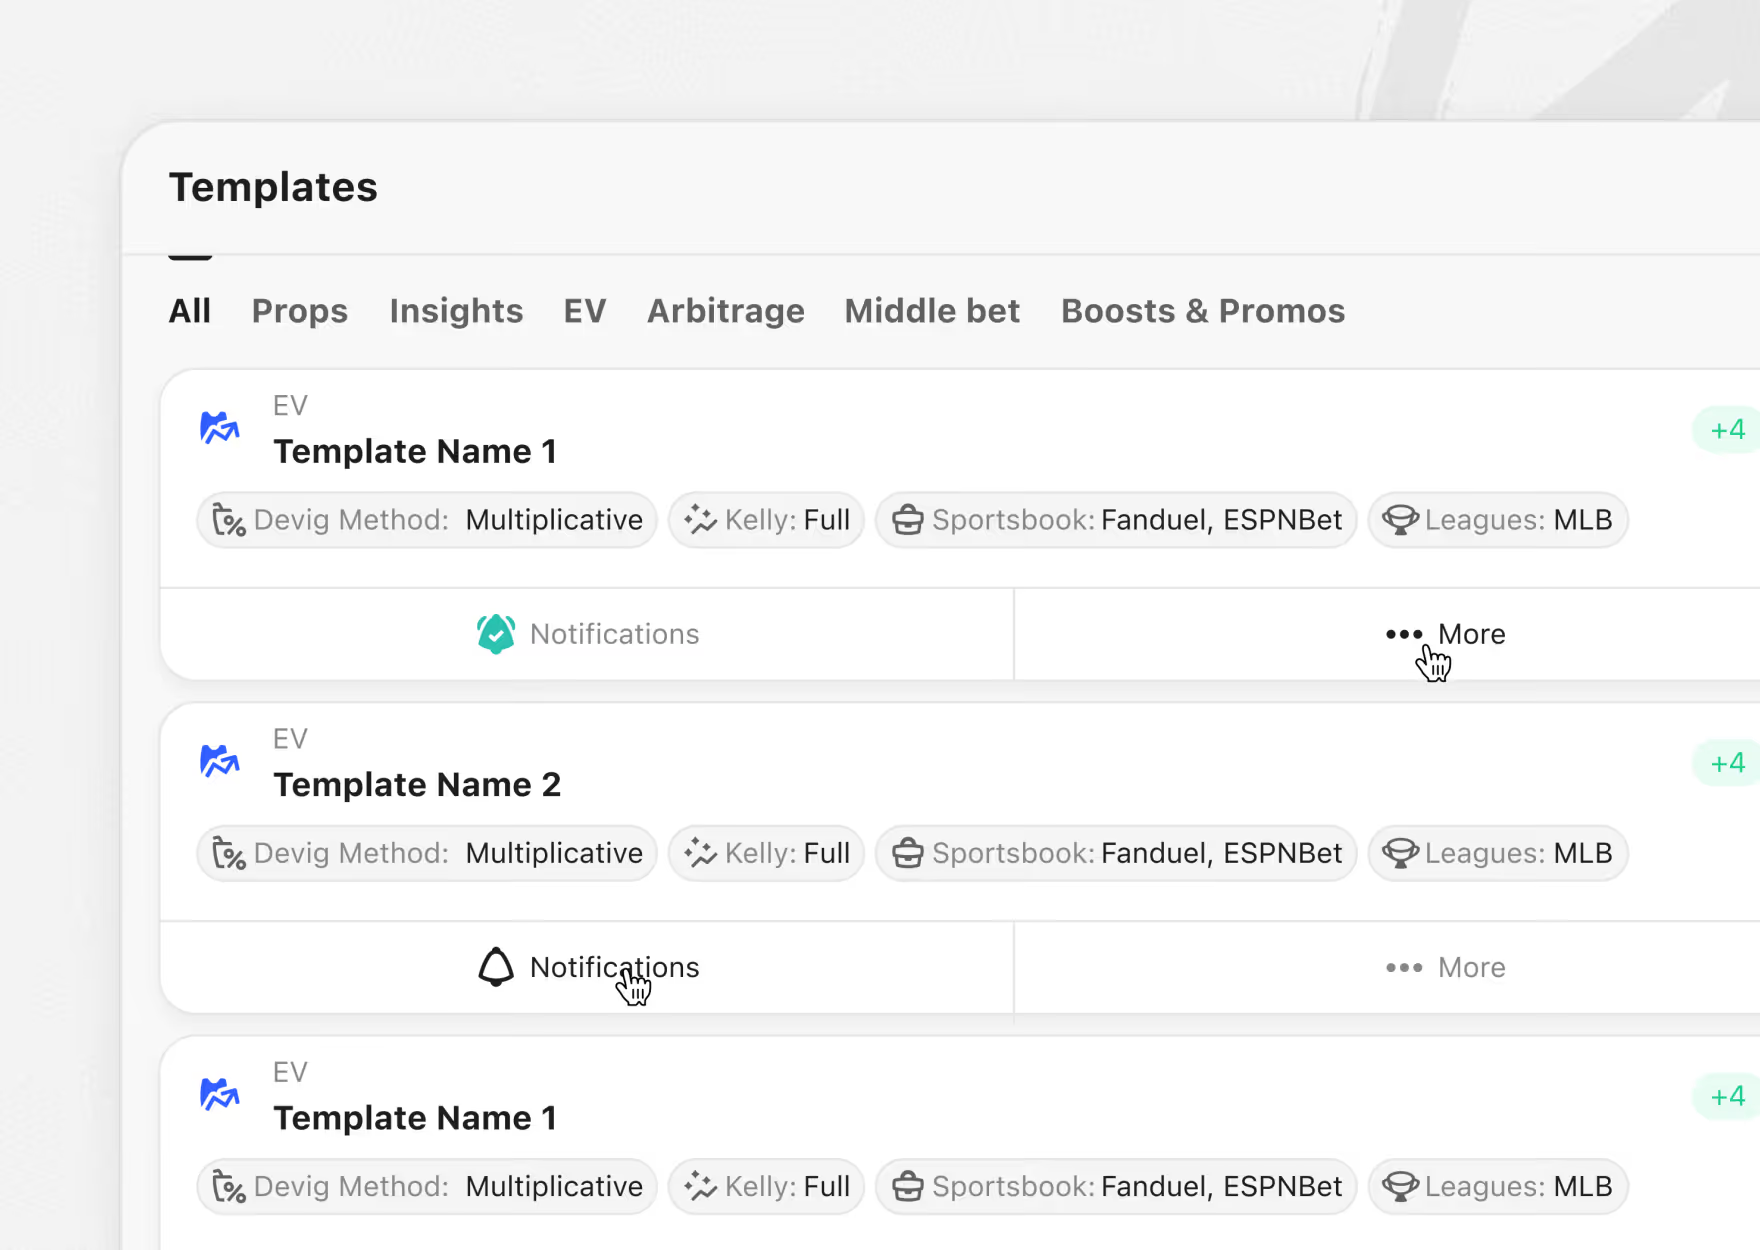
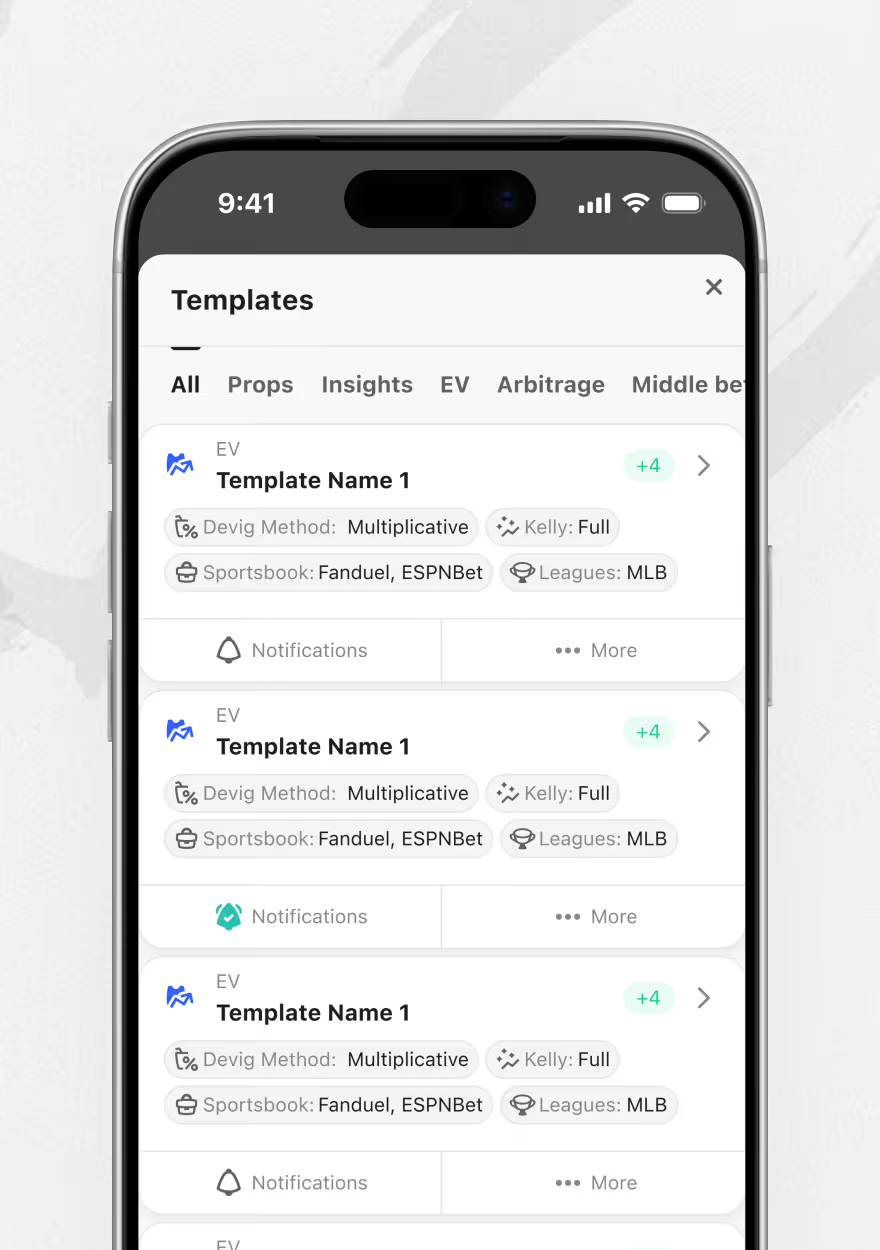
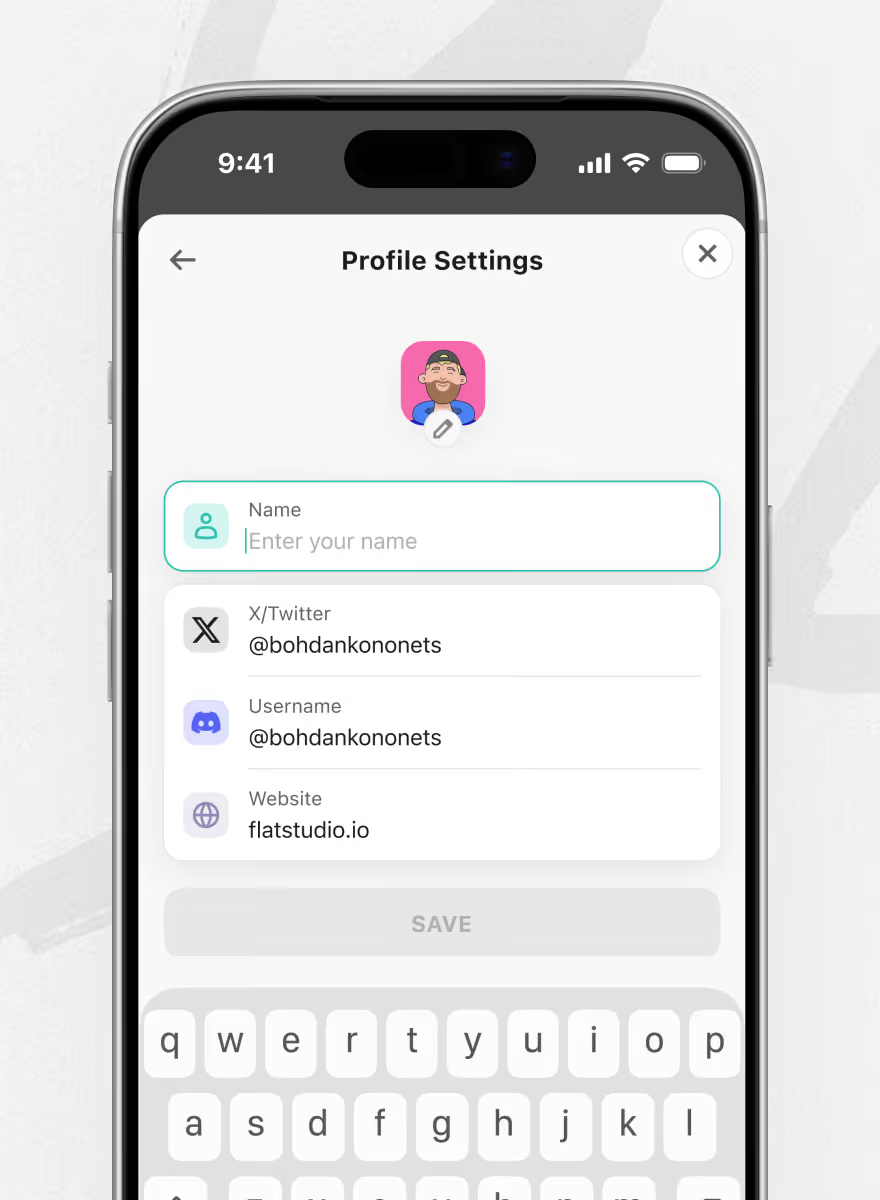
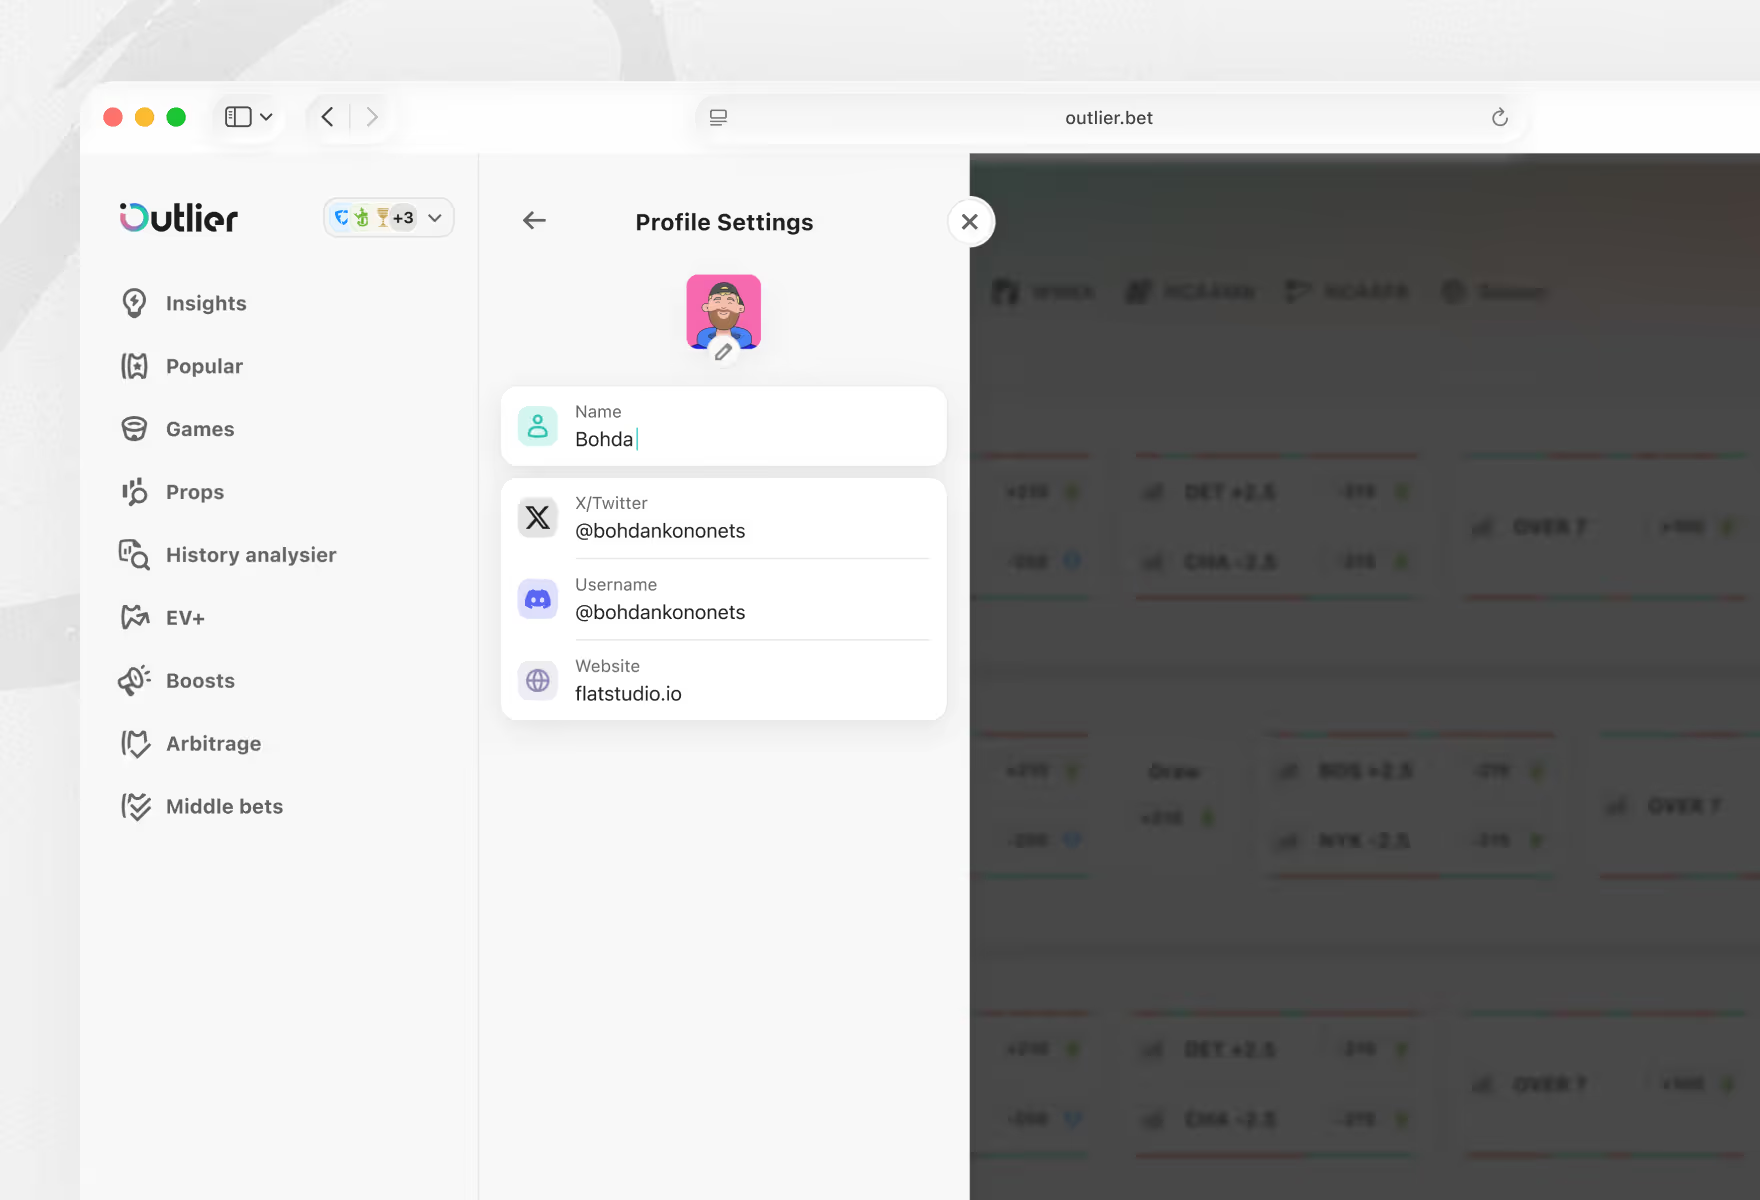
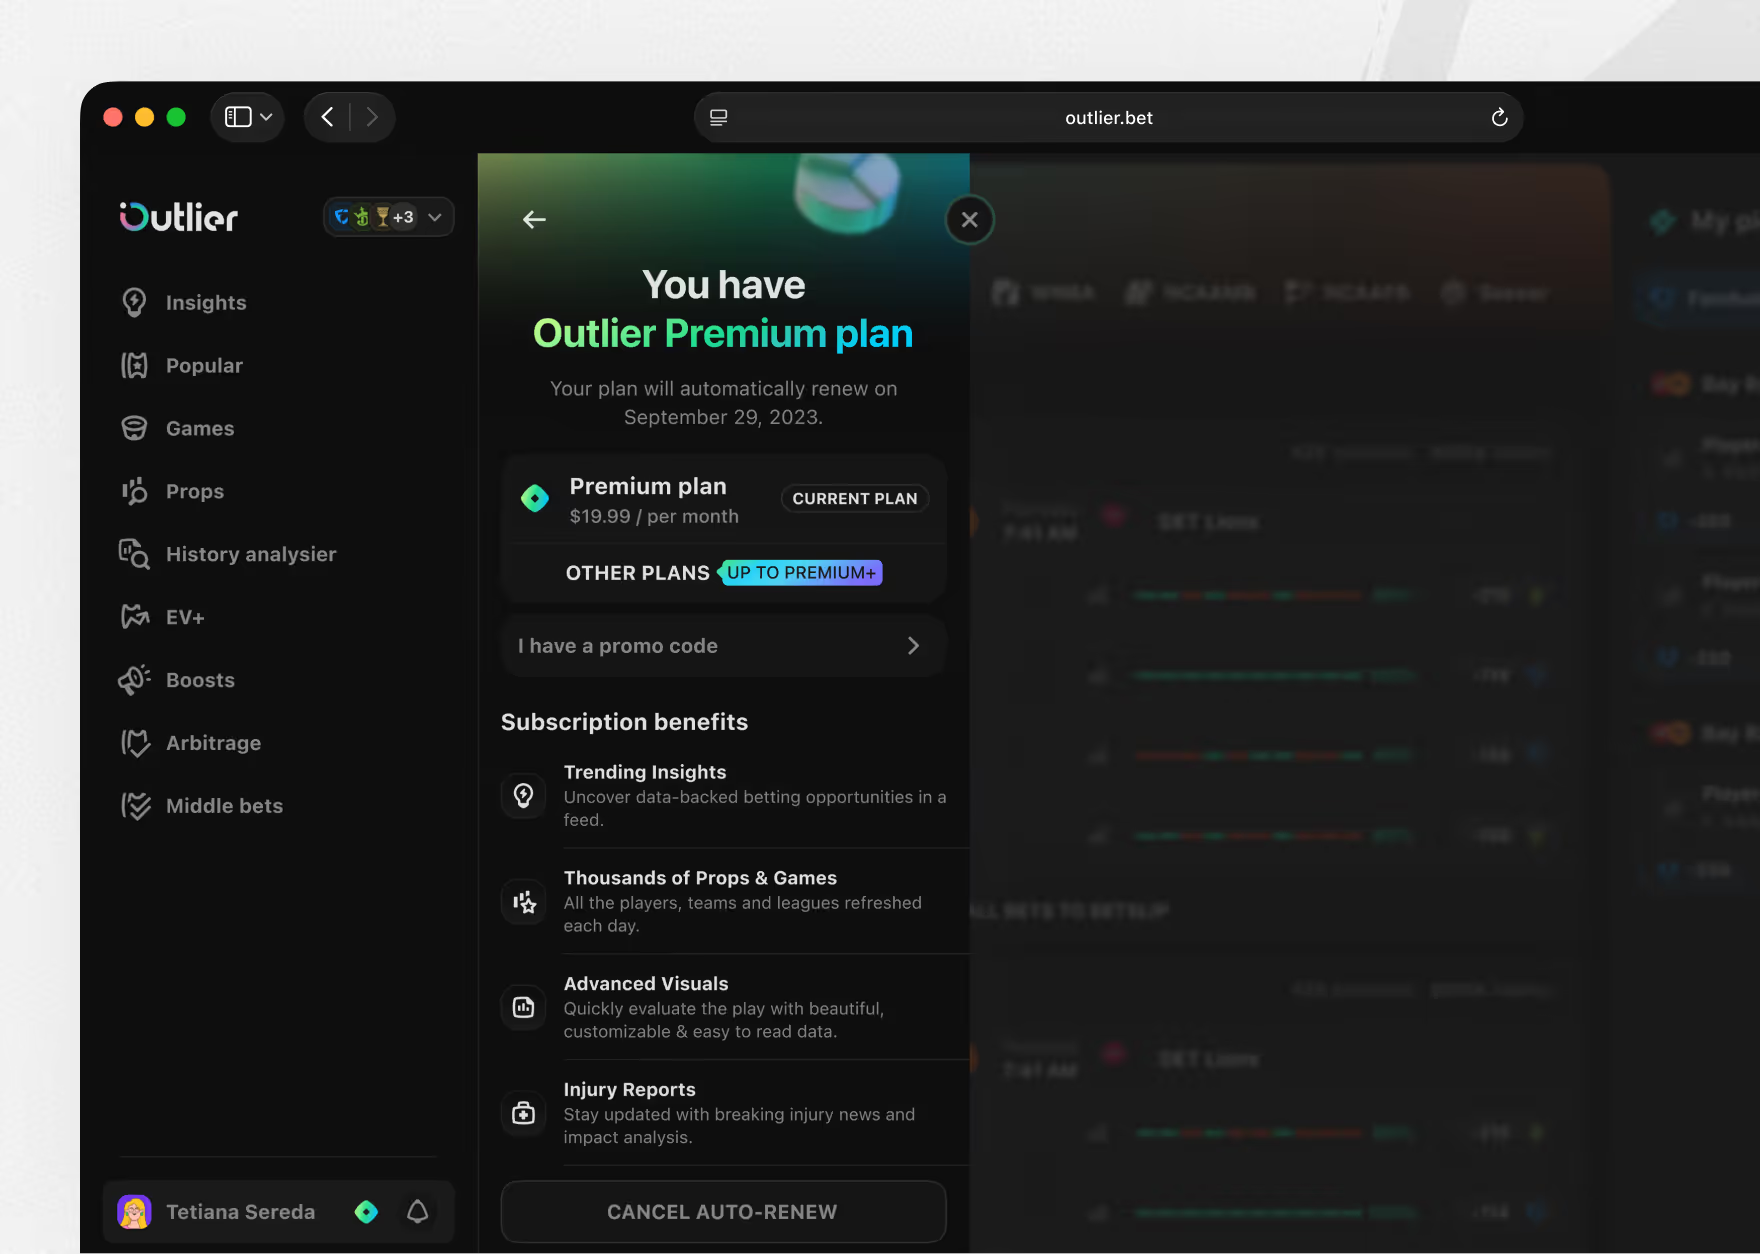
An account menu covers subscription, referrals, and saved settings, next to reusable filter templates. Each Template saves a Devig Method, Kelly setting, sportsbook, and league; Betting Preferences sets odds format and bankroll size.
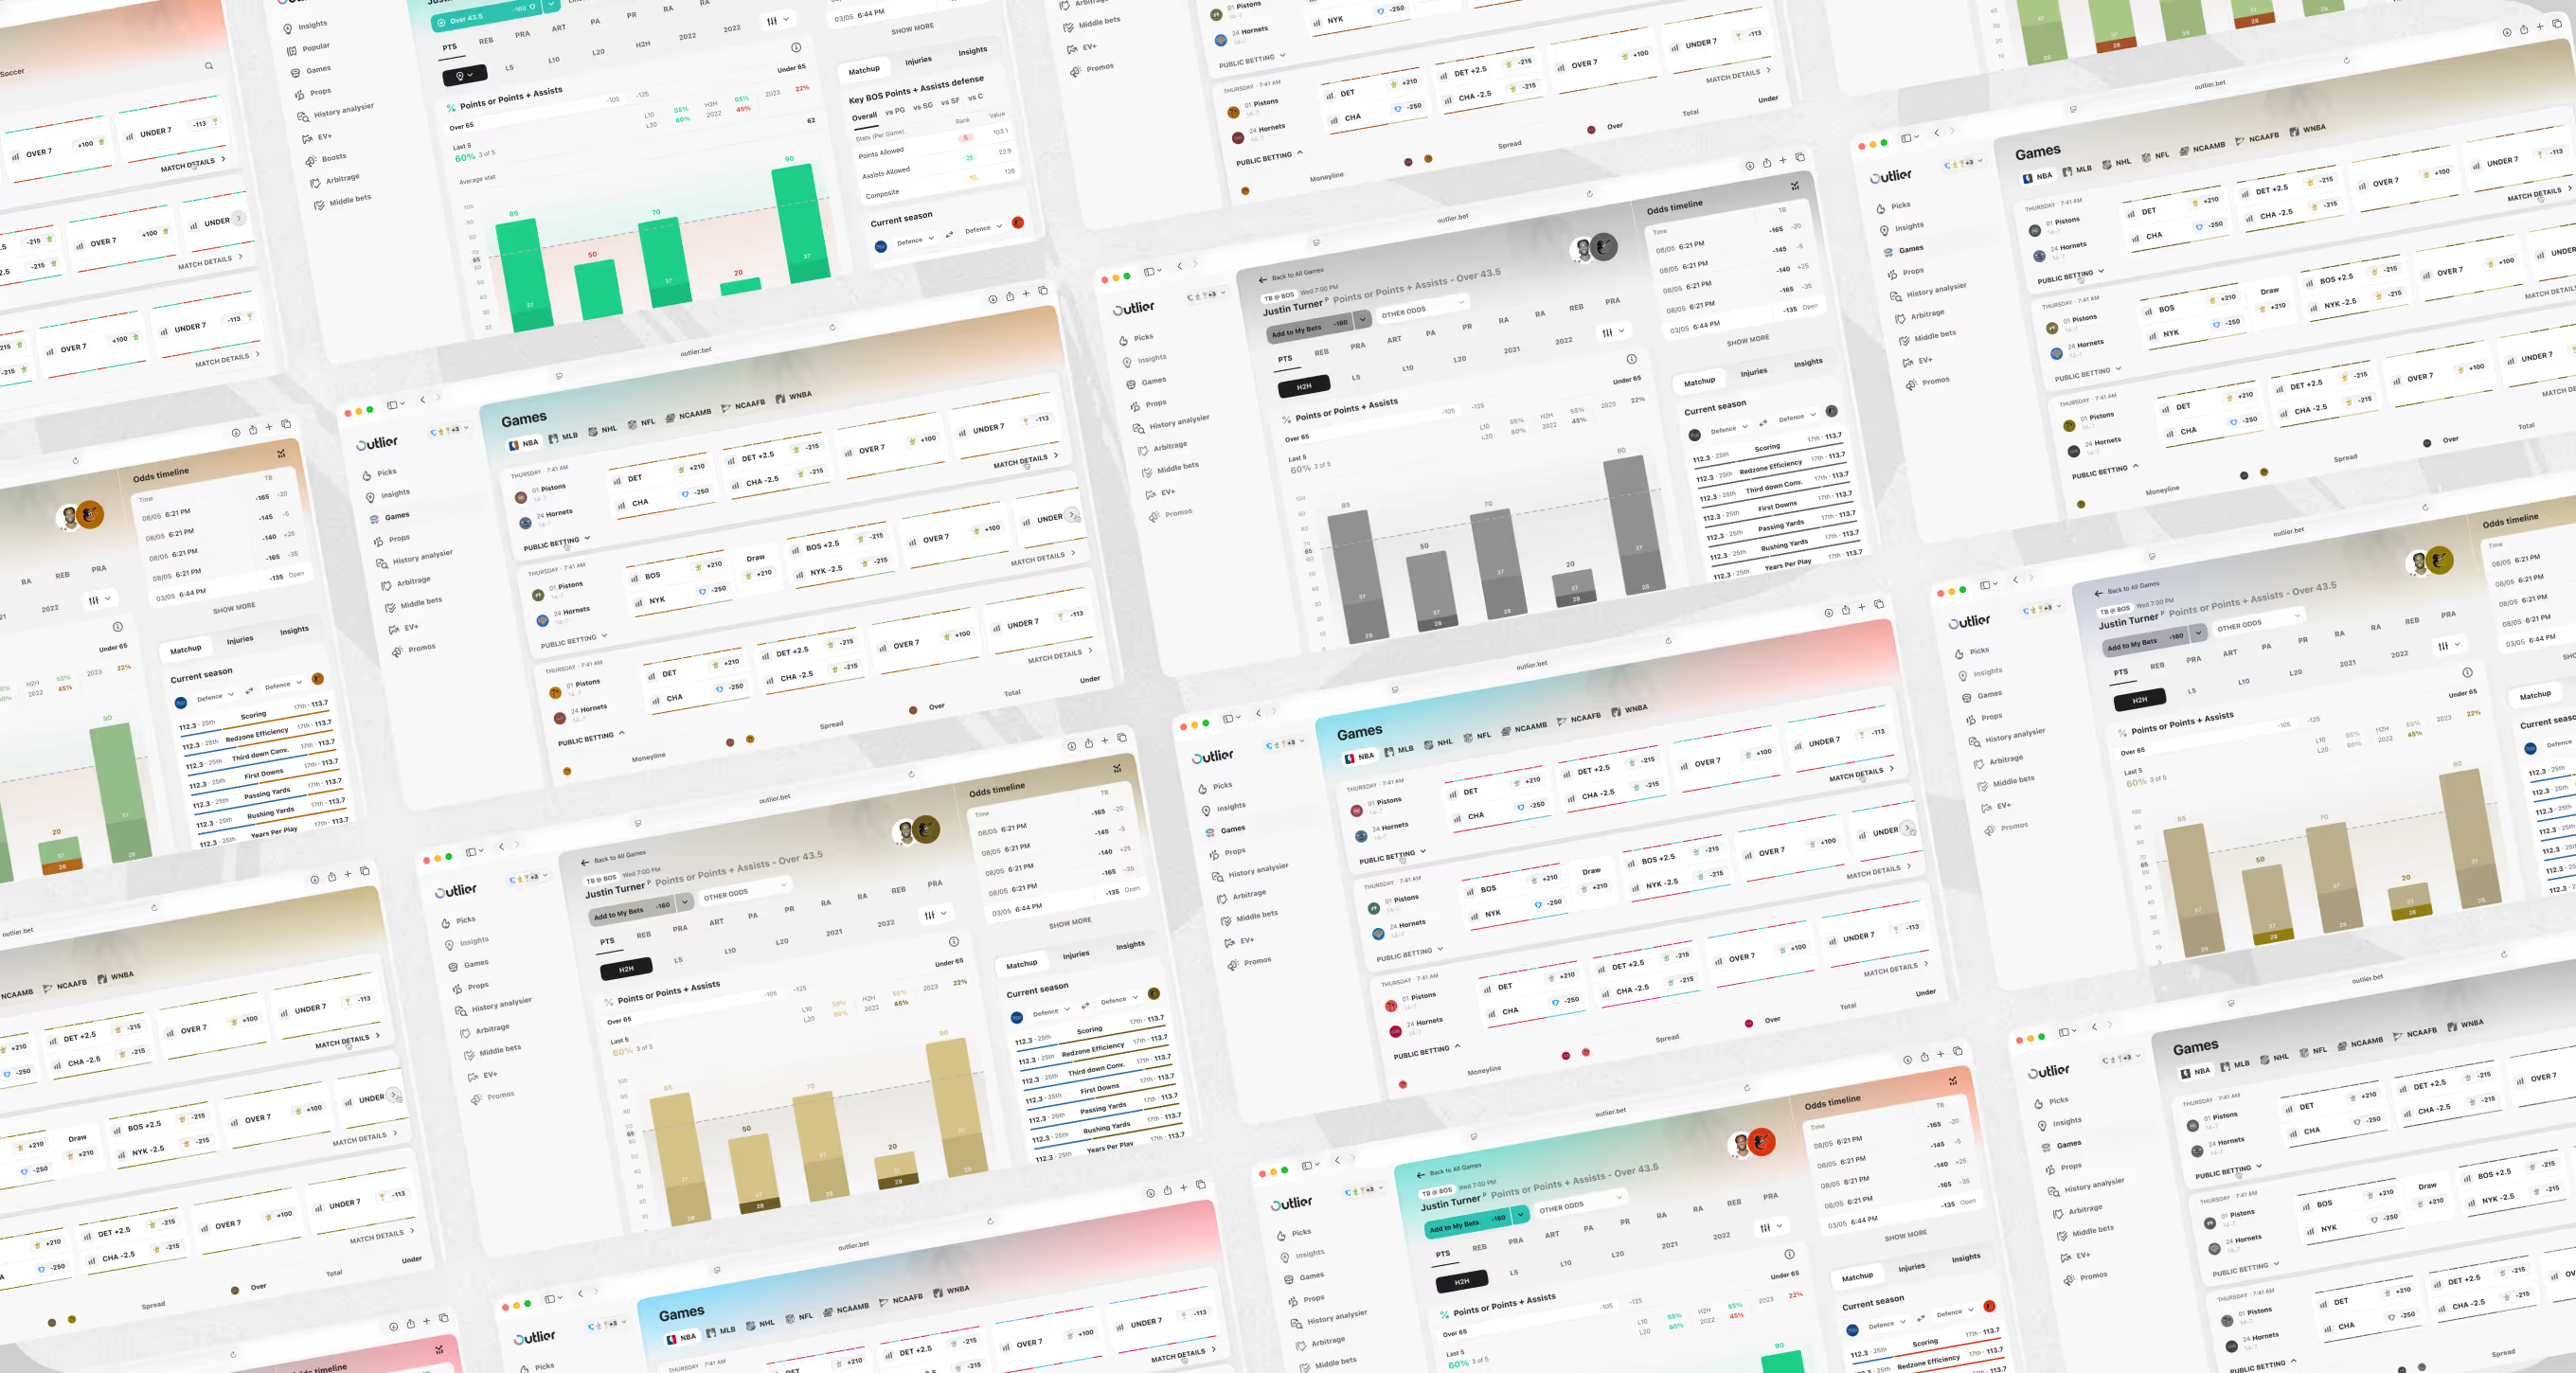
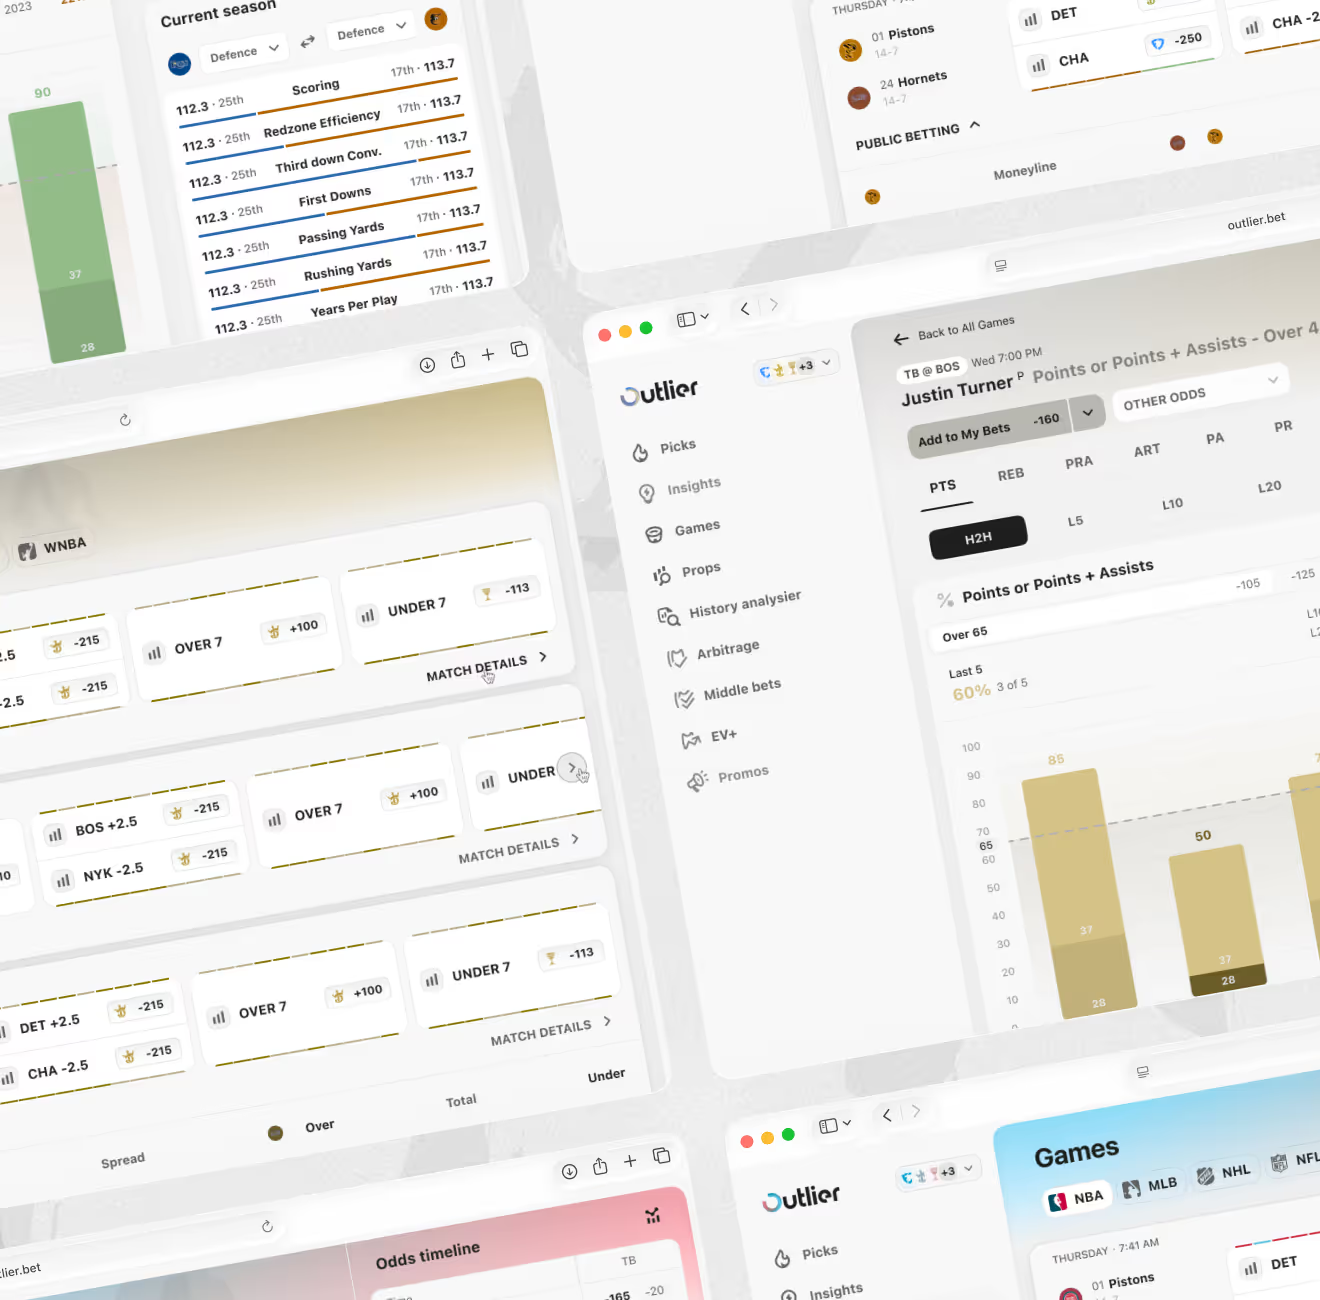
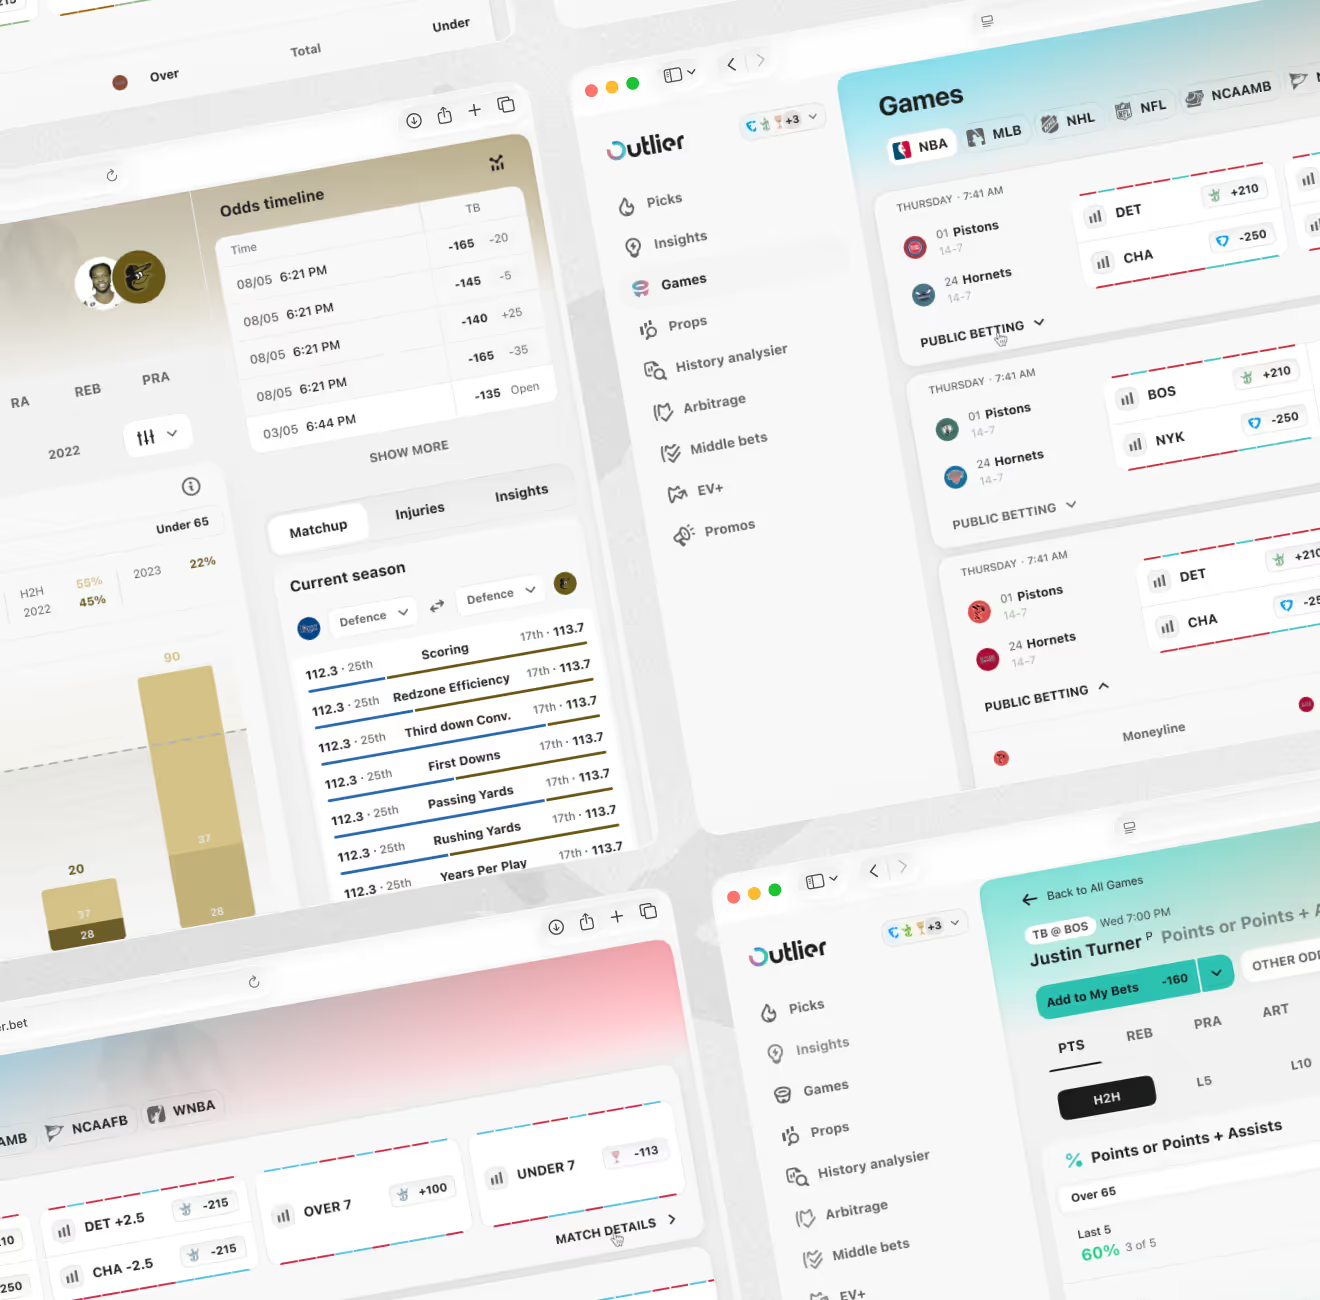
An accessibility pass that simulates colour vision deficiency across the sports betting dashboard, not just one screen. Bar charts, odds tables, and the games list are re-rendered under each simulation and checked against the default palette.
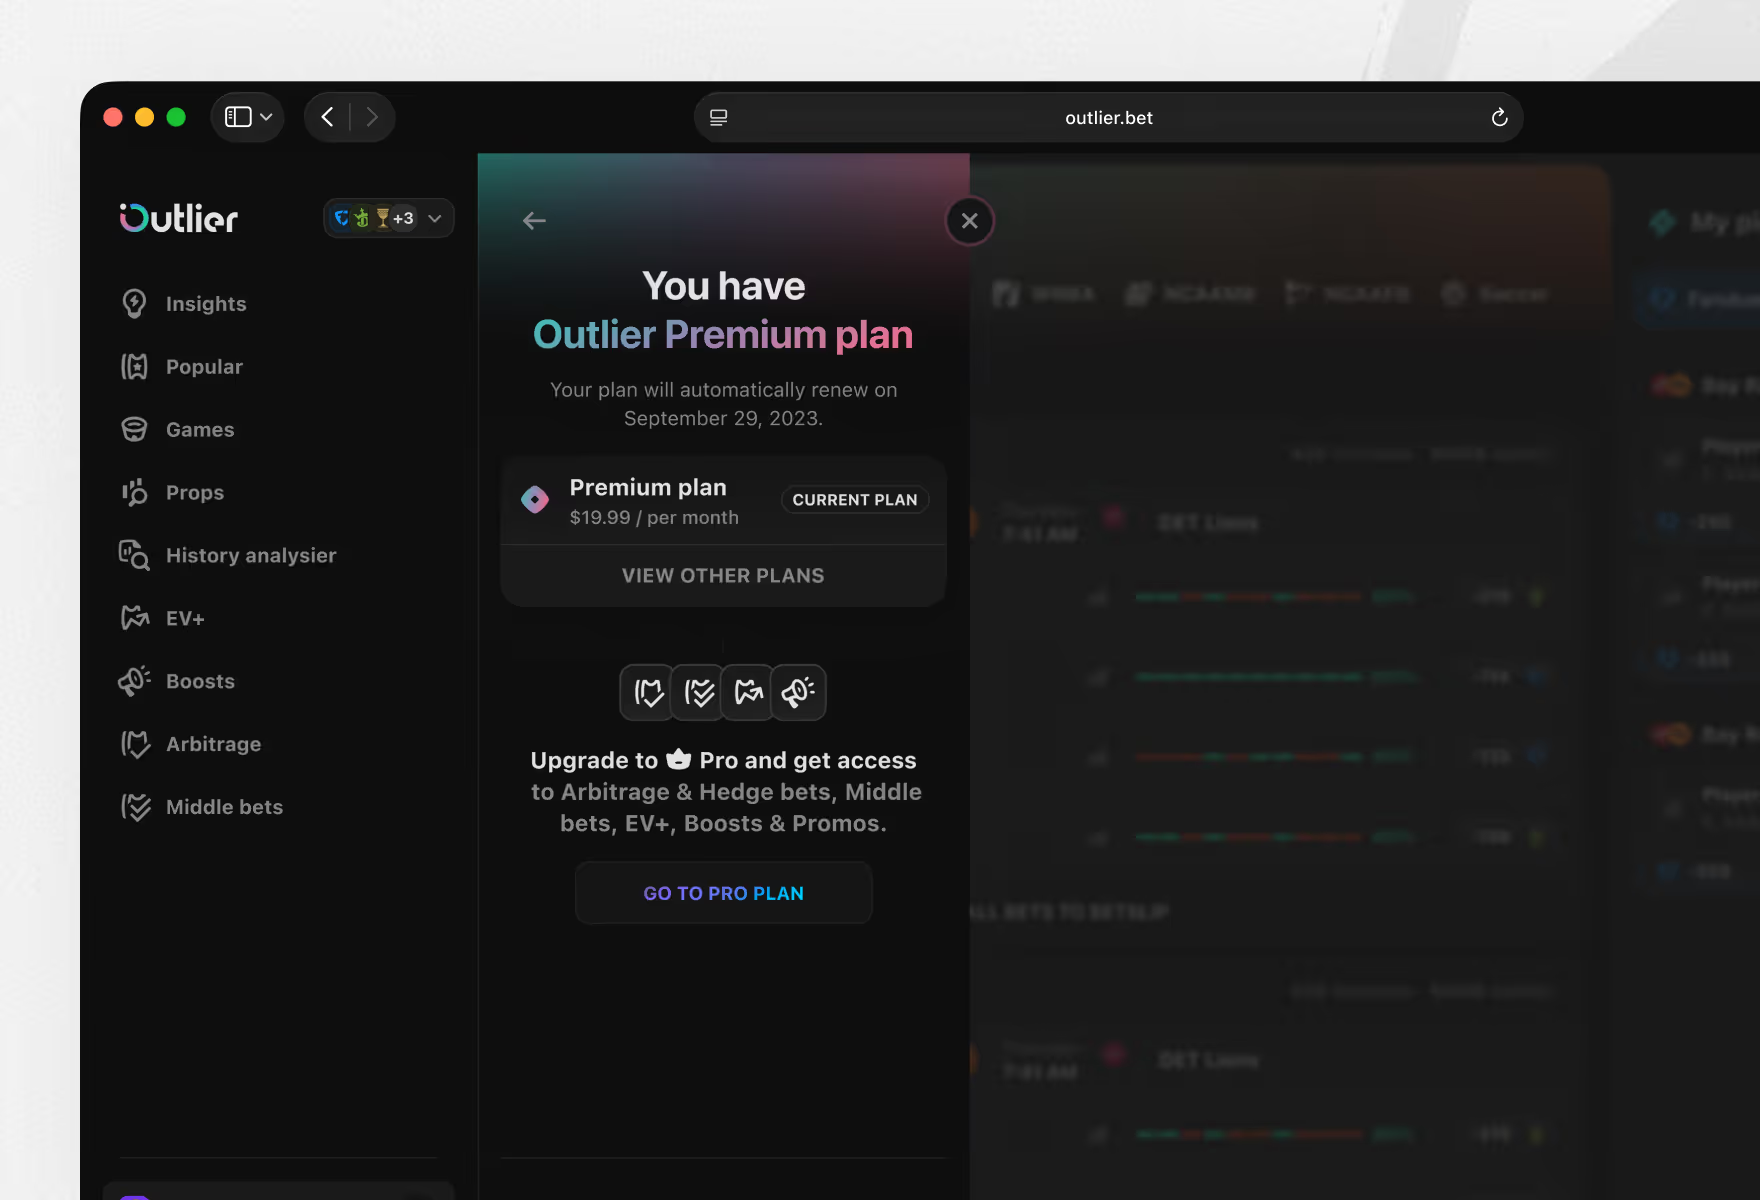
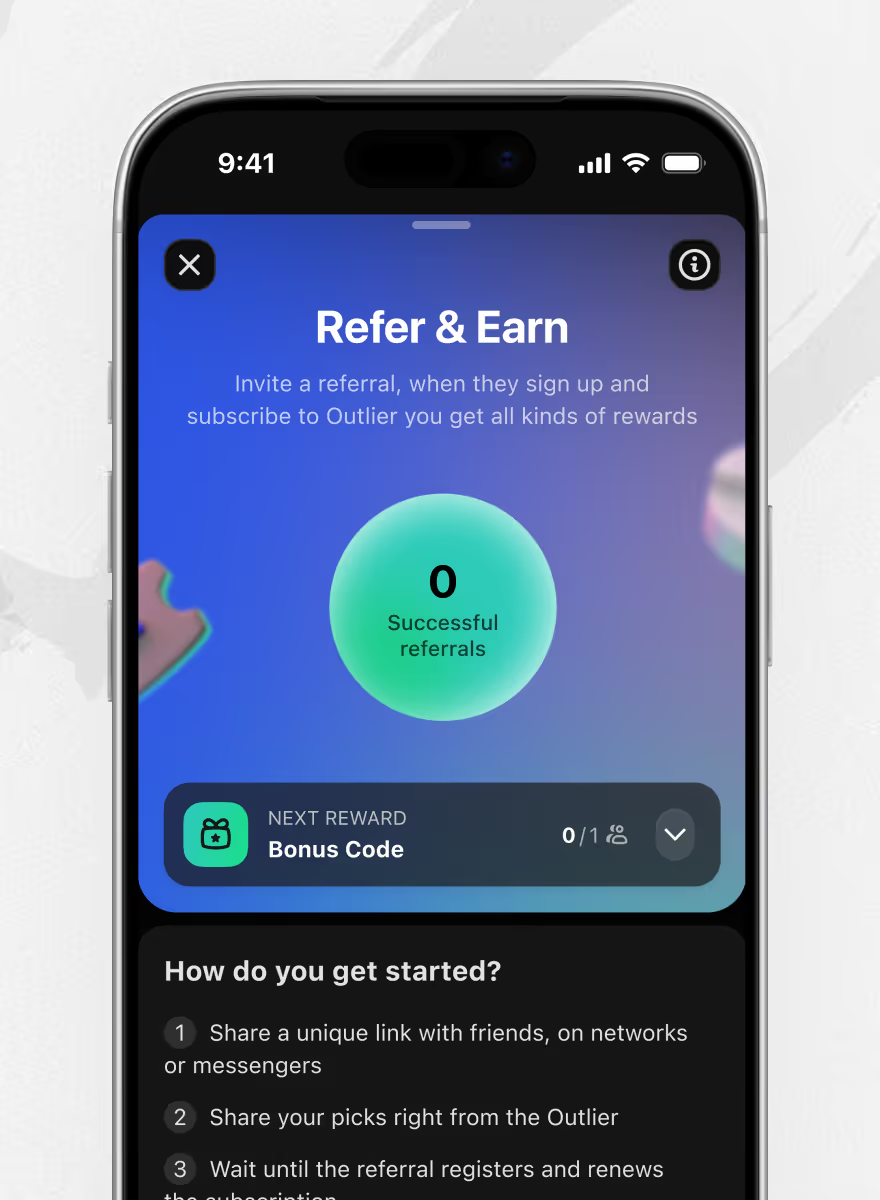
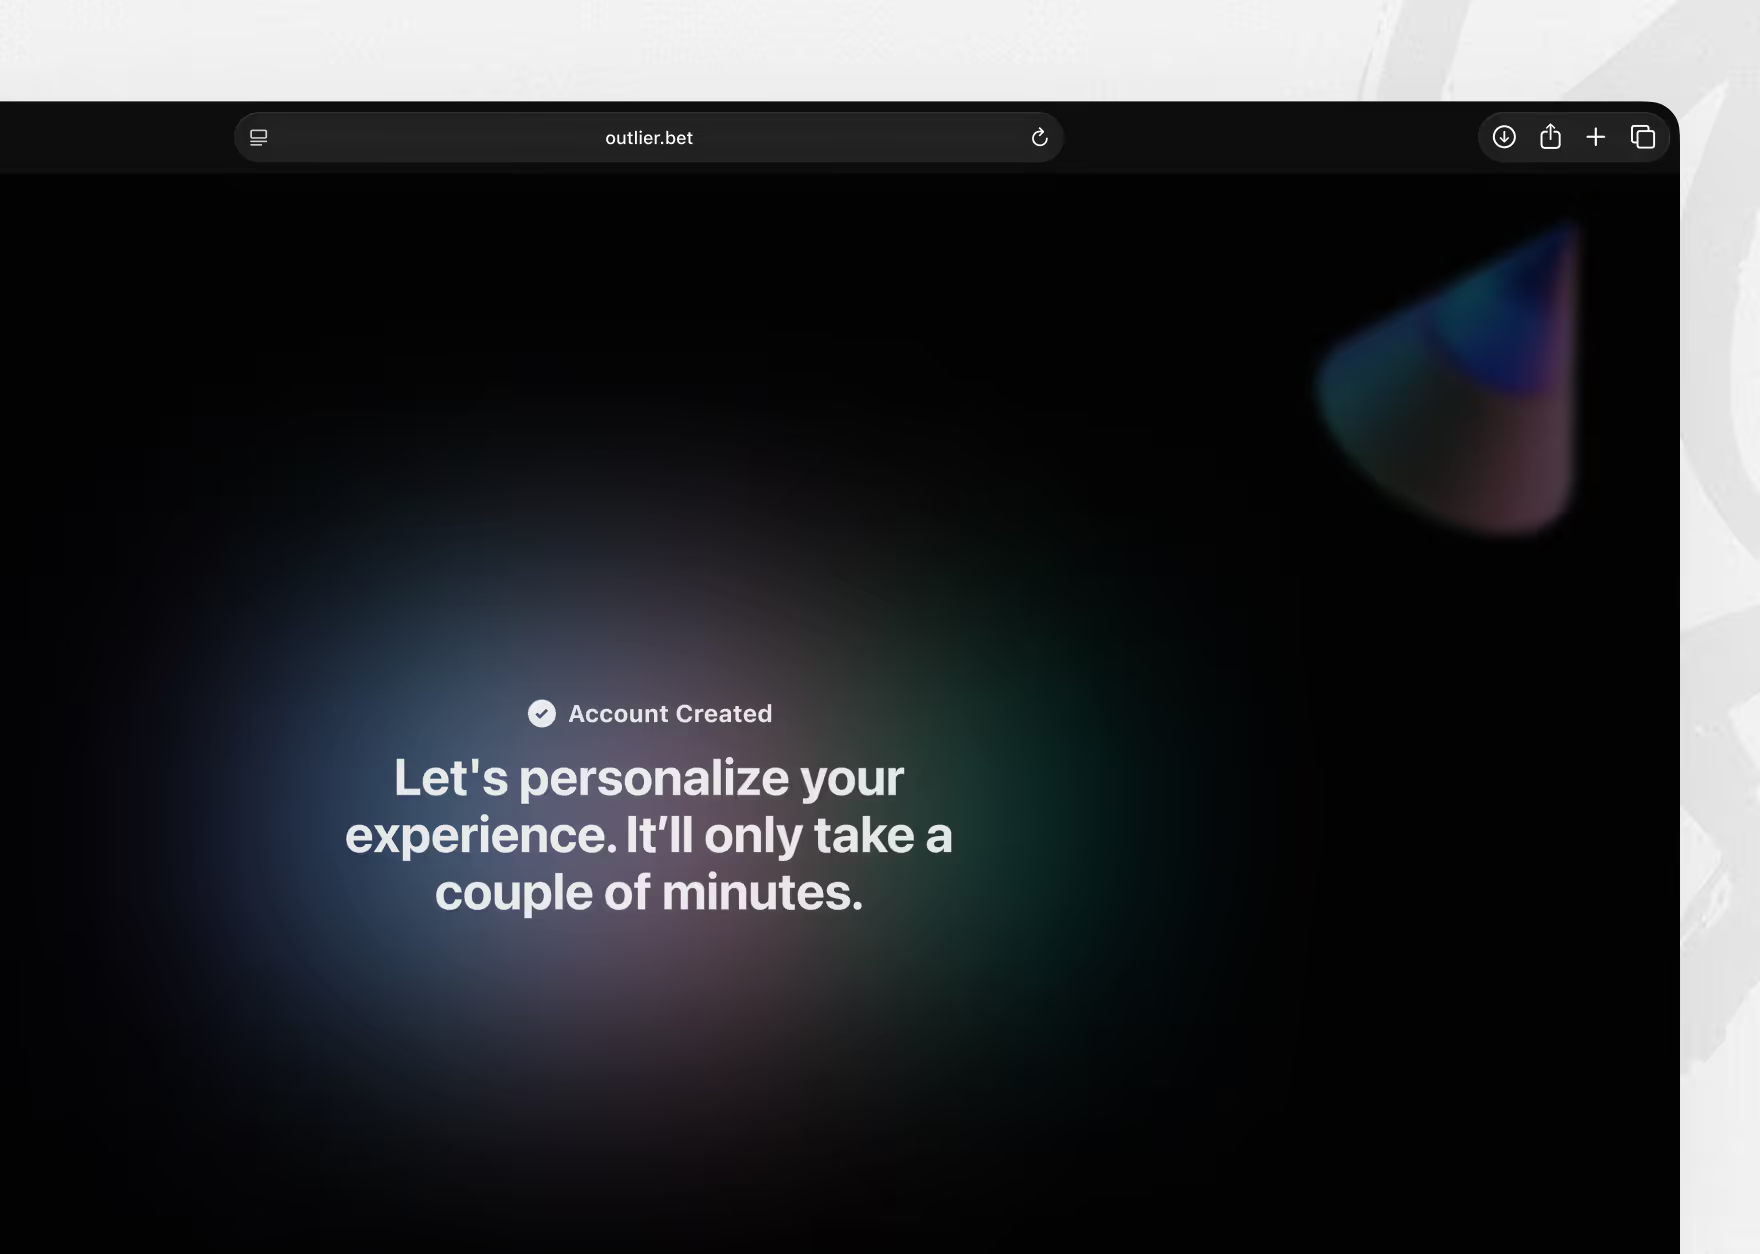
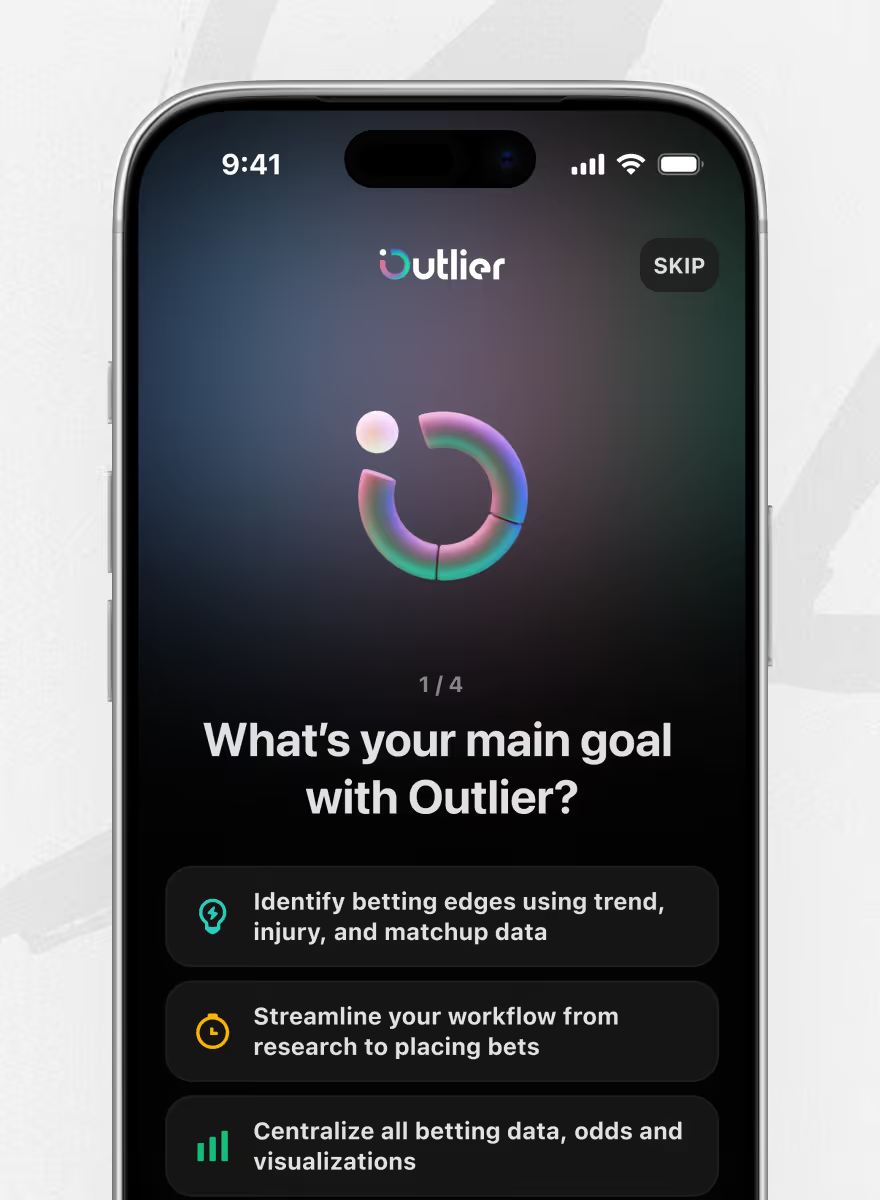
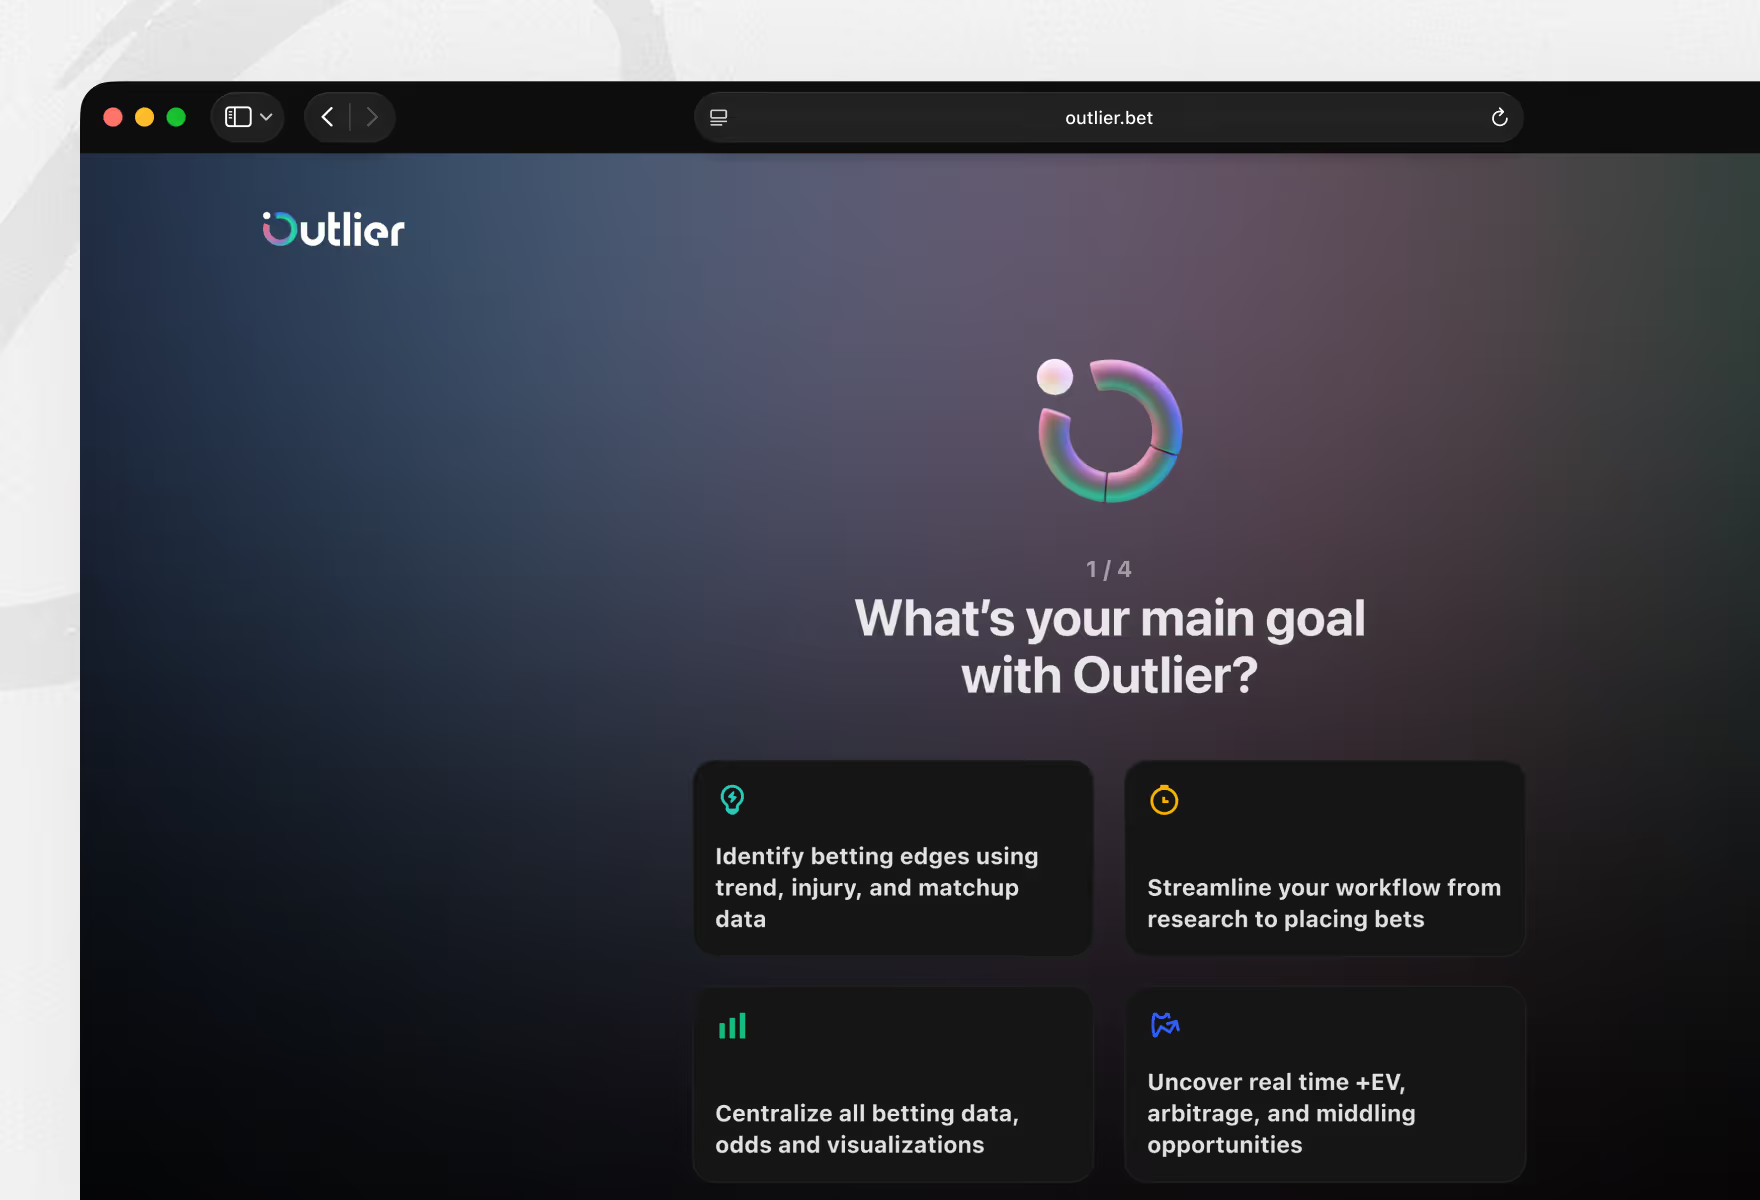
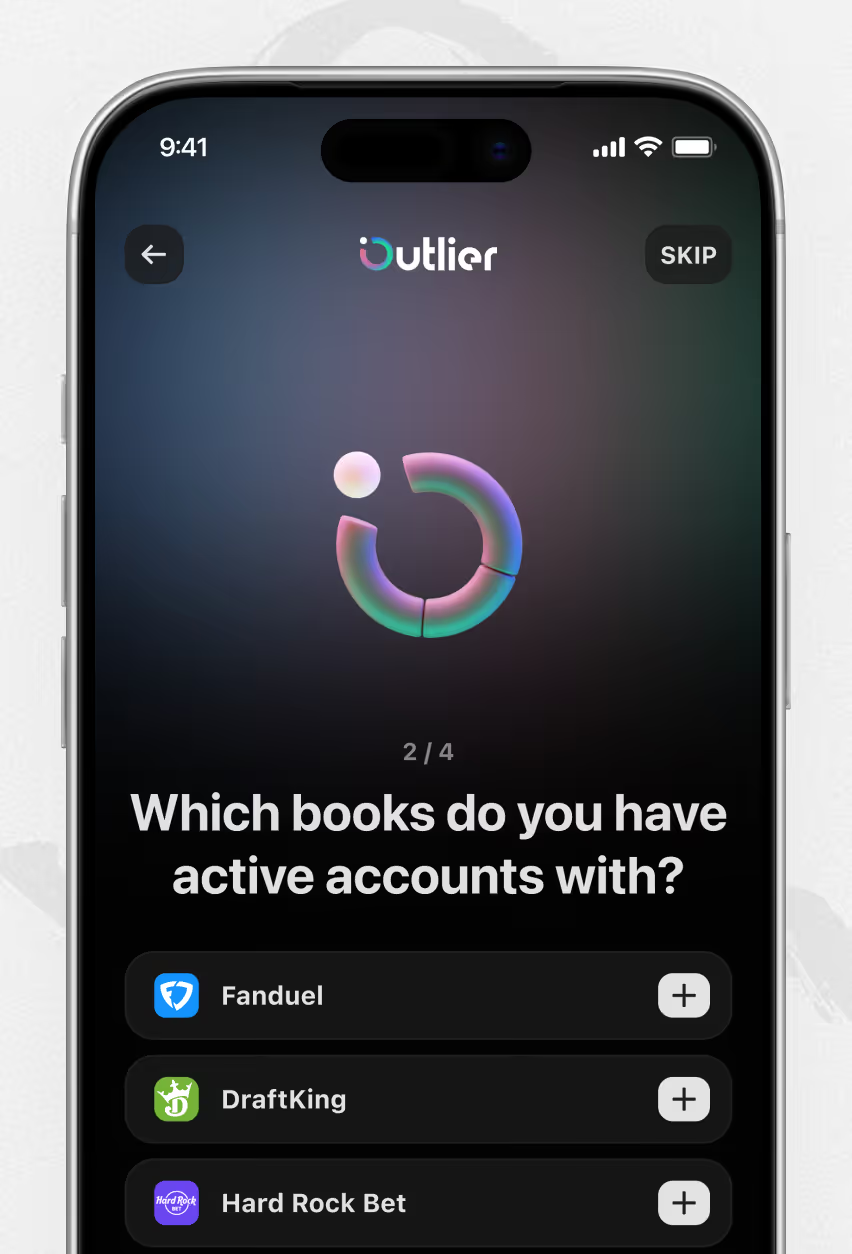
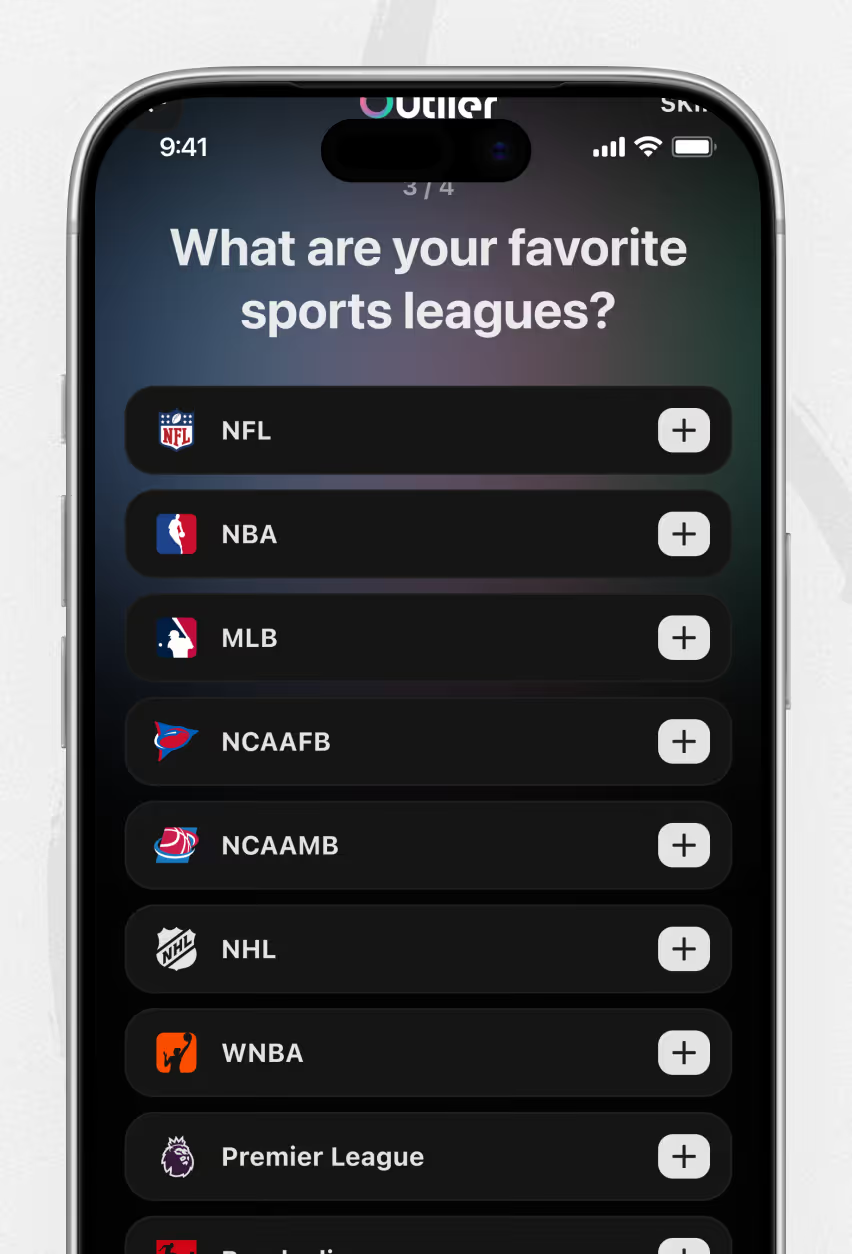
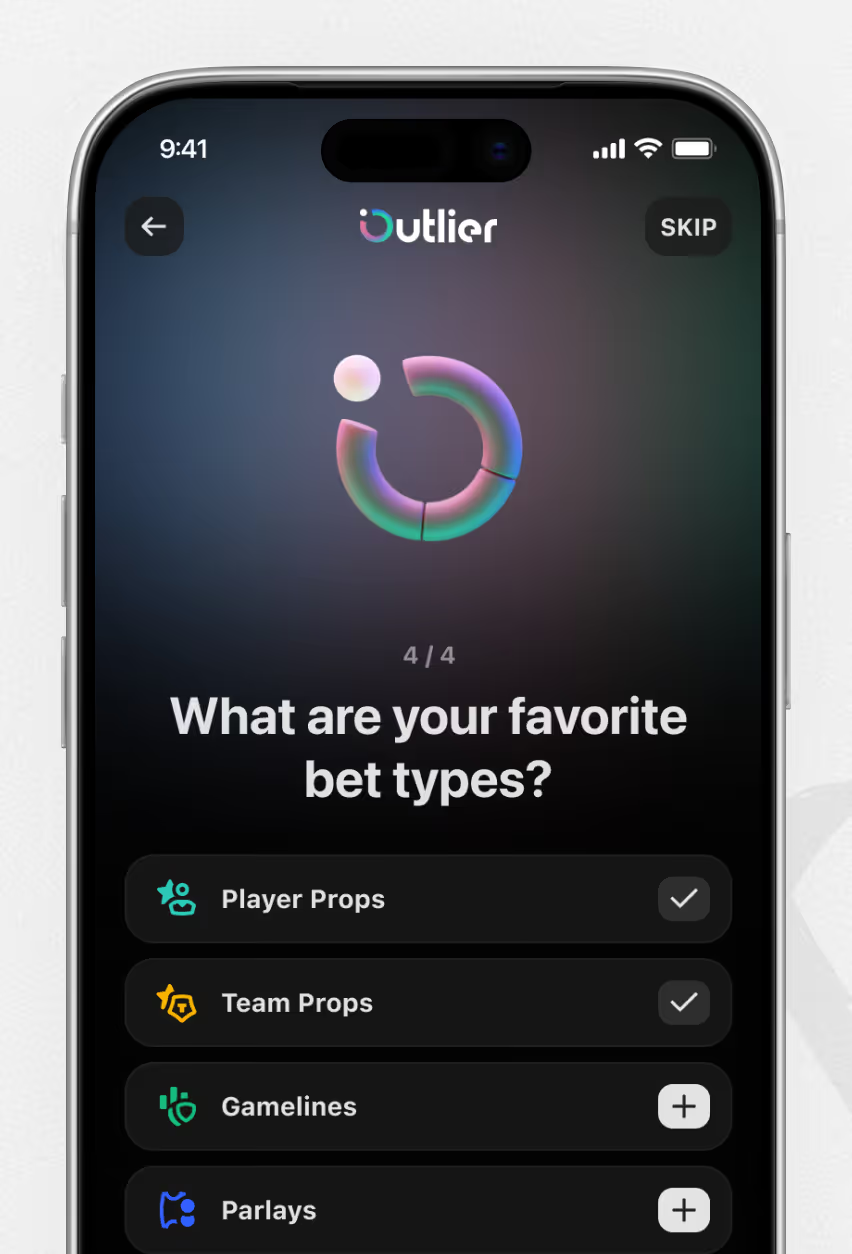
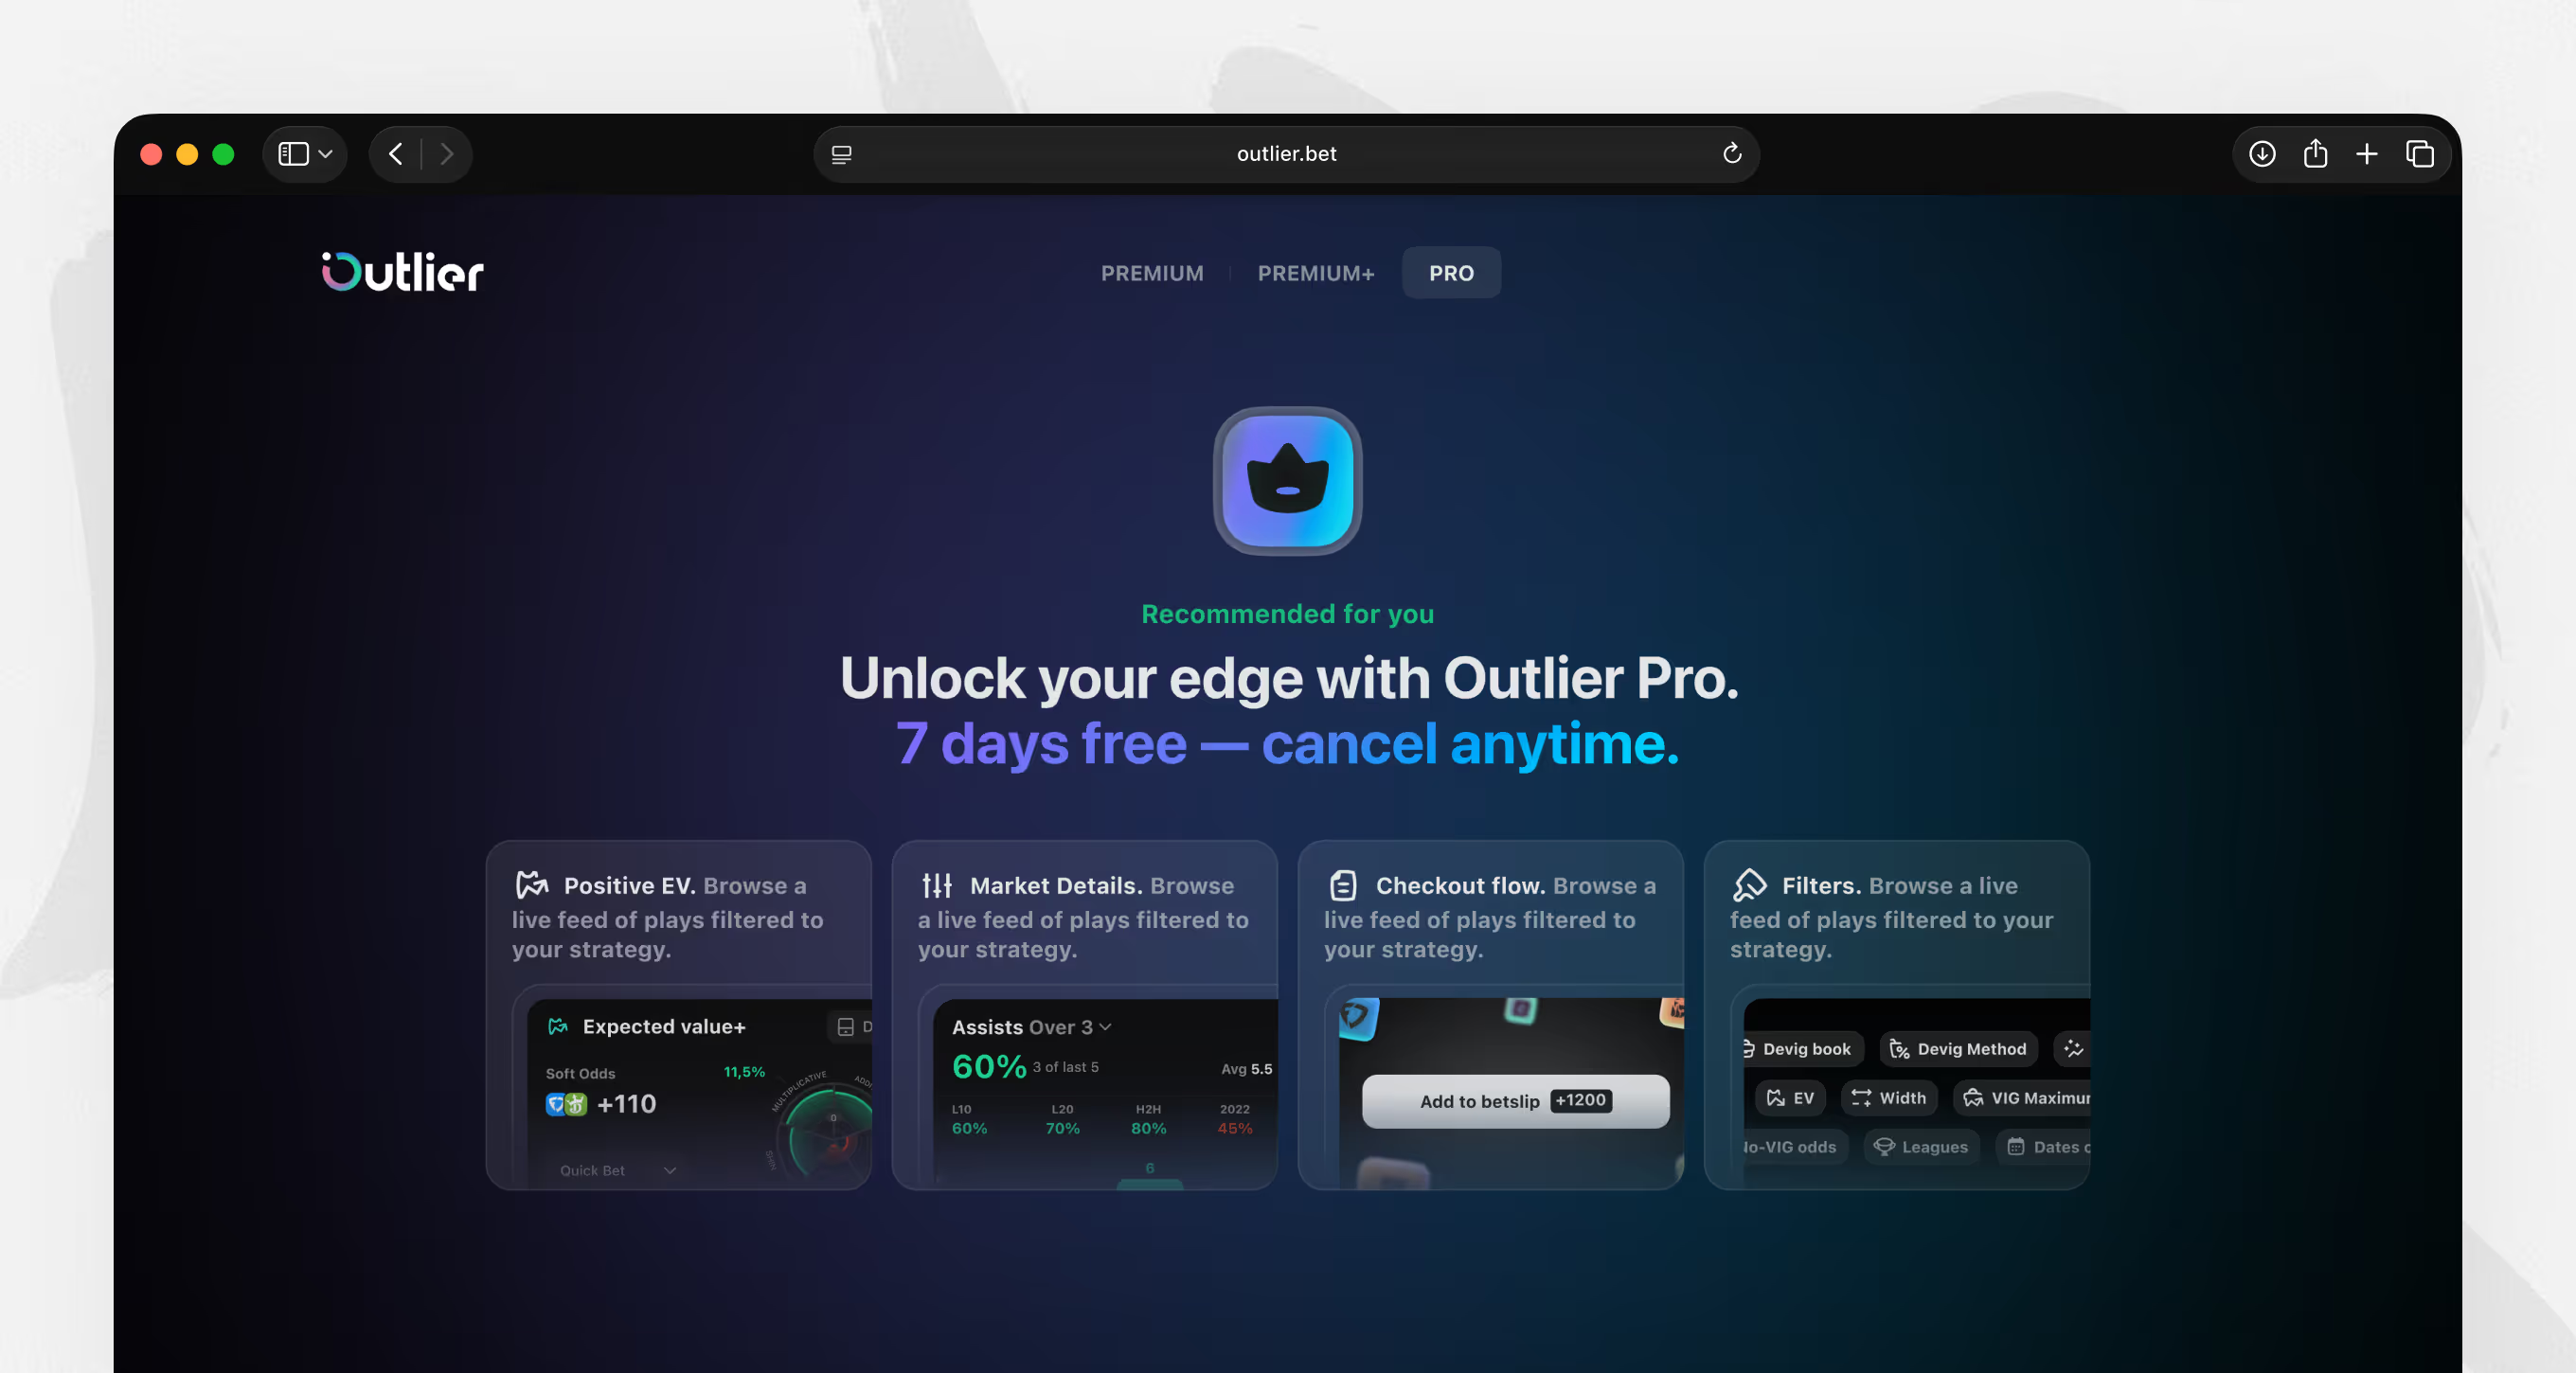
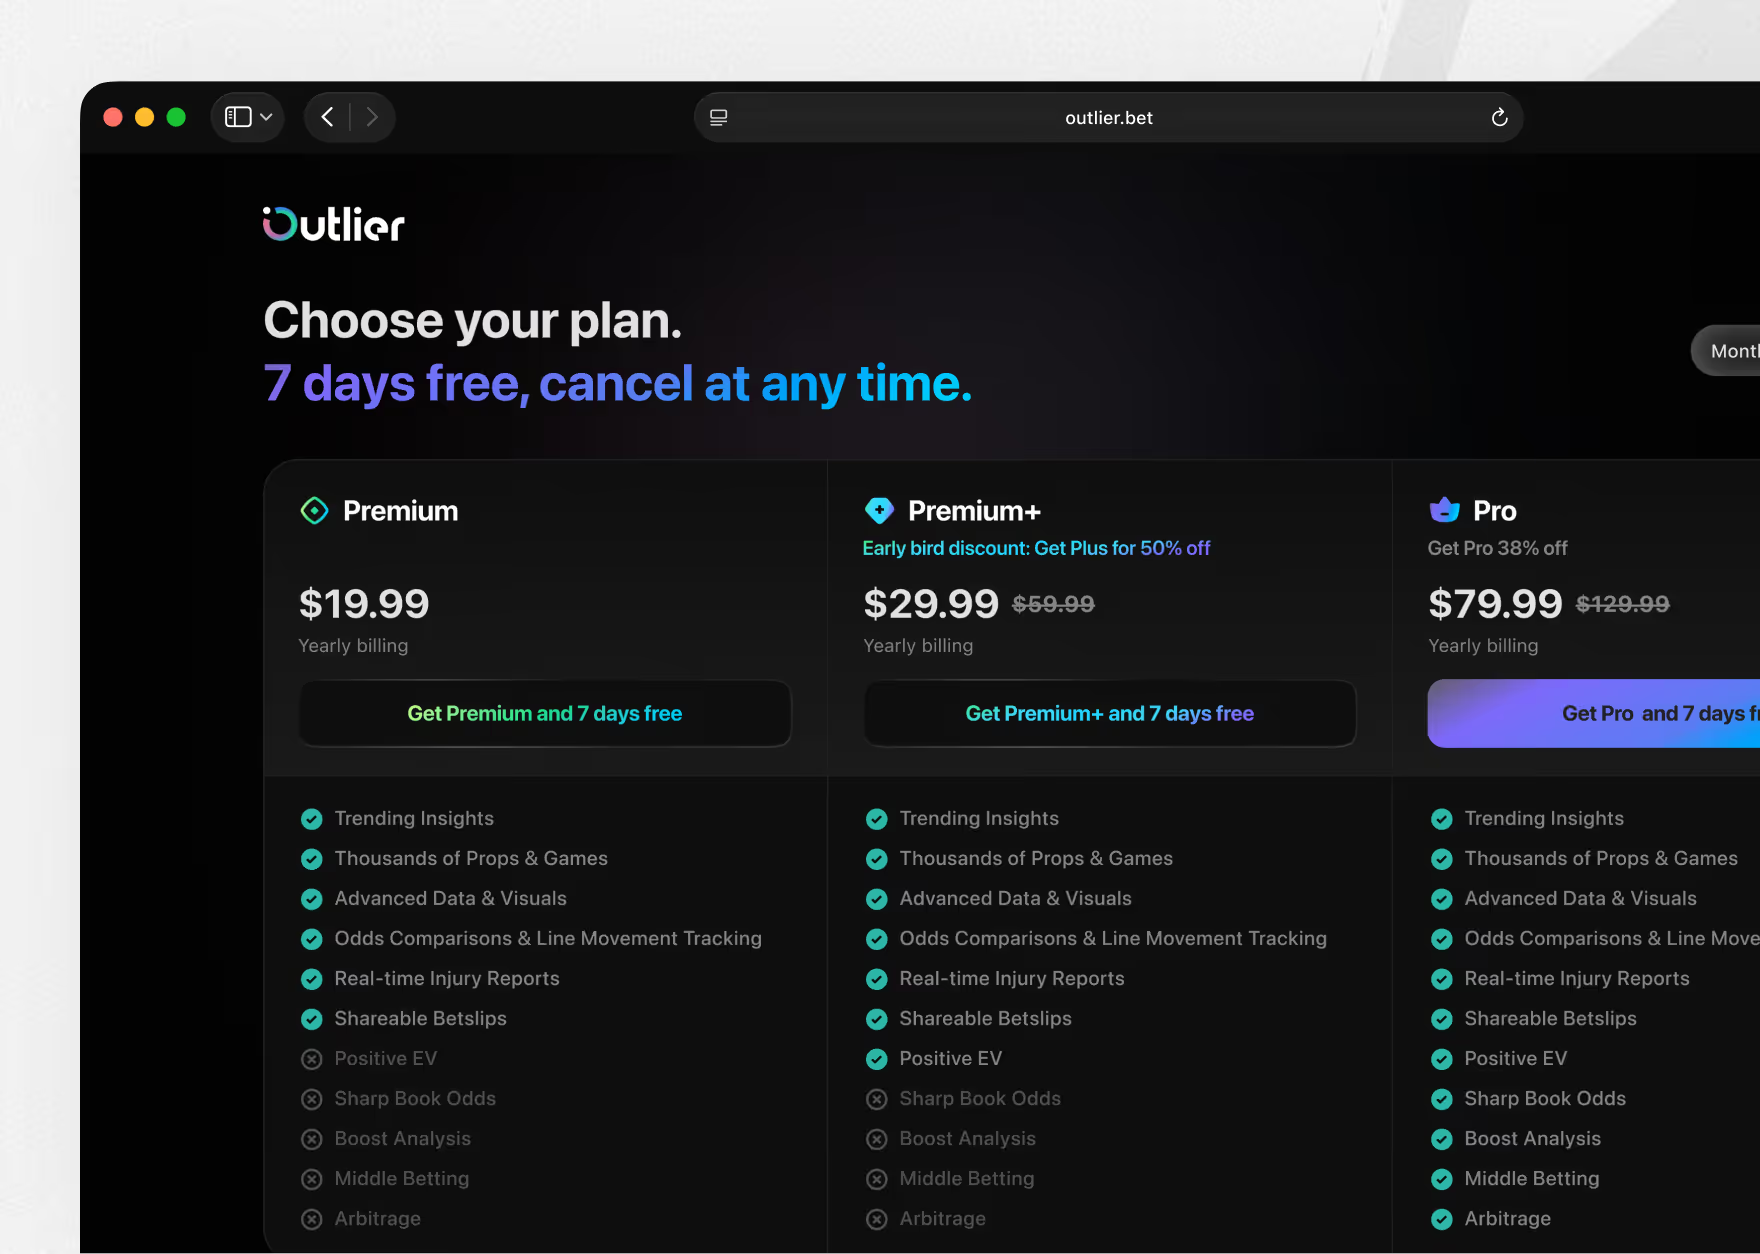
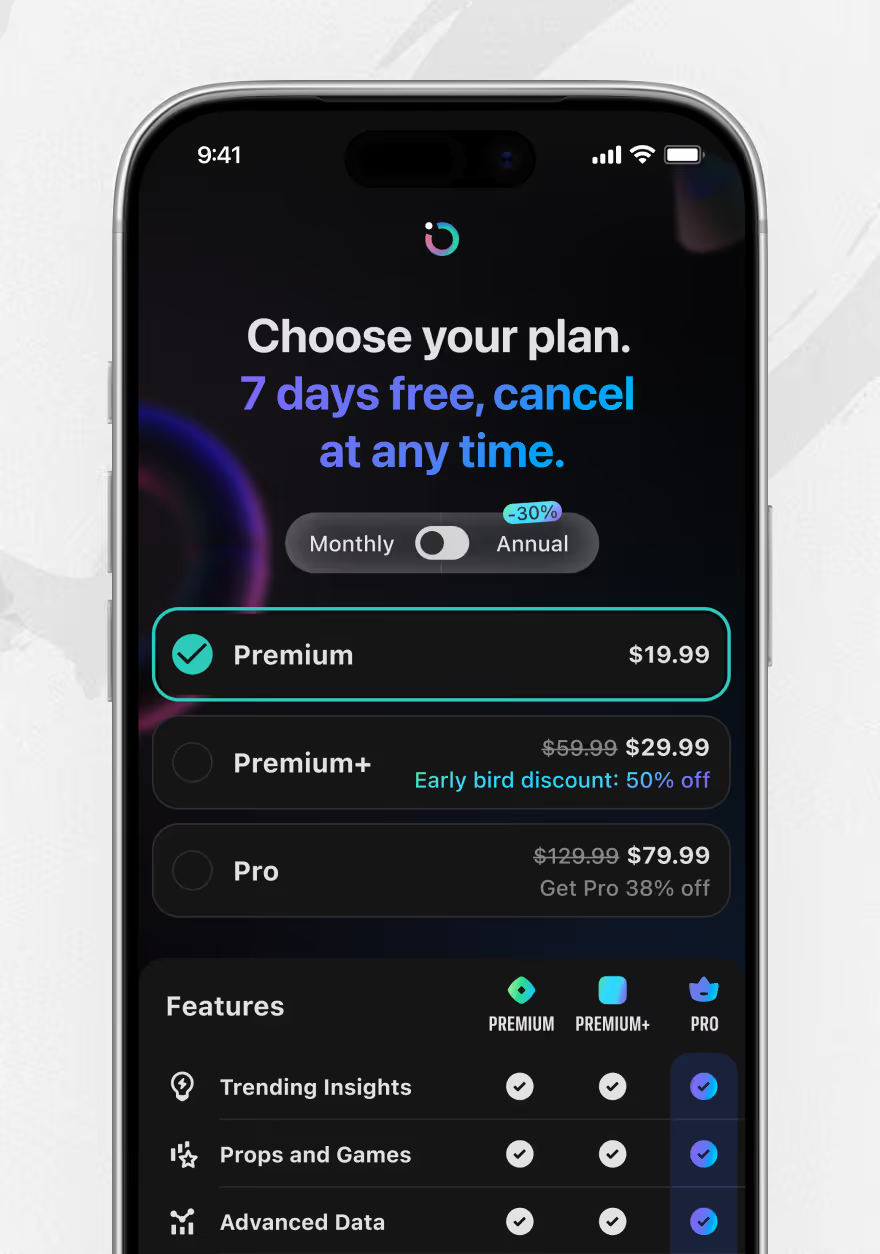
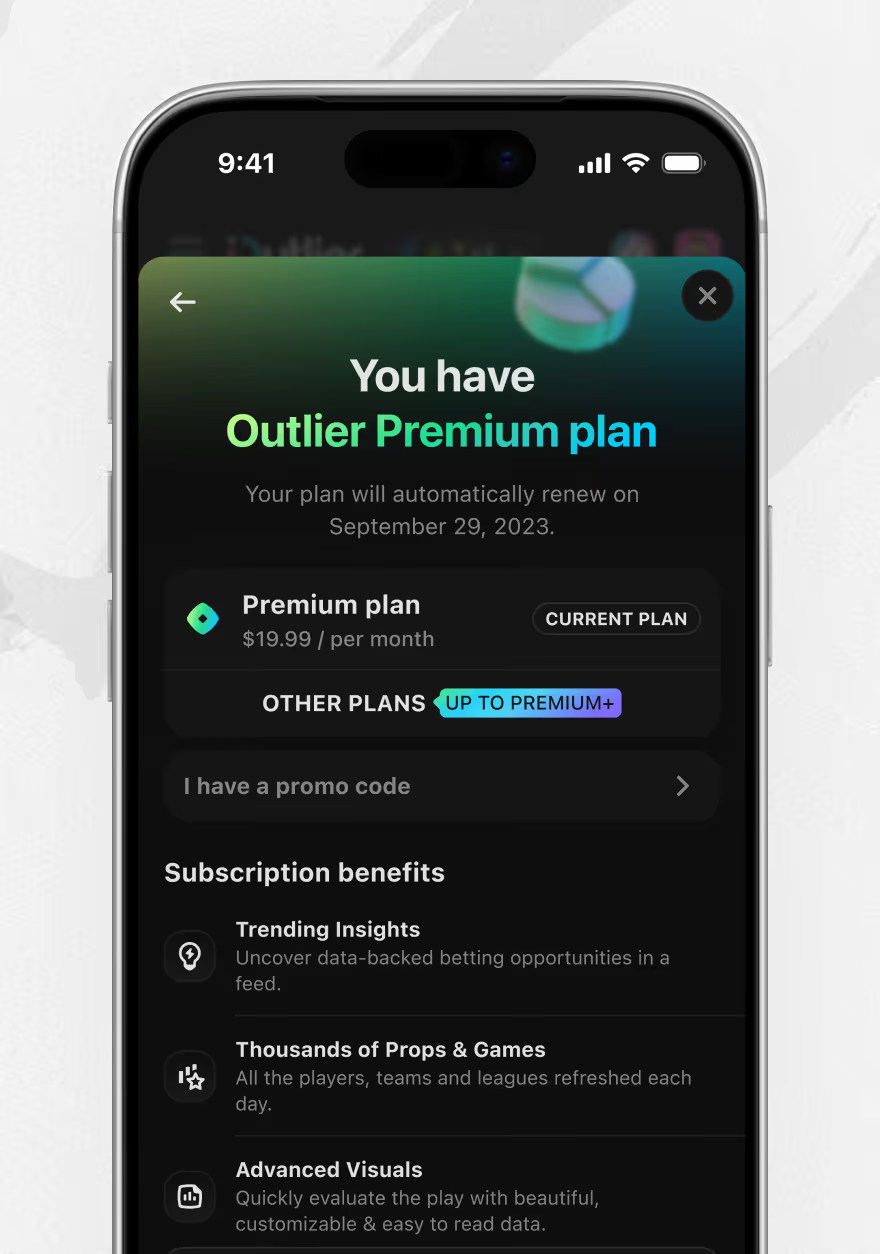
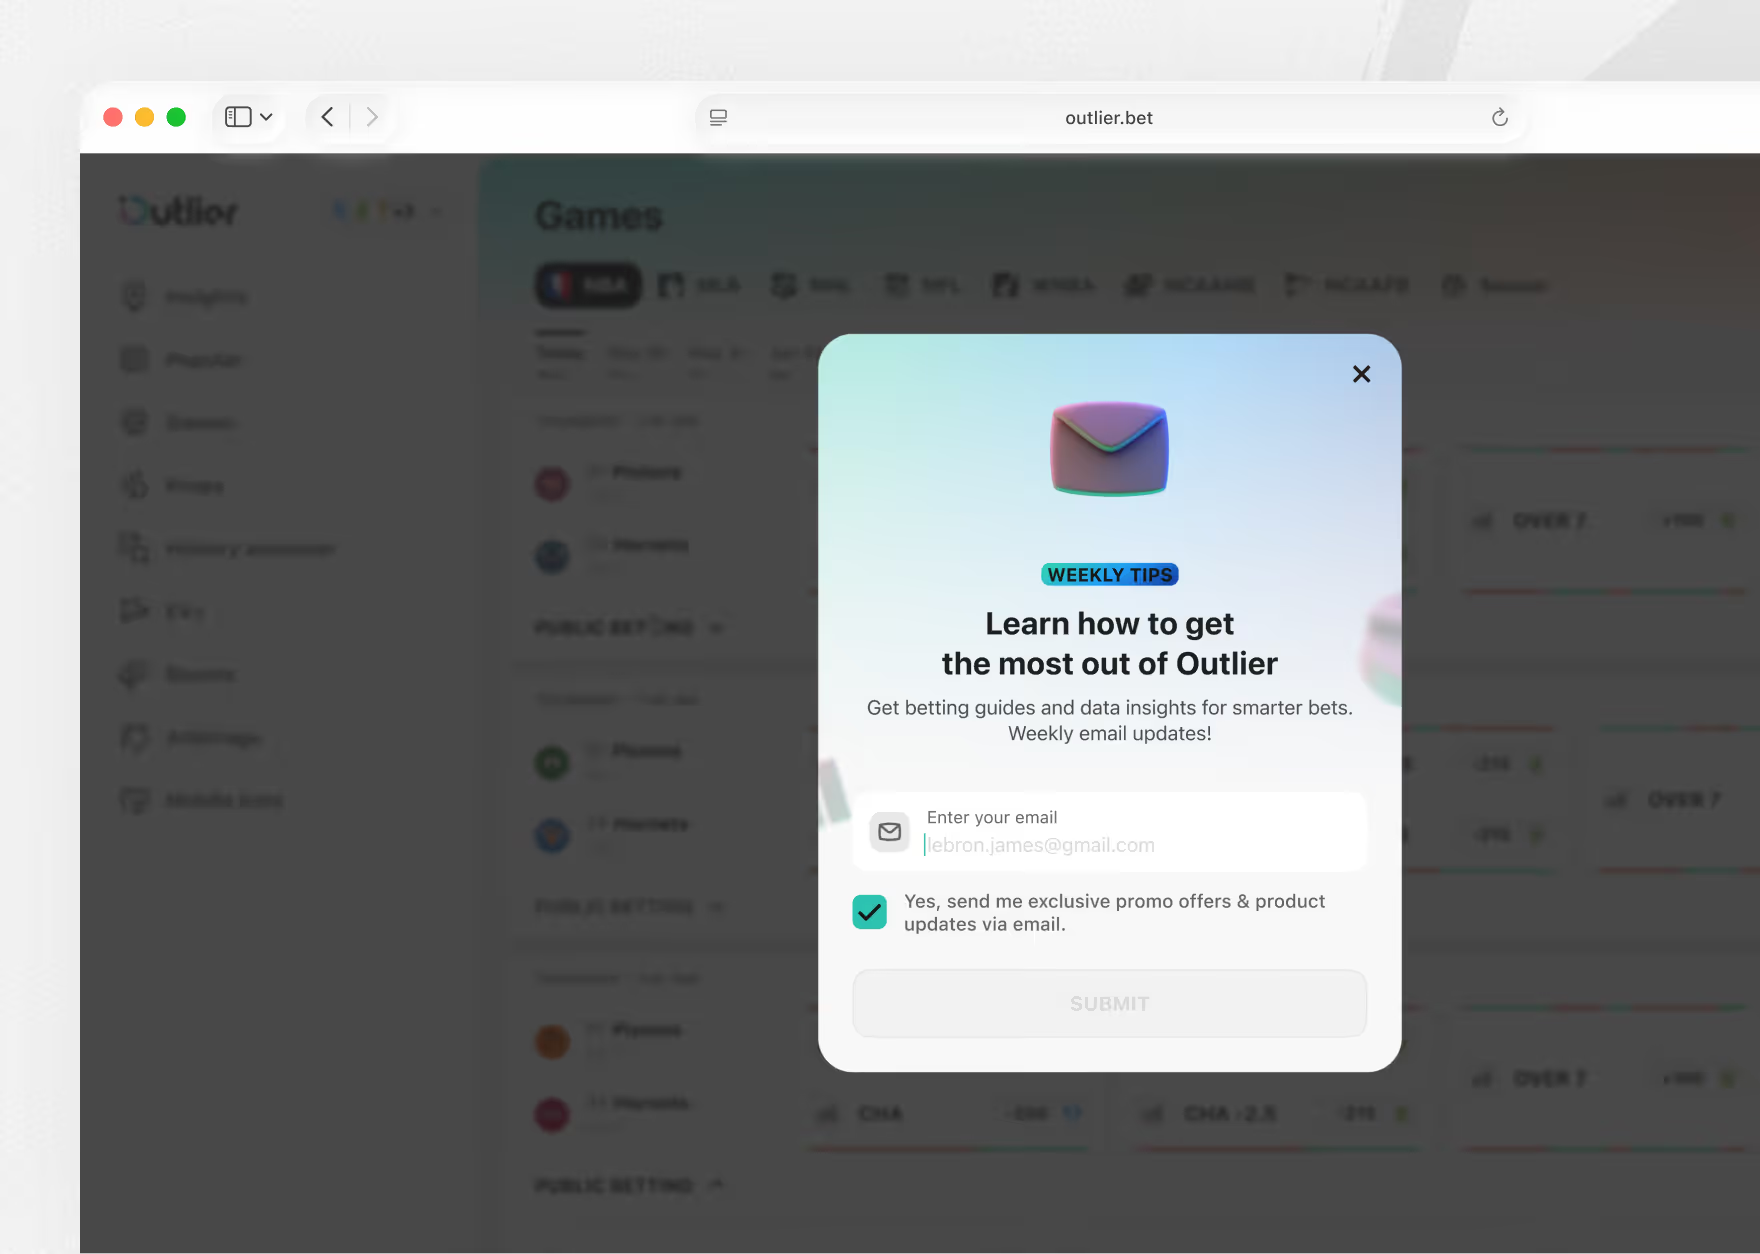
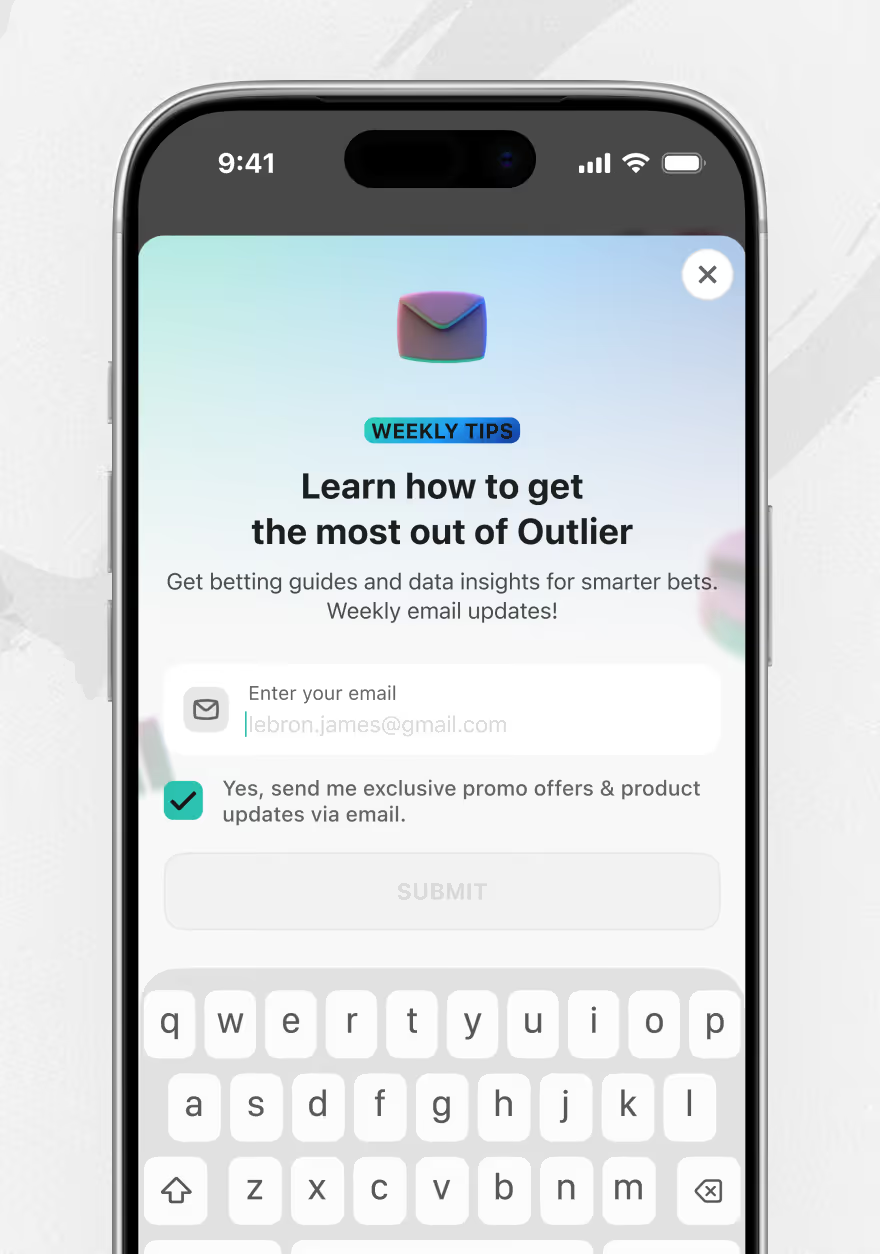
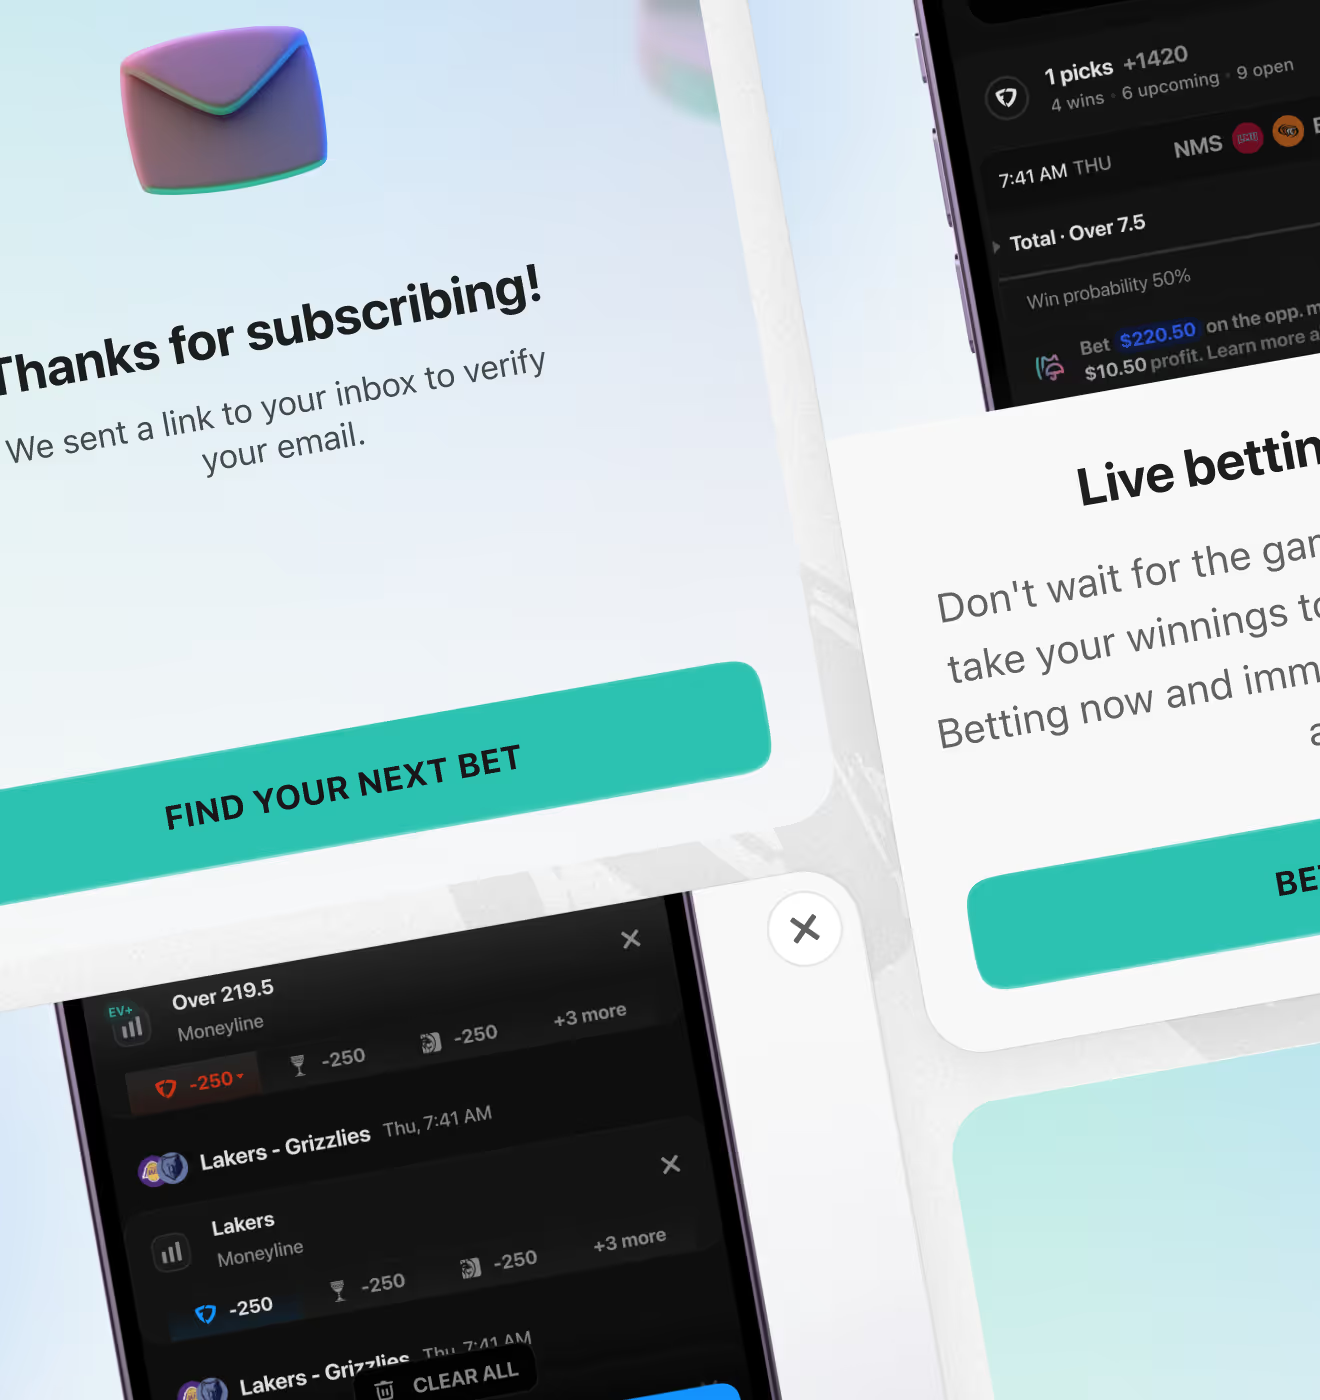
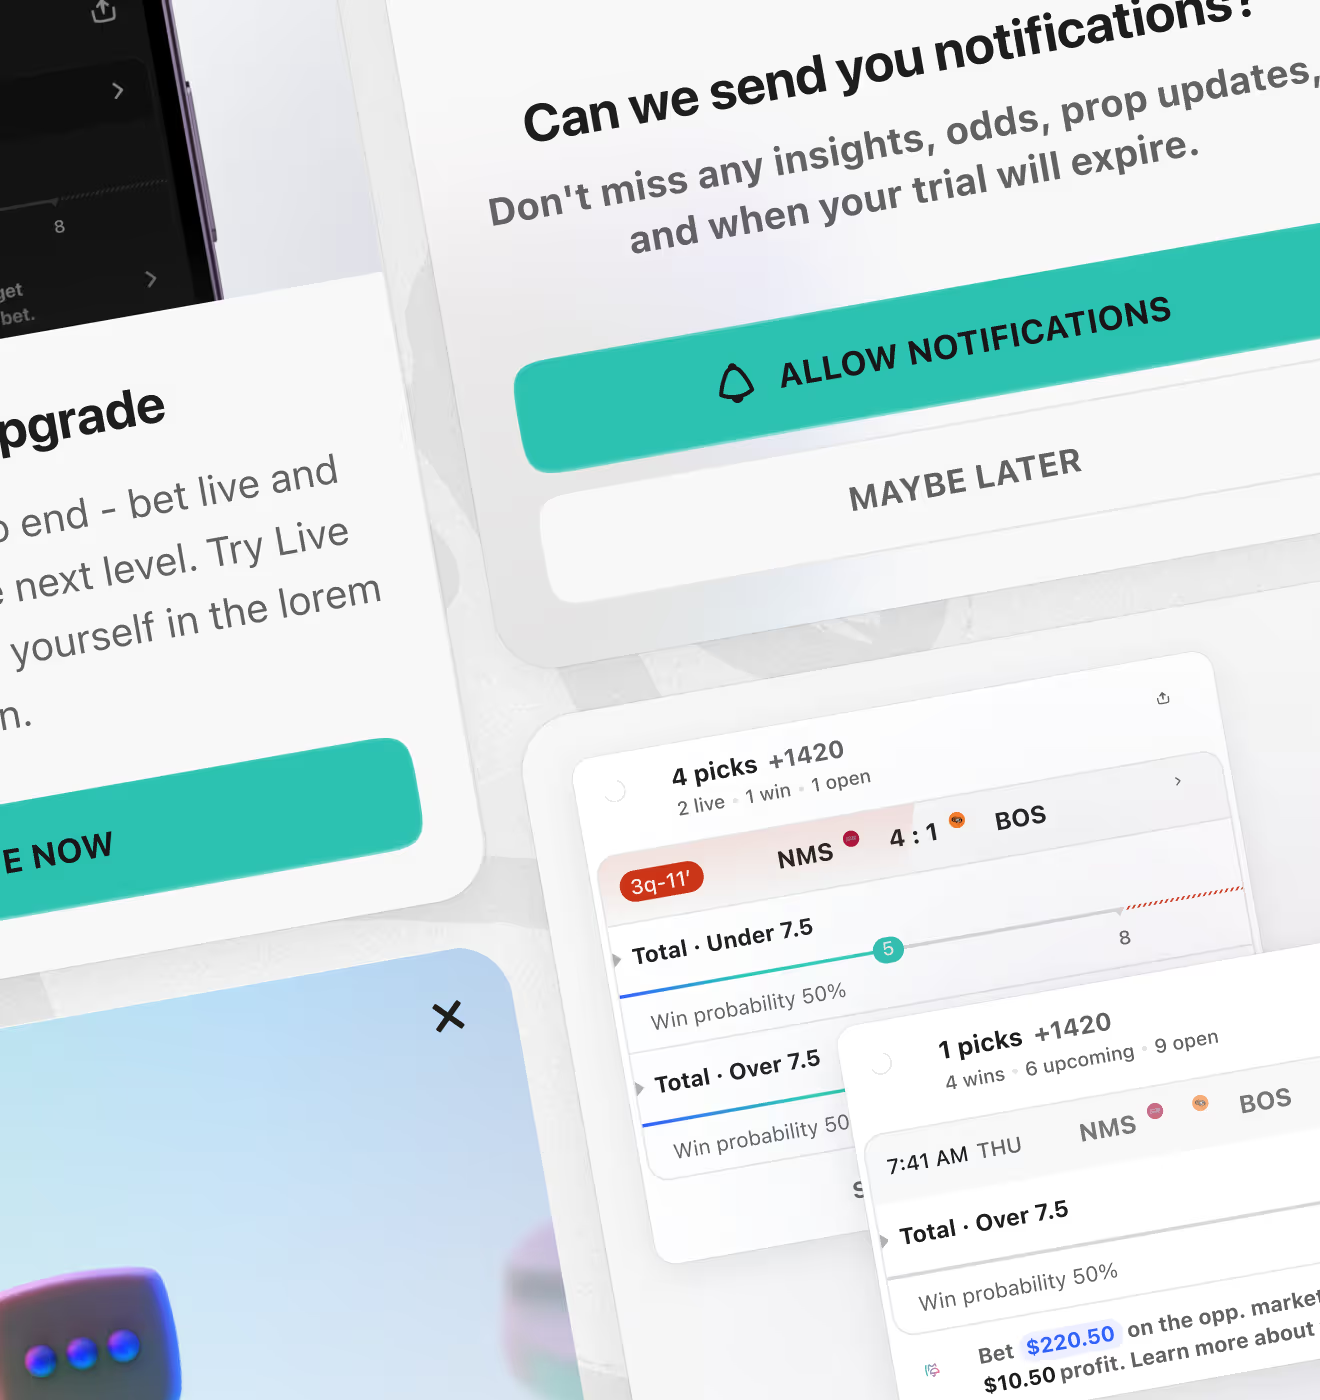
The full new-user flow from onboarding through the subscription paywall. Four onboarding steps set up preferences, then lead to a three-tier paywall.

Starting a data-dense product from zero and want the design system shaped for scale before the first line of code? Day 0 is when we're most useful. Tell us what you're building.