





Oddsjam. Sports Betting Analytics for USA sports.








Summary
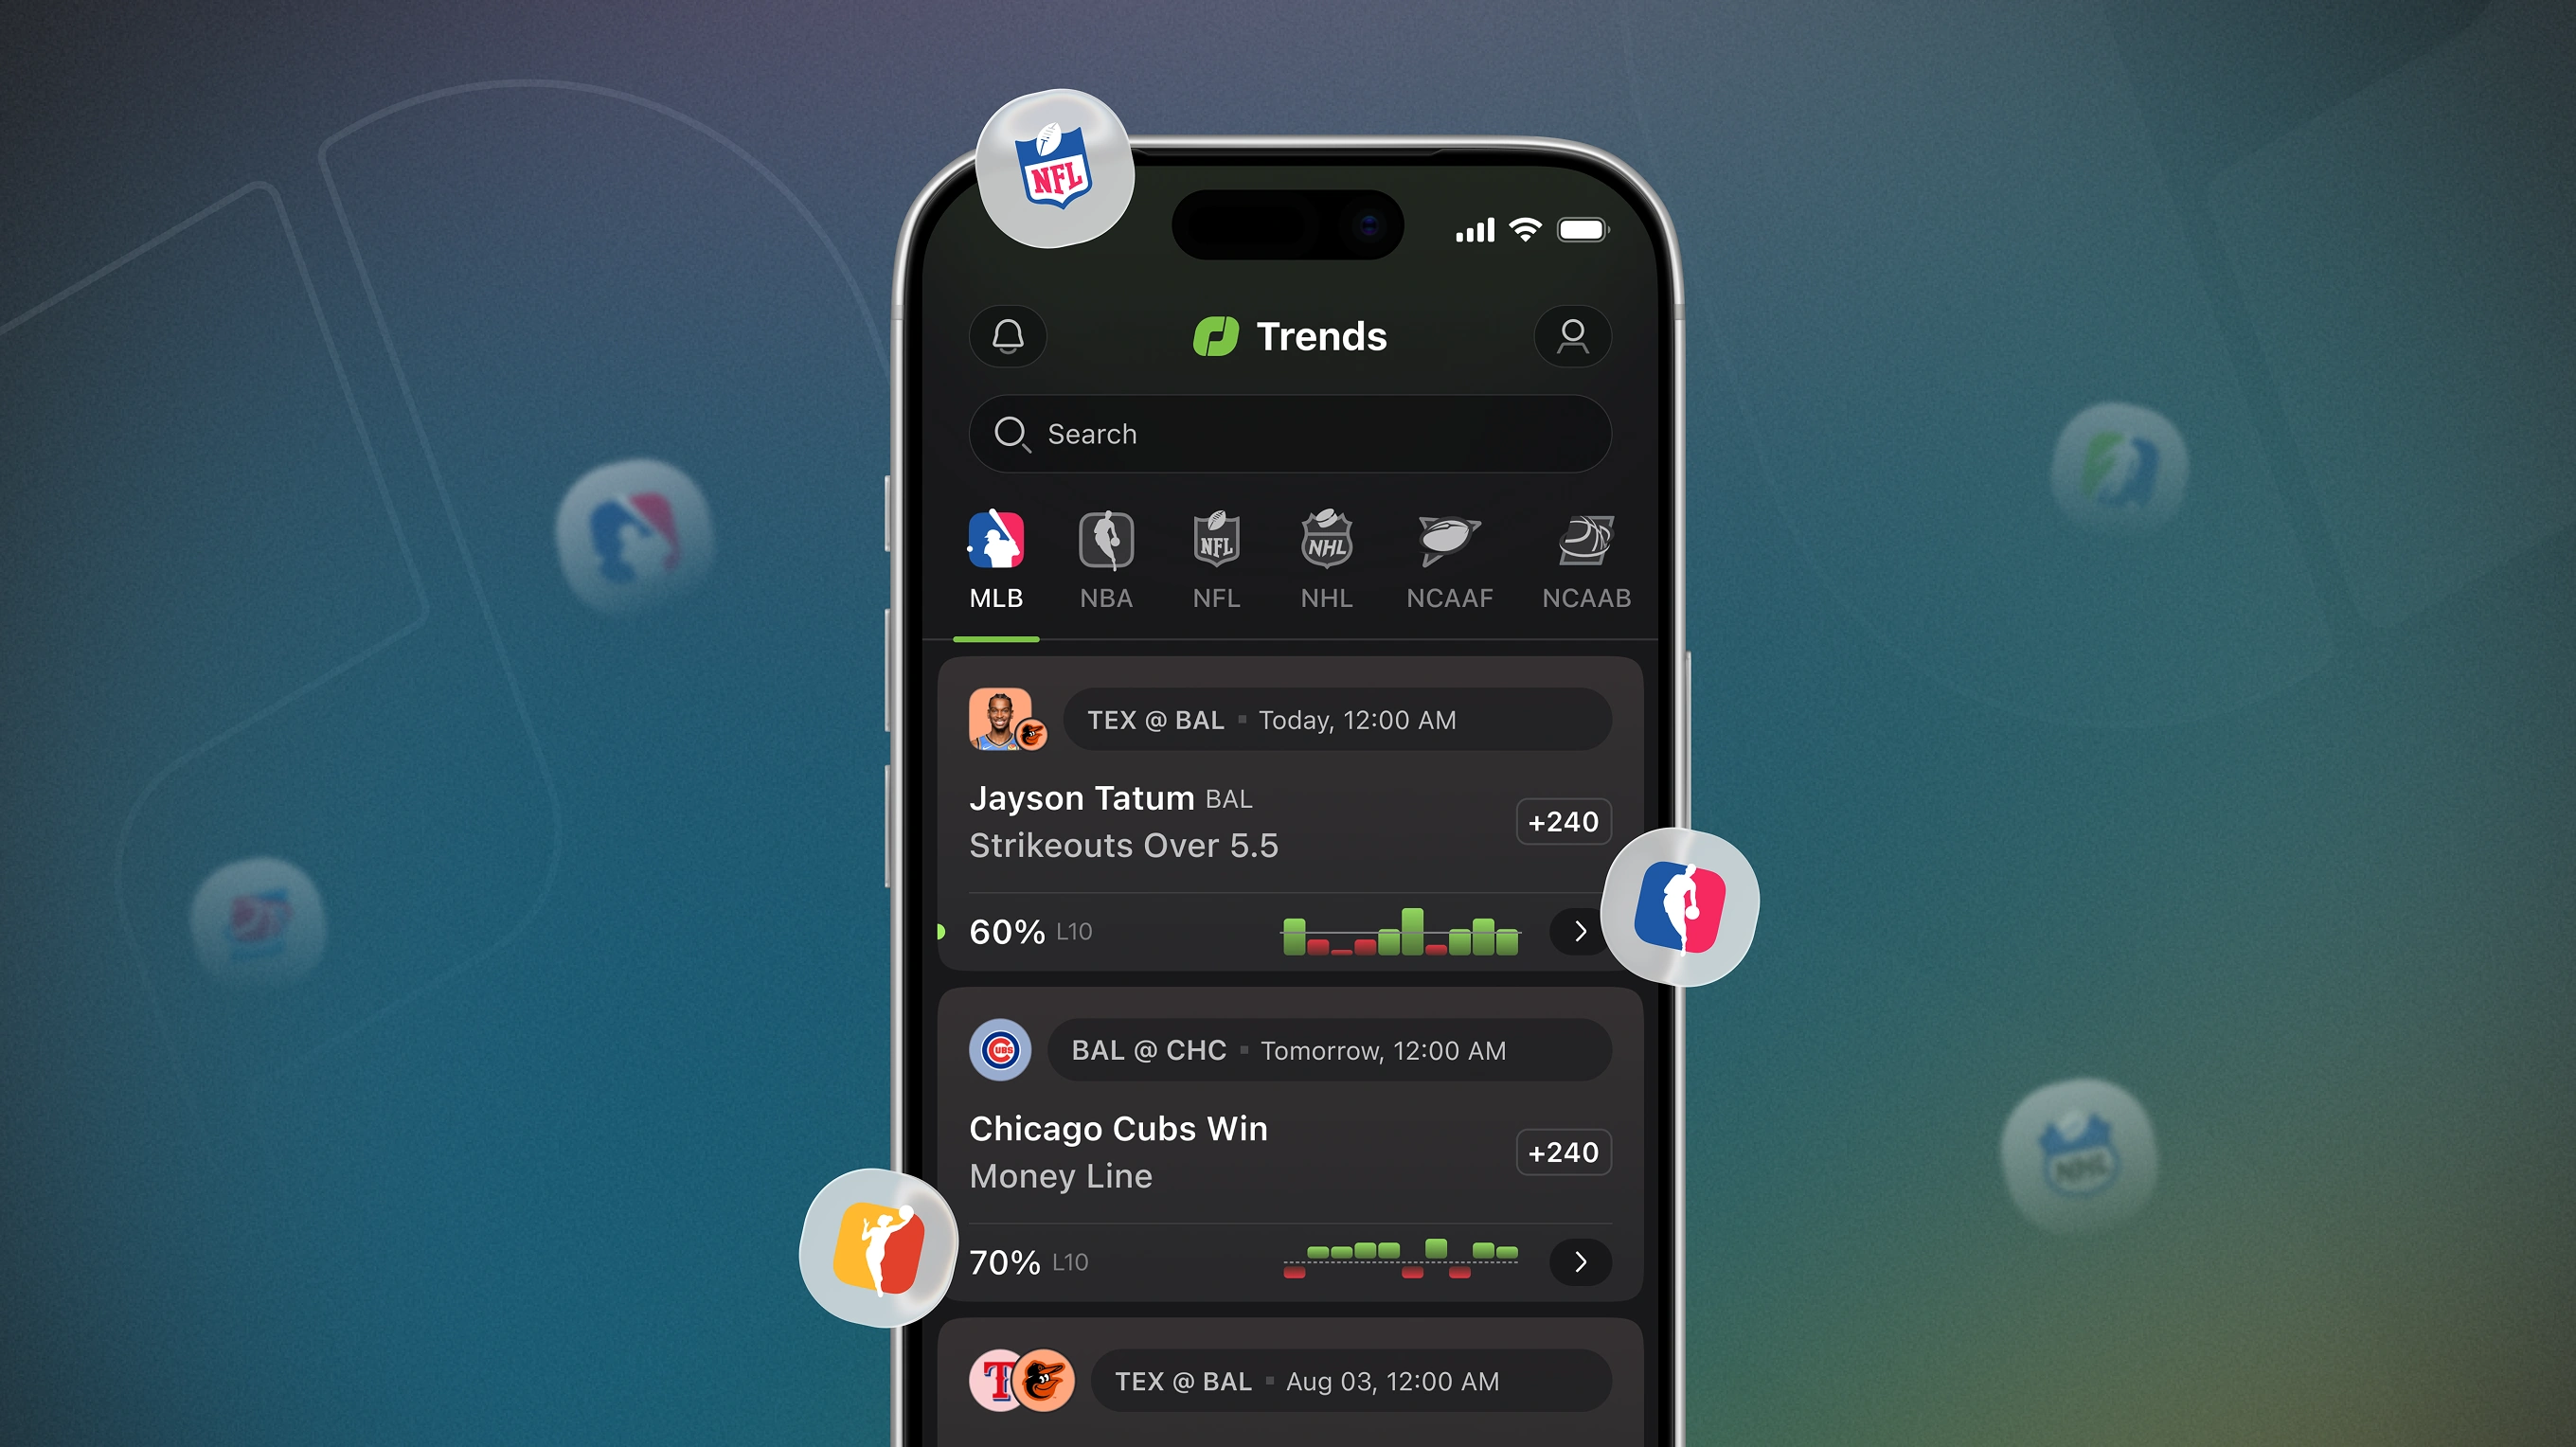
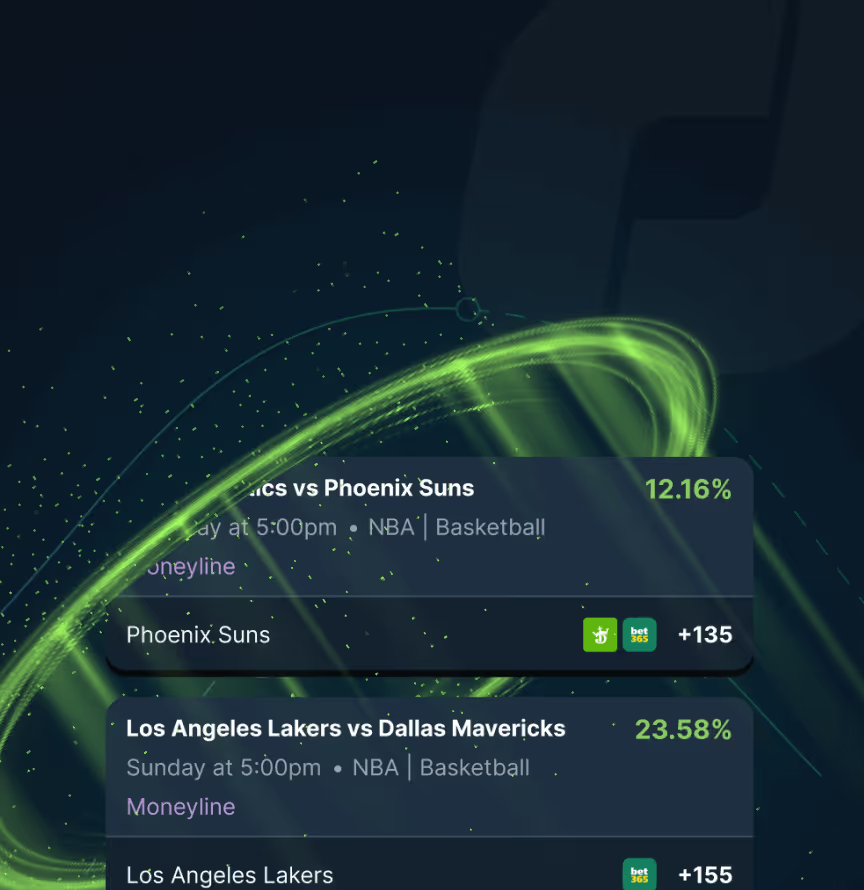
OddsJam is a US sports betting analytics platform, and this iOS project added a simplified section designed as a freemium entry point into its core pro tools. We designed the flow from onboarding and registration through market scanning, granular betting line breakdown — head-to-head trends, over/under lines with volume and limit tracking, dynamic market switching — to the premium subscription layer with tiered plans.
The central UX problem was data meaning: a negative sports trend indicator can still support a positive betting decision, so the visual logic had to communicate direction, value, and betting relevance without confusing users. We built a scalable UI system for high-density data — a high-contrast palette for instant readability, an adaptive grid with mobile card layouts, and custom sport and trend icons for rapid scanning — using state-flexible layouts that keep the section integrated with the existing OddsJam product while lowering the entry barrier for new users.
Component overview. Core cards, icons, and controls.
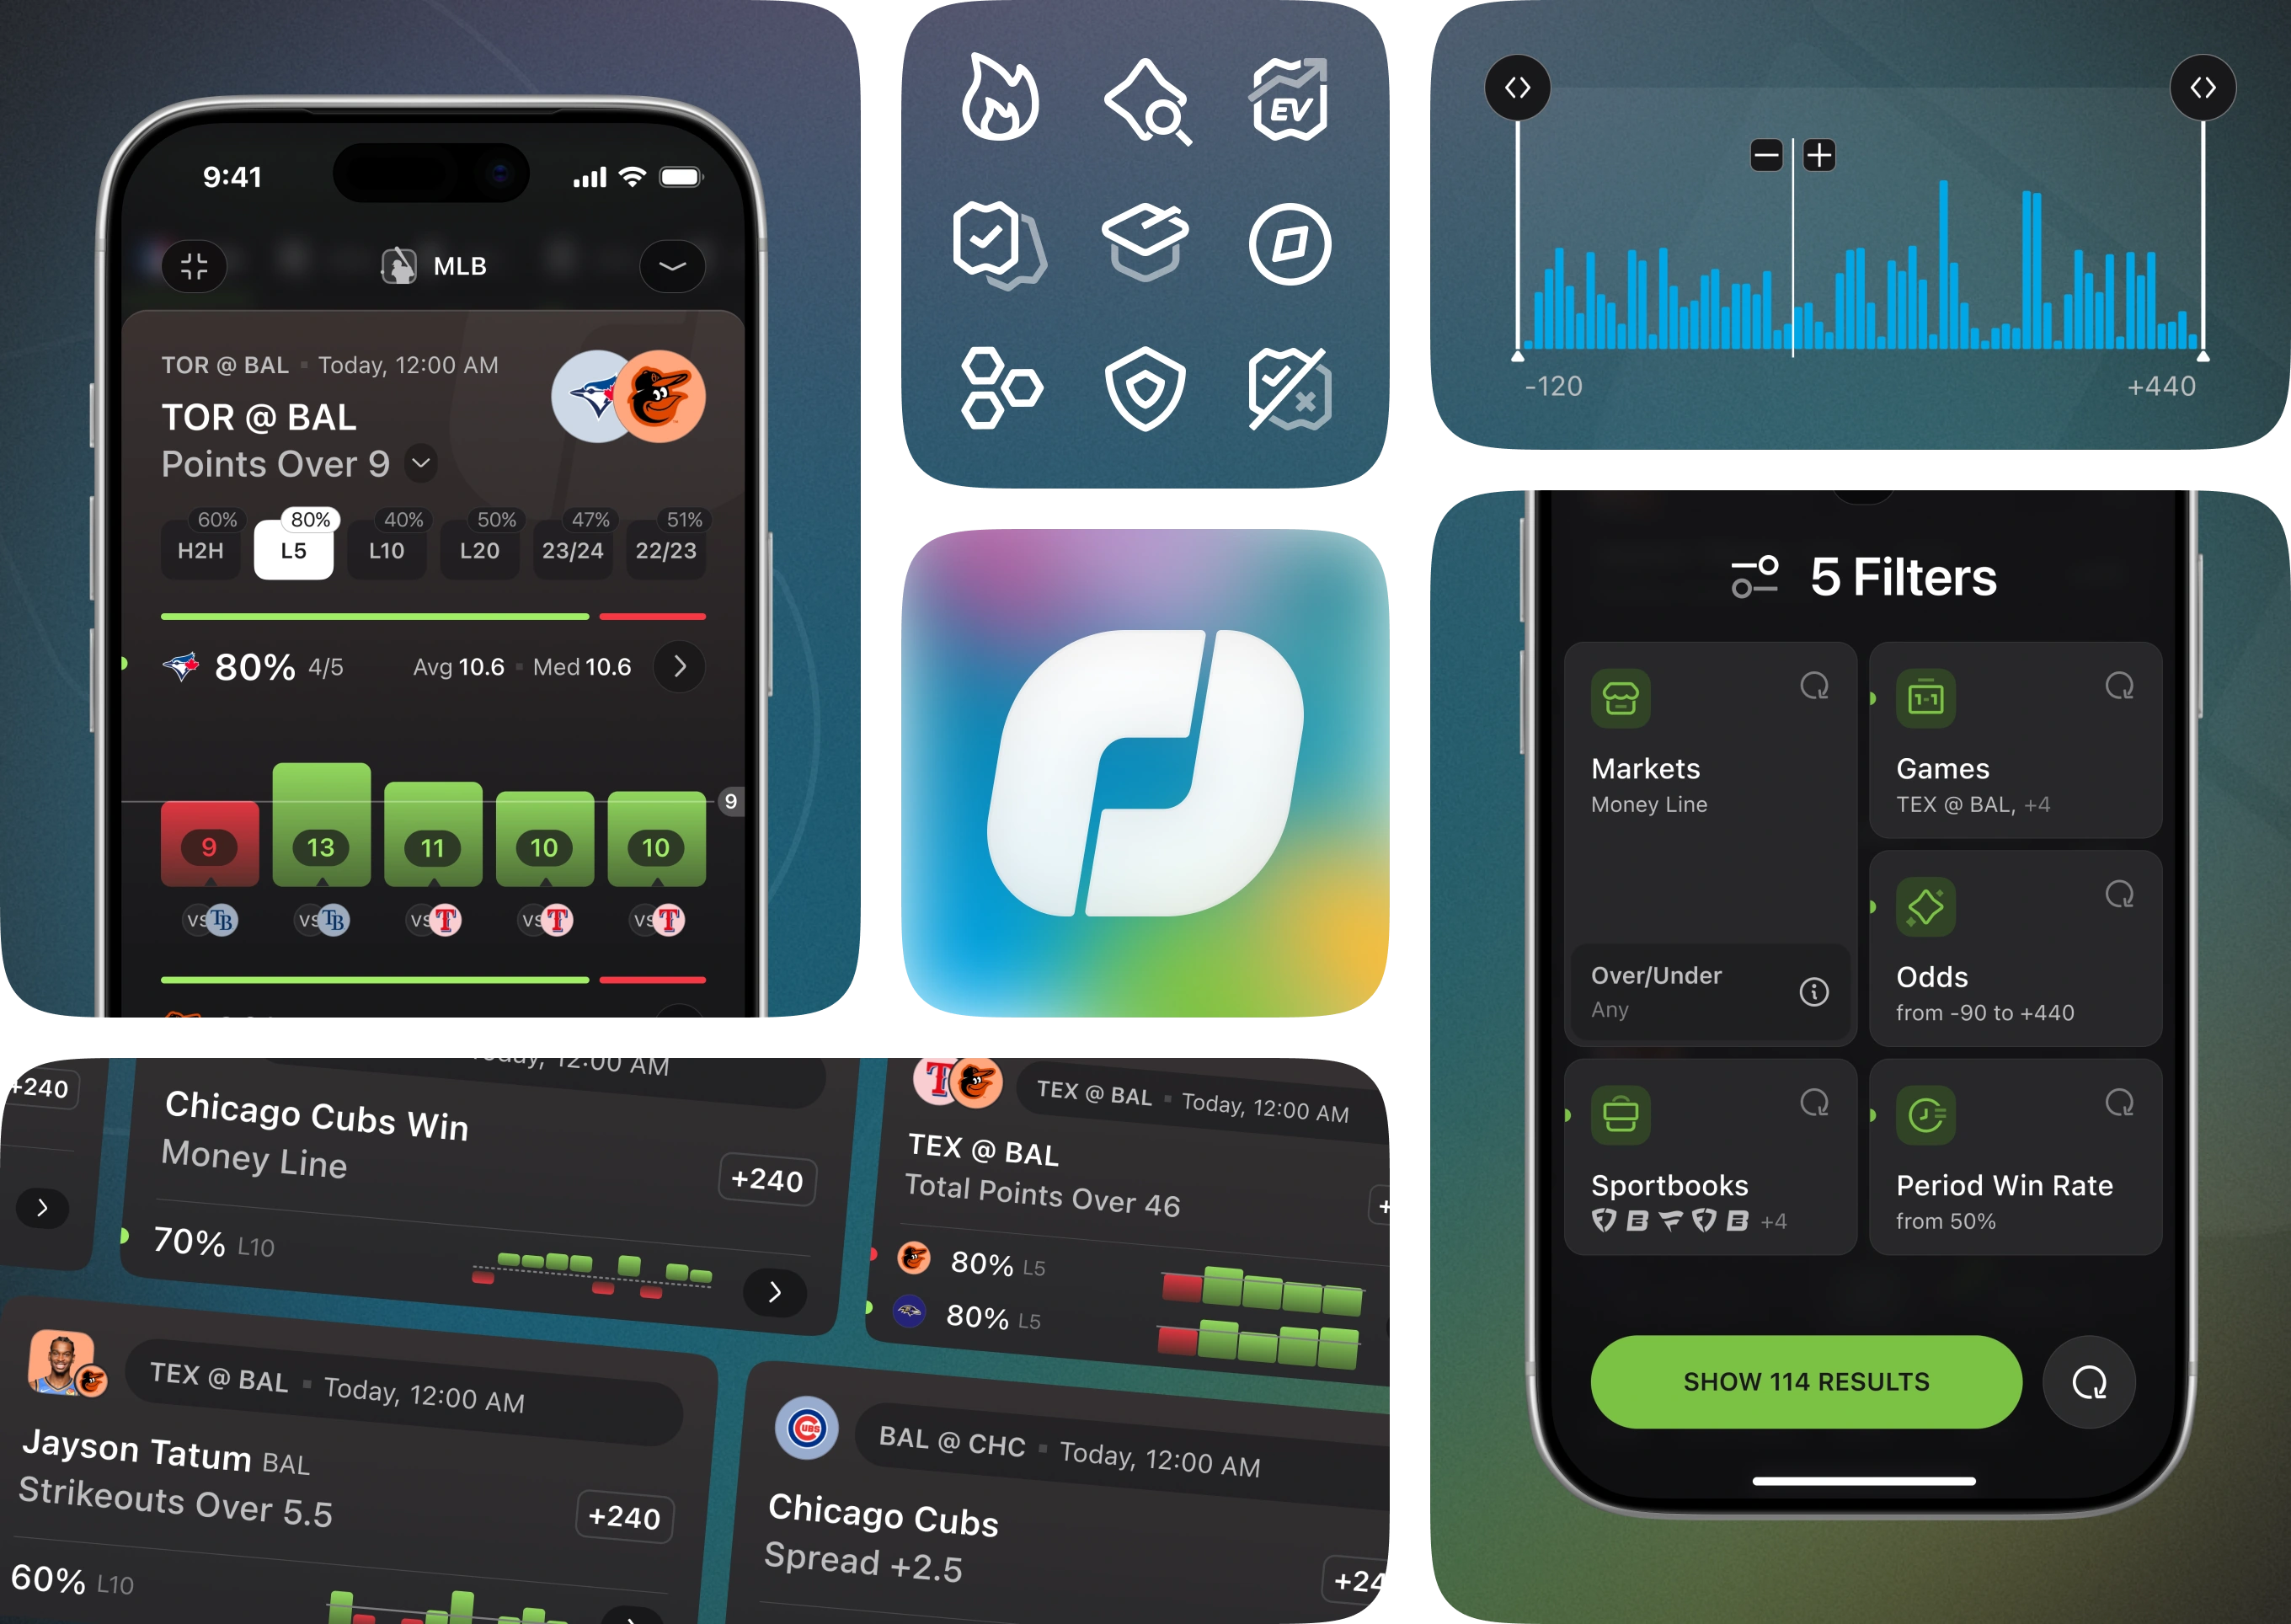
A preview of the core interface elements built for OddsJam's sports betting analytics platform: a prop card, a custom icon set, an odds range slider, and a 5-filter panel used throughout the section.
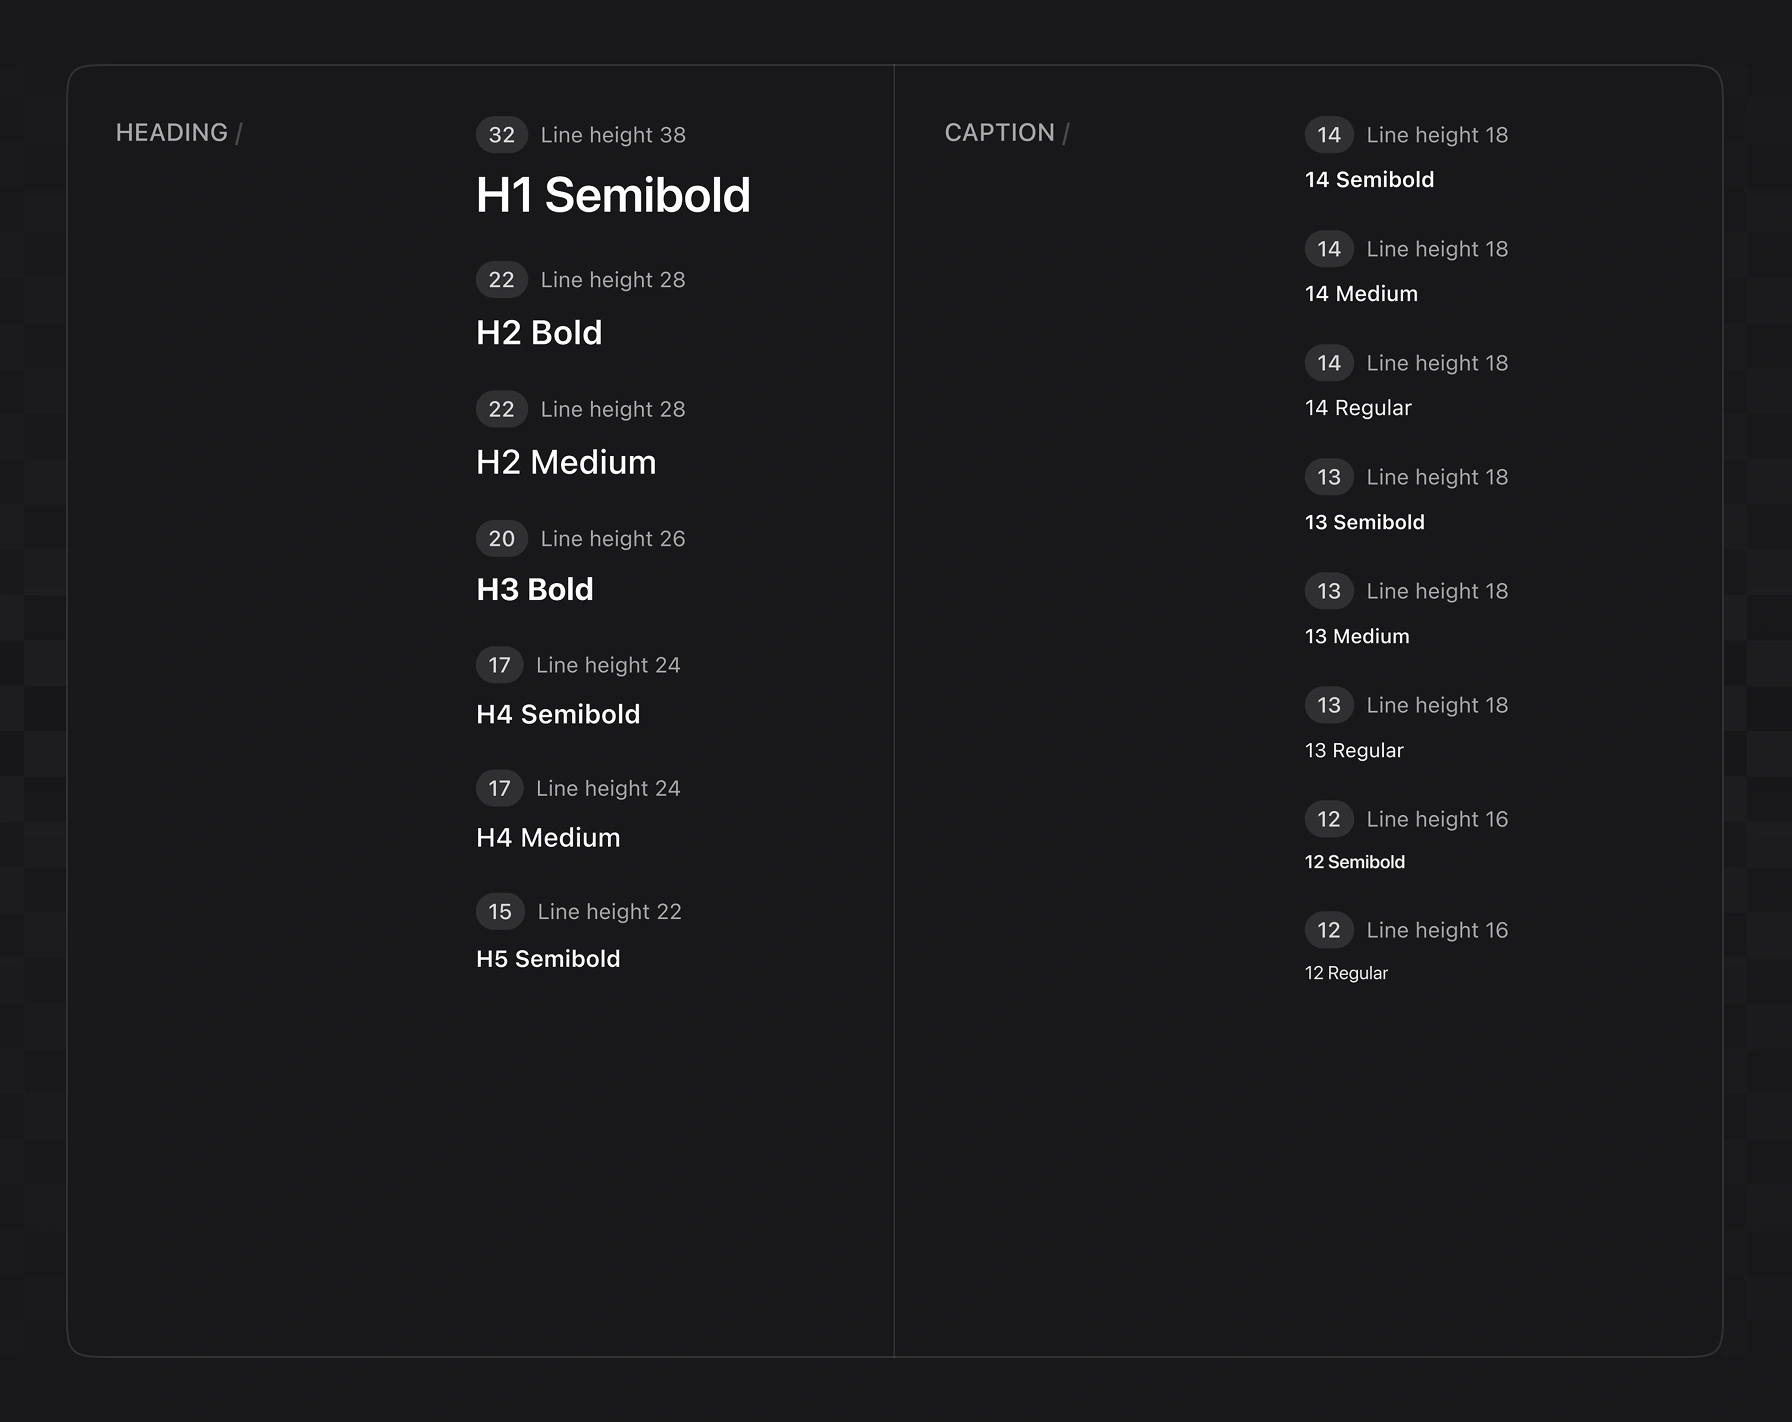
Typography scale. Hierarchy for data-dense screens.
Typographic scale sized for data-dense prop cards. Seven text styles and multiple font weights keep dense stat tables and odds figures readable on mobile.
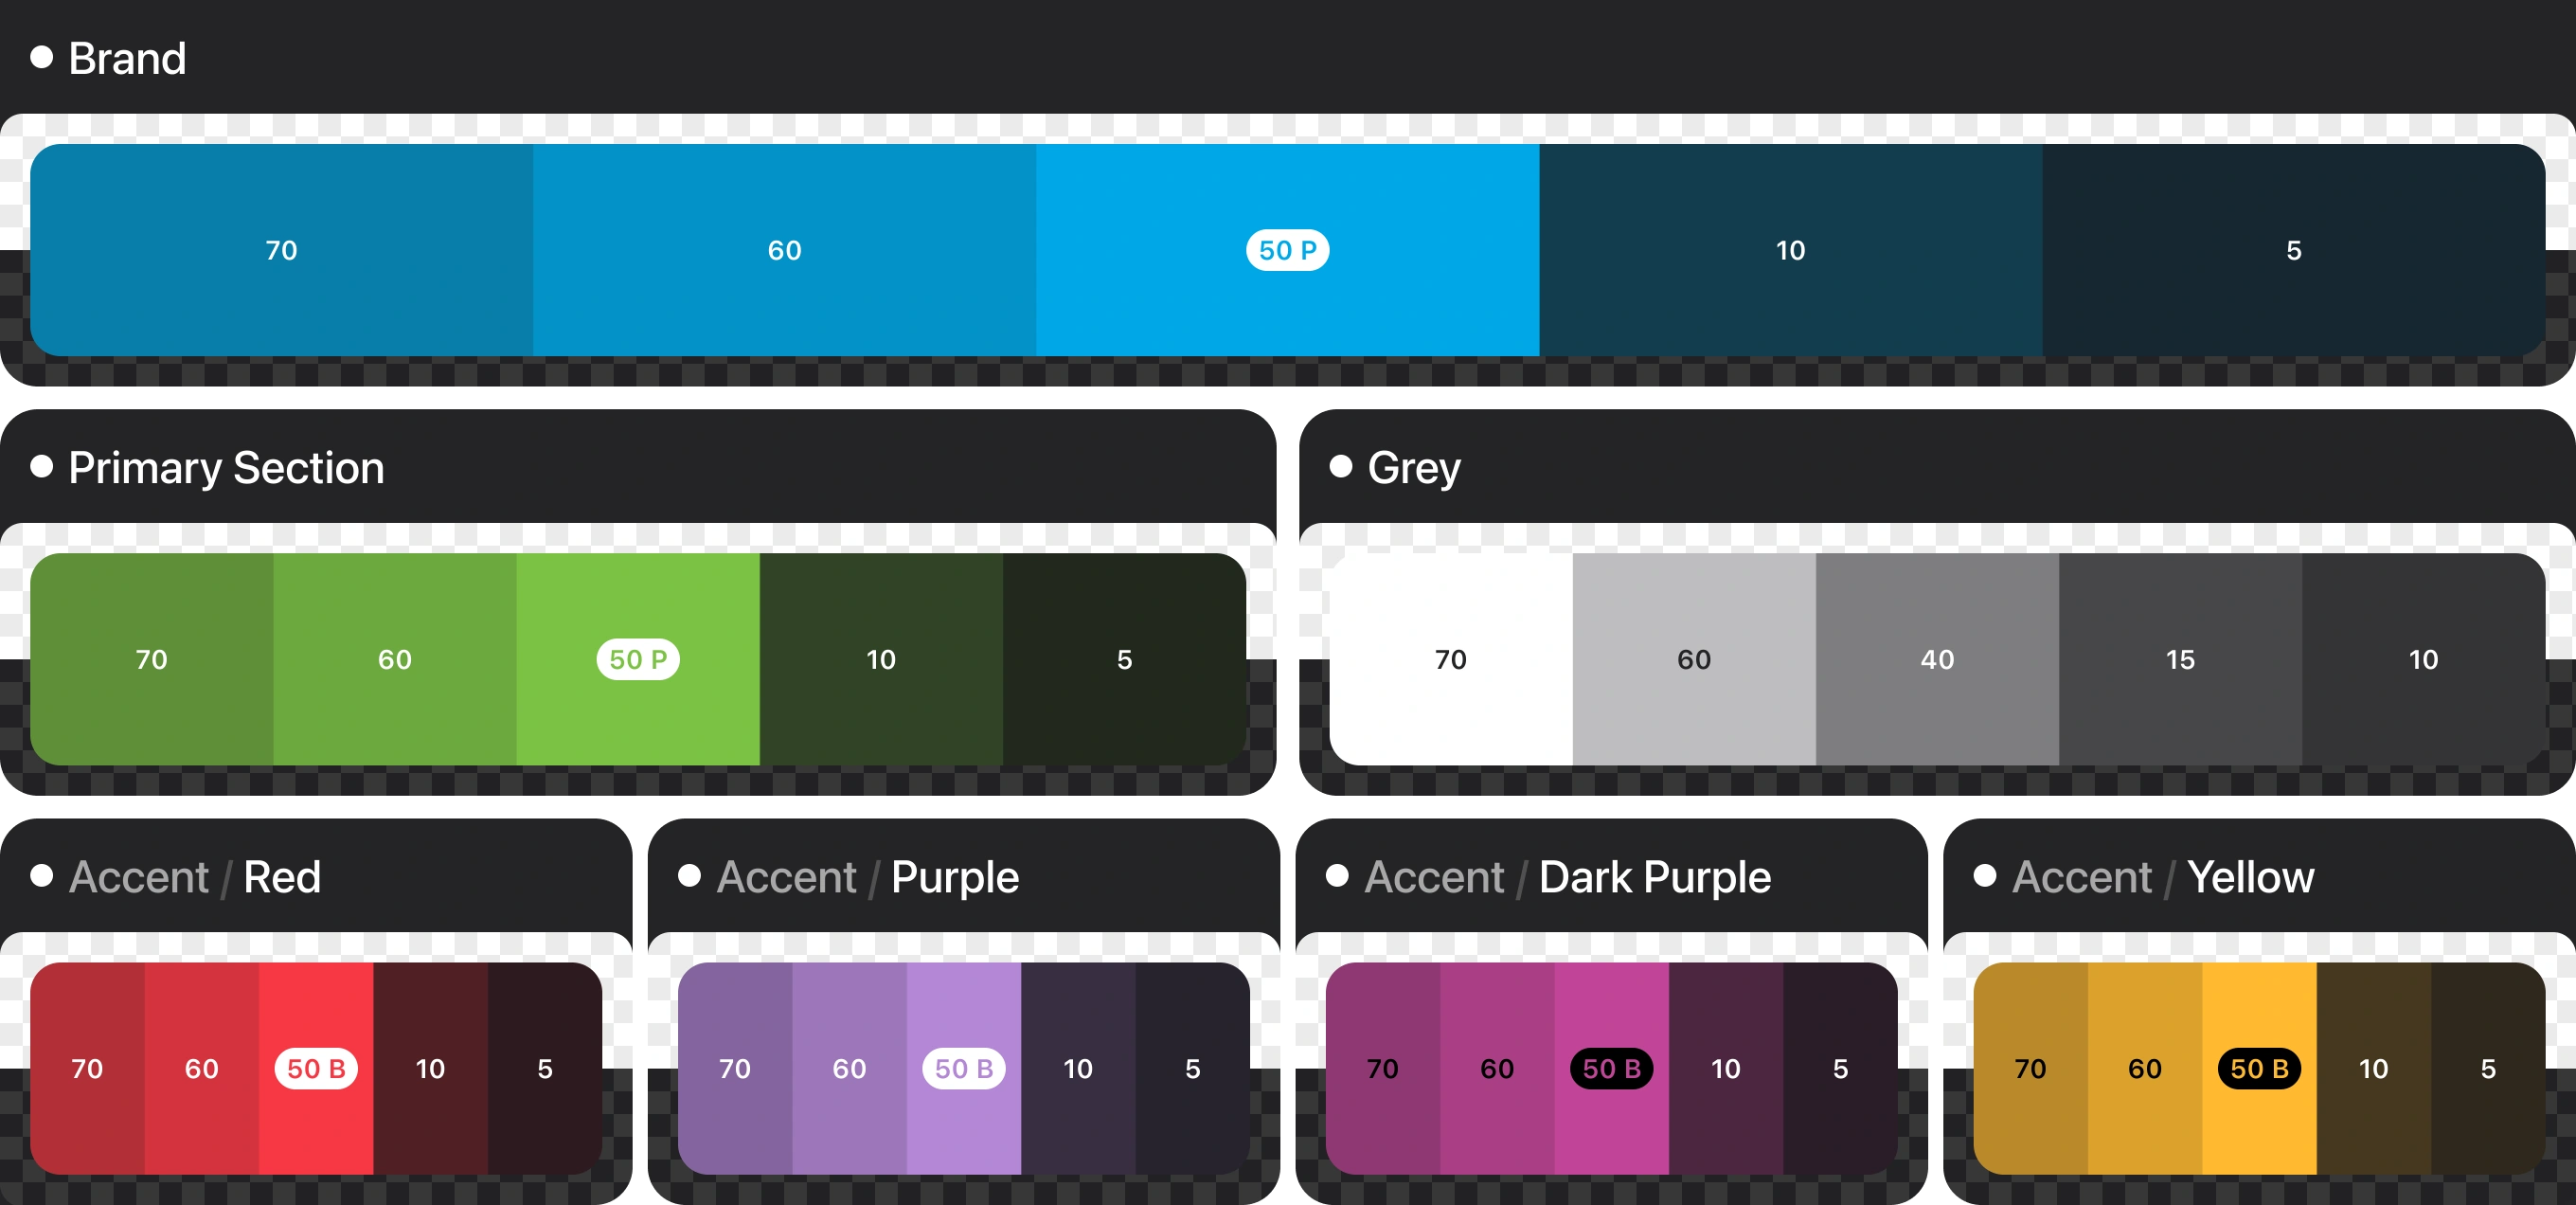
Color system tuned for fast scanning of hit-rate states. Green, grey, red, purple, and yellow scales each include five tints, from base to accent.
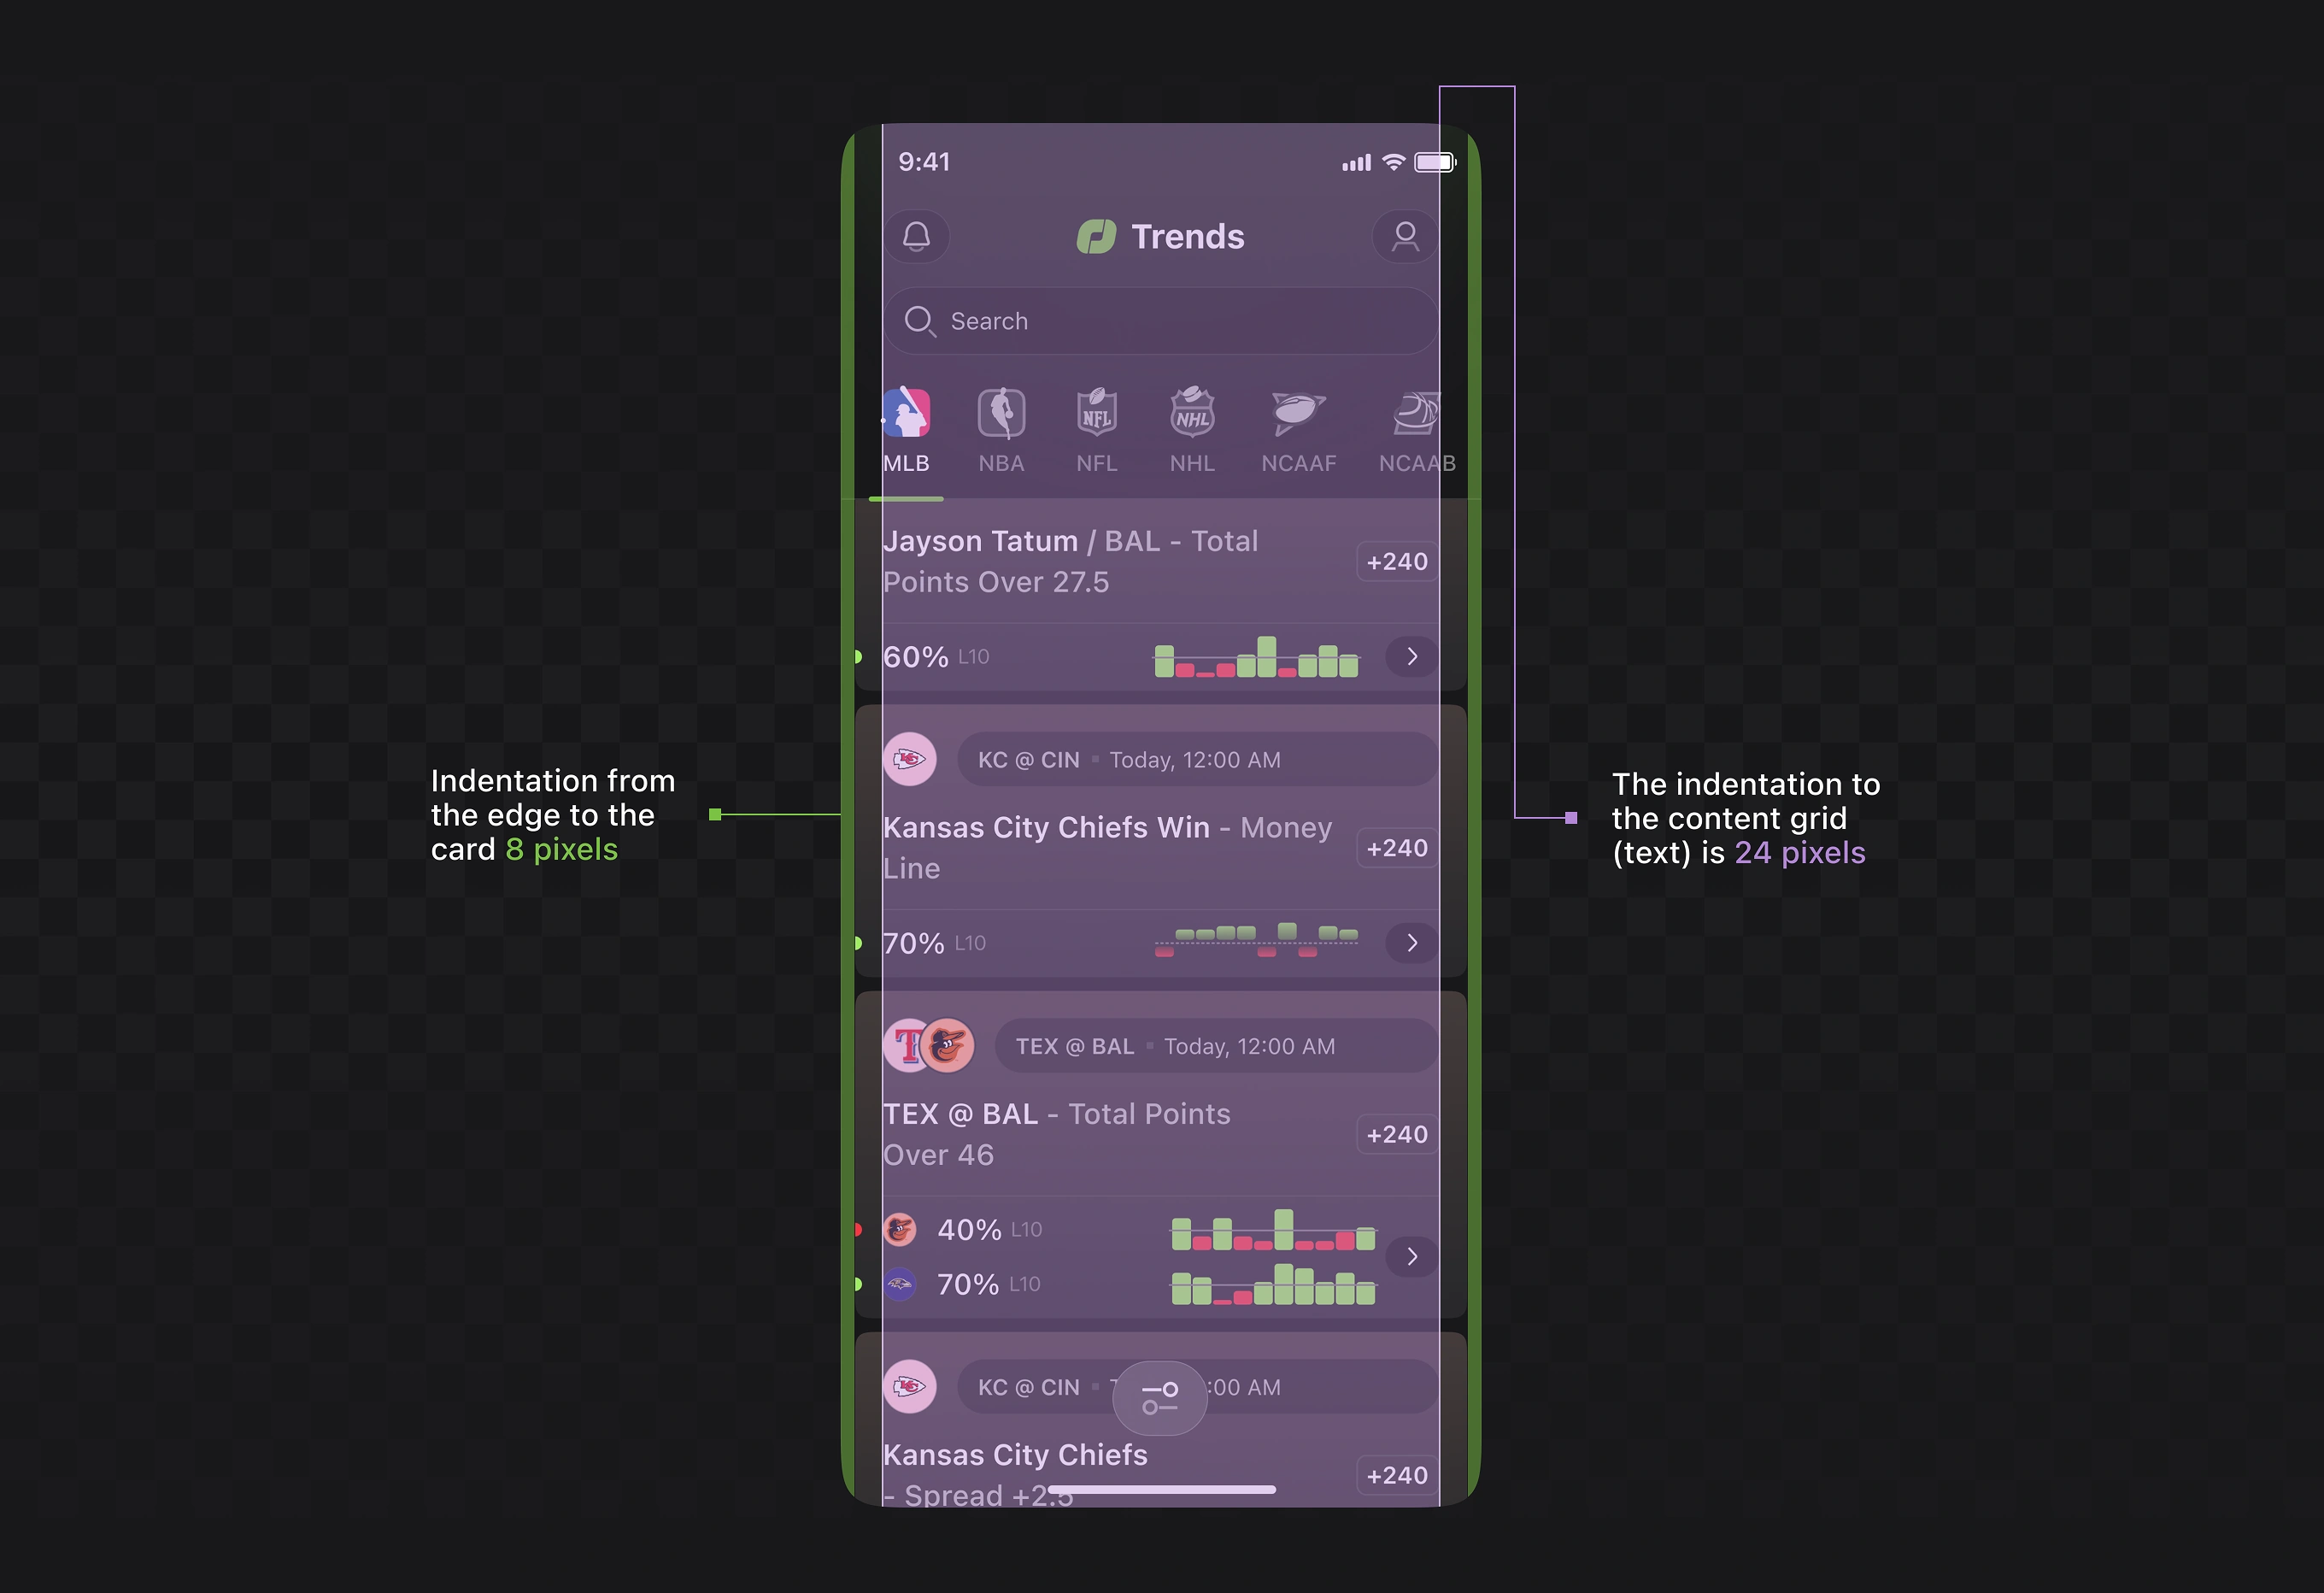
Spacing rules for the feed, where bettors scan stacked prop cards on mobile. A card edge and content indent keep dense odds and hit-rate bars aligned across screens.
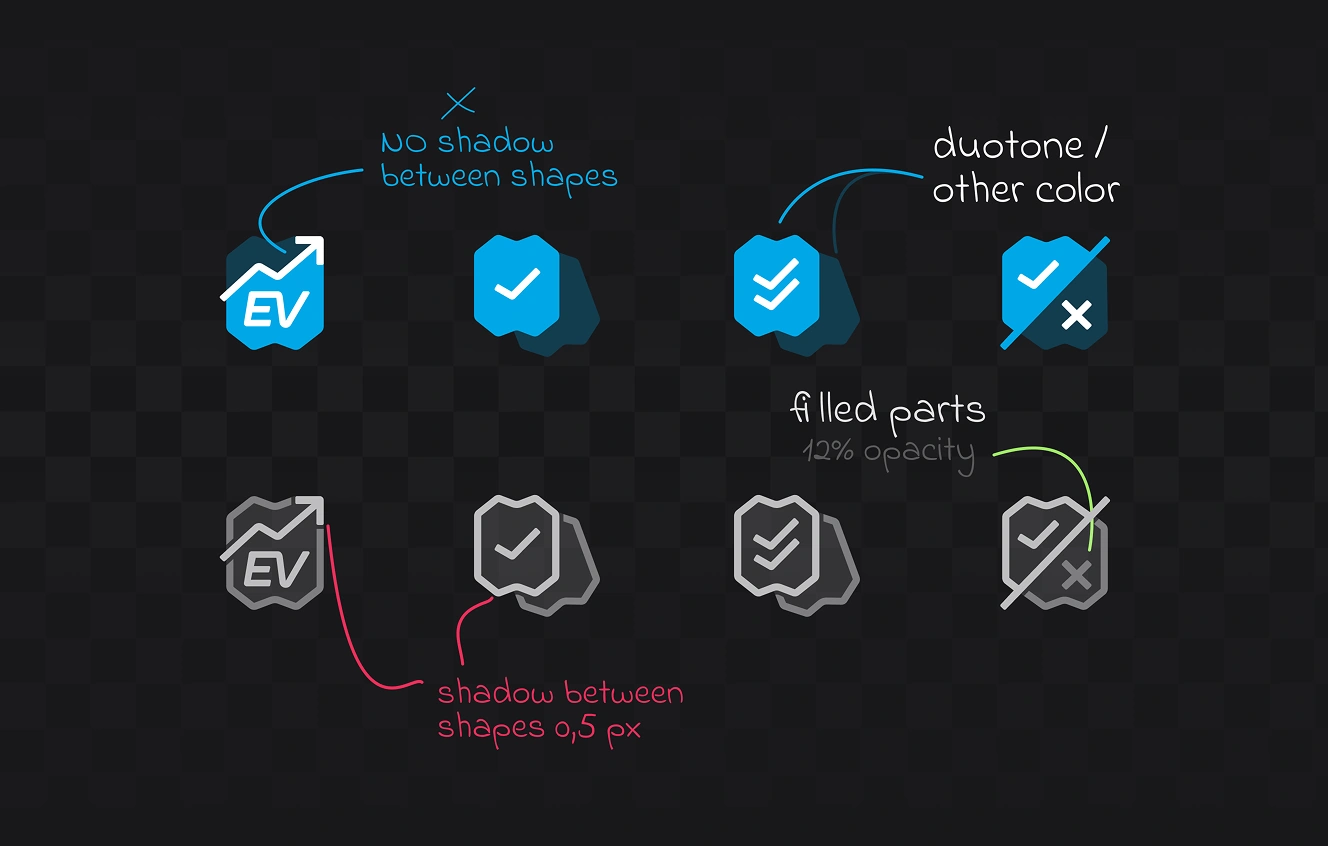
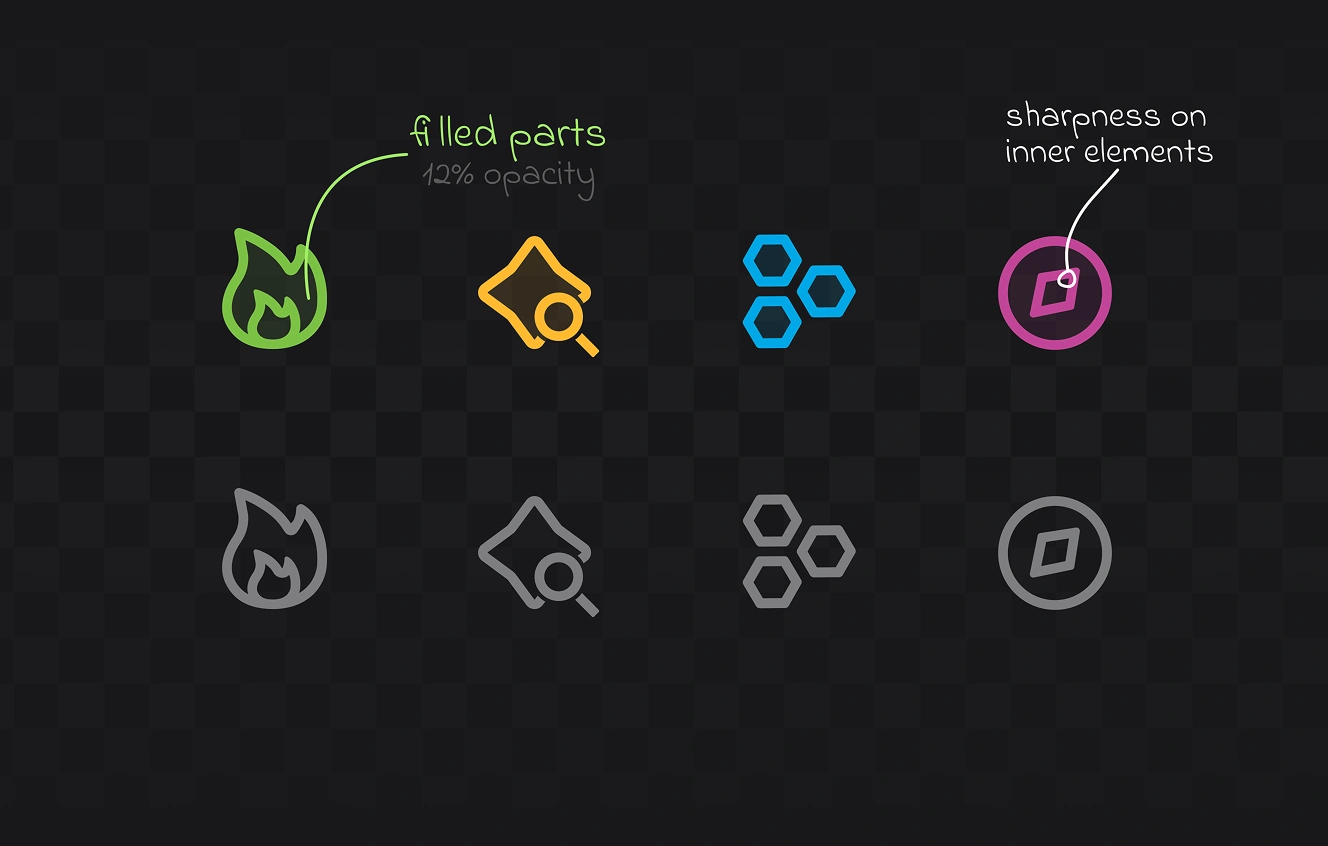
A custom icon set covers league marks and betting states like EV and verified picks. Two-tone fills, opacity, and shadow rules keep glyphs sharp at small sizes.

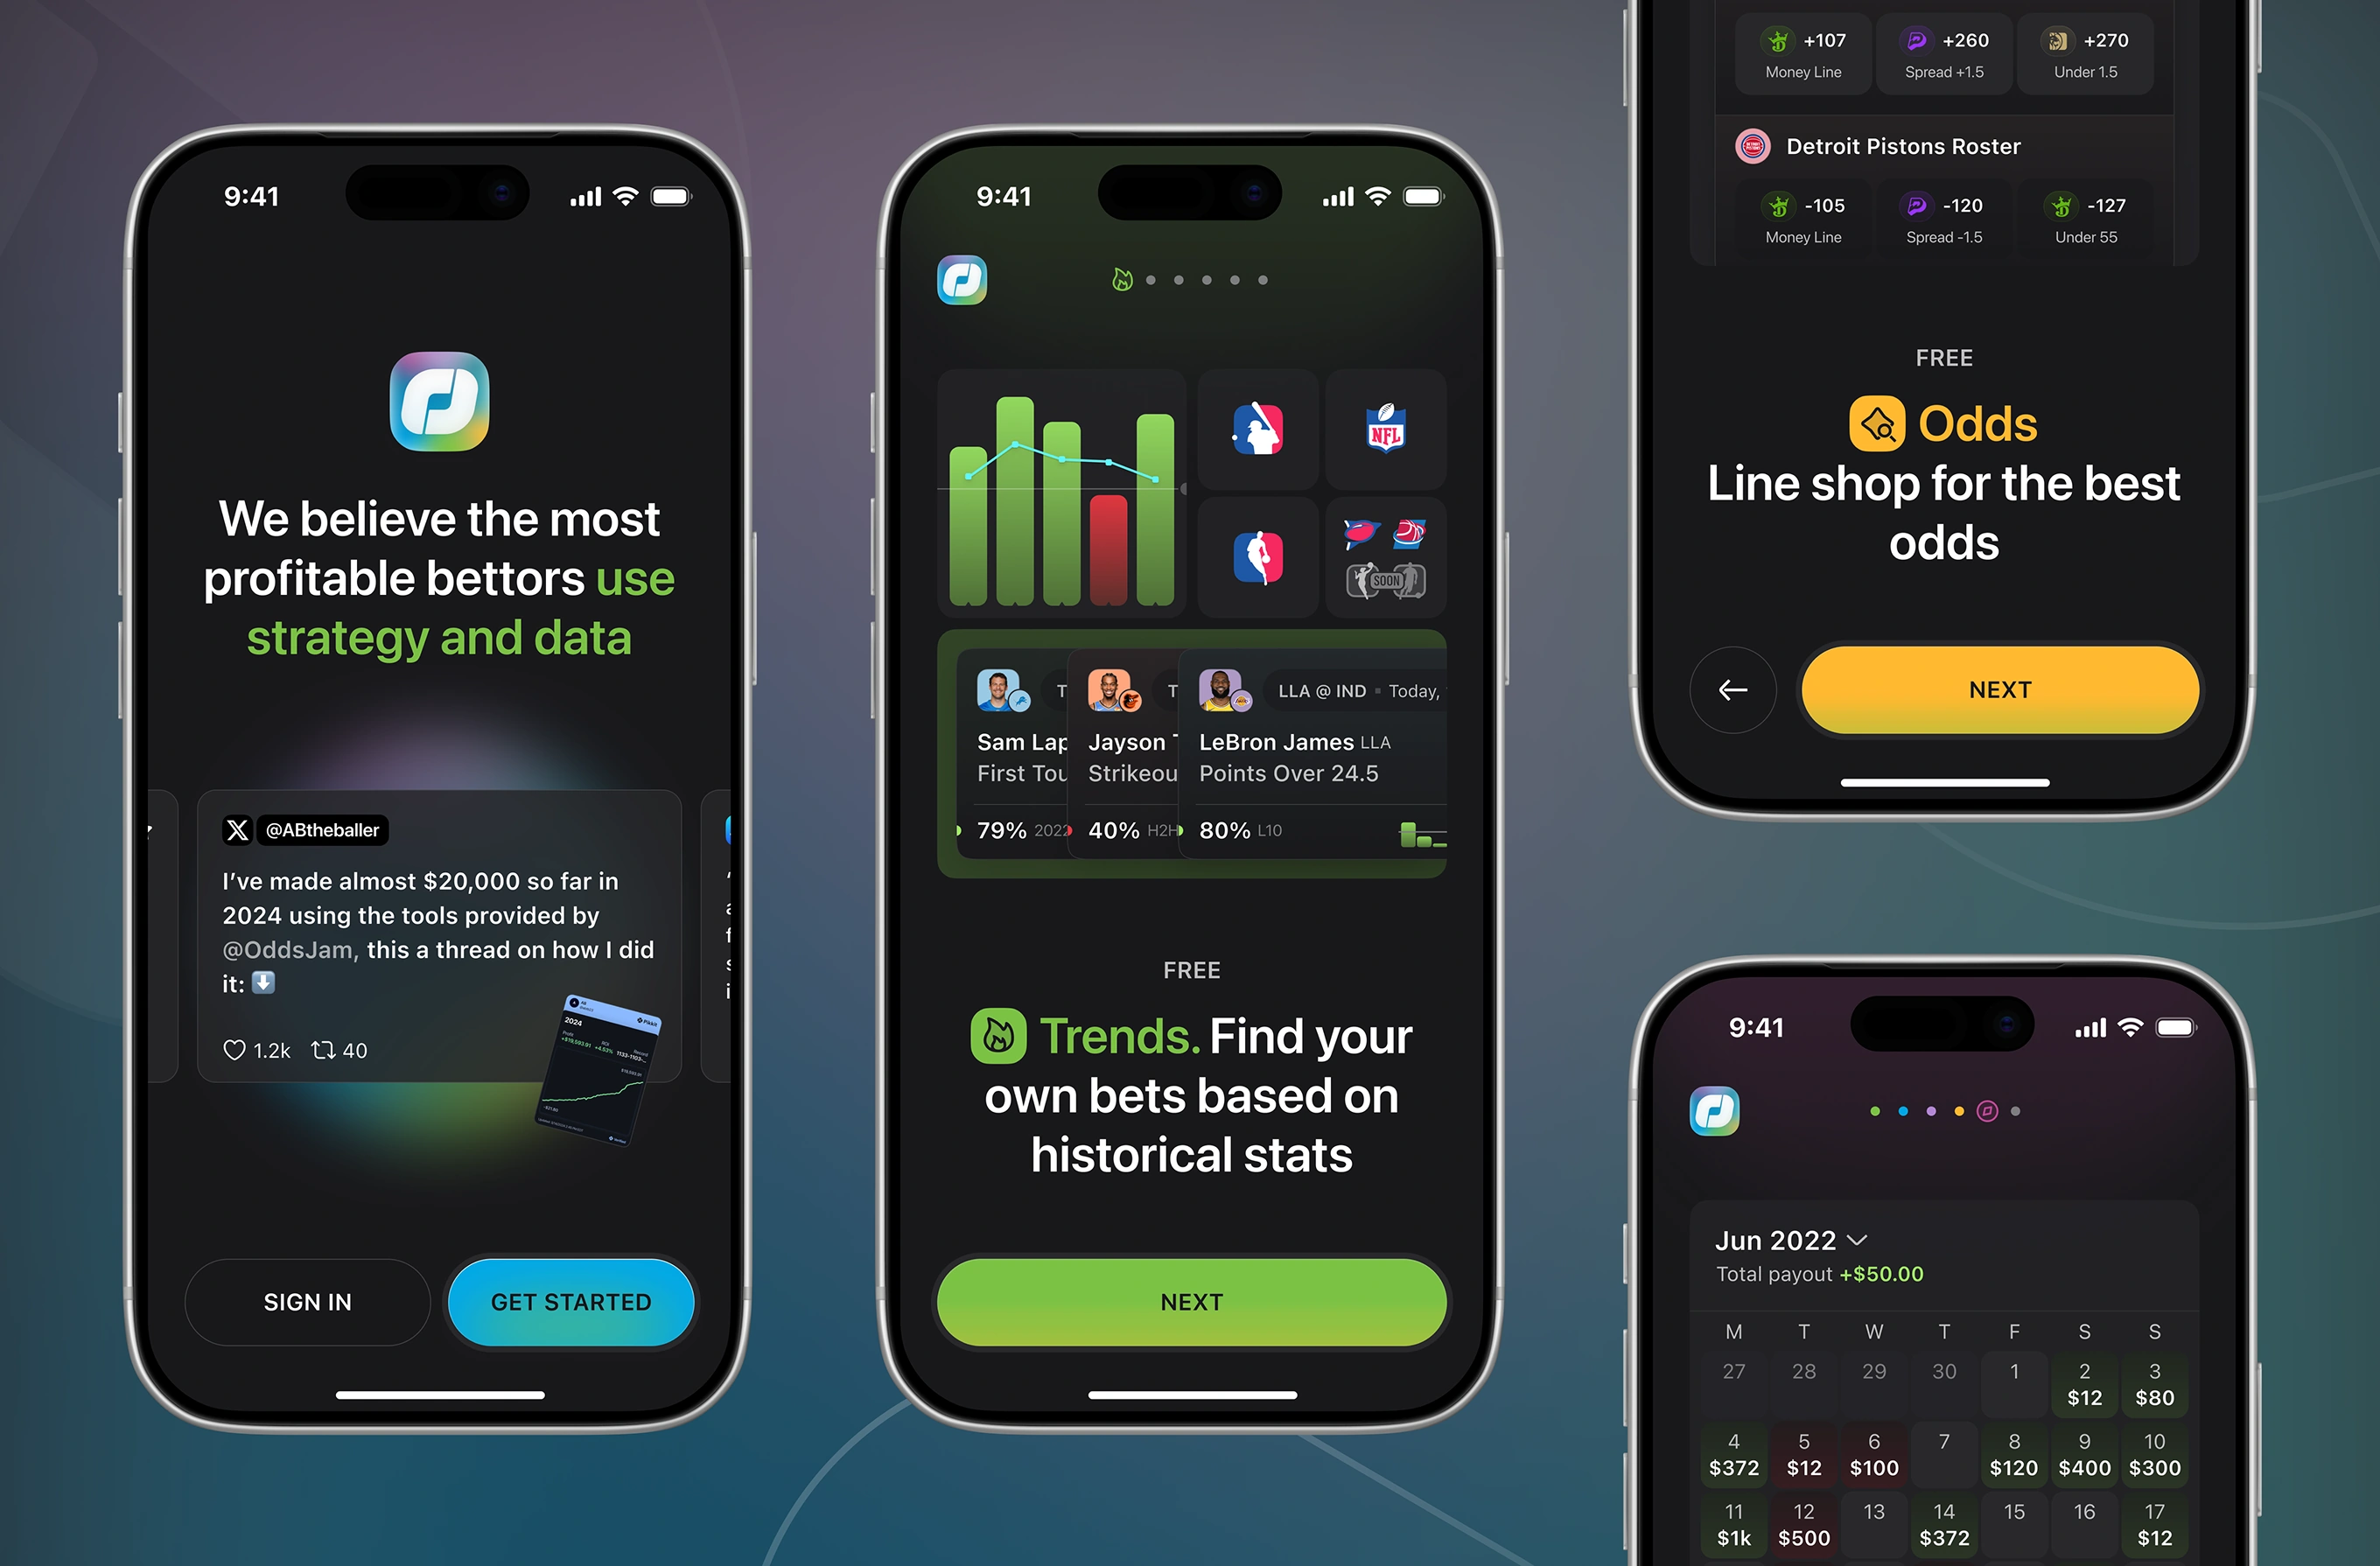
First screens. Sign-up teaser and payout calendar.
The onboarding carousel introduces new users to OddsJam's core features before sign-up. Three screens preview the Trends and Odds tools and a payout calendar of daily results.
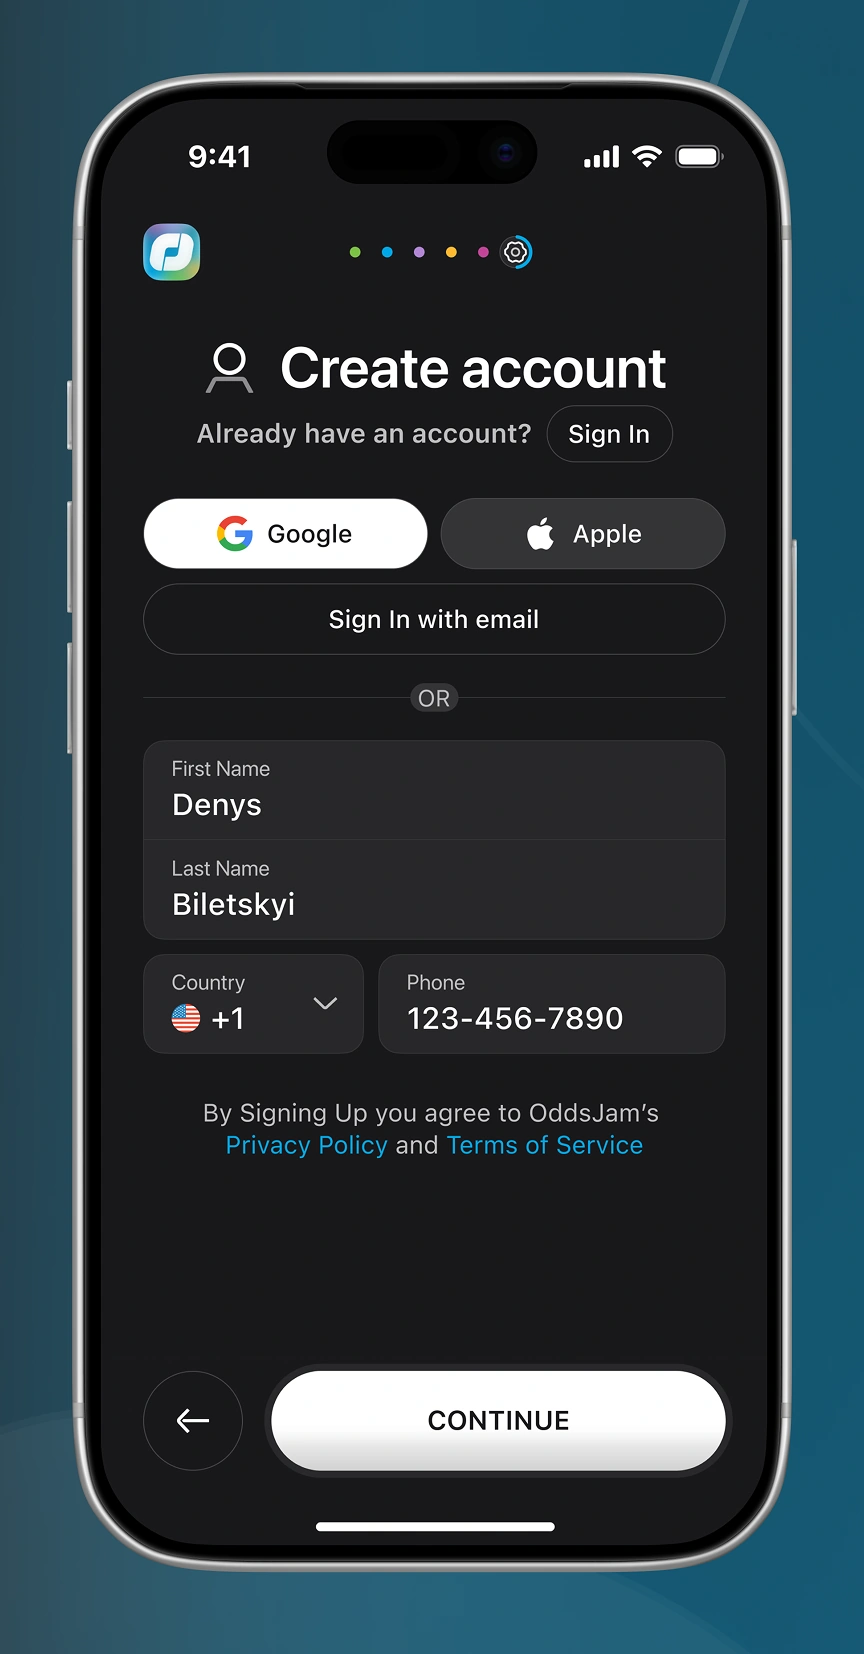
Registration covers social sign-in, email sign-up, and phone-based verification. A country picker and a 6-digit email code confirm identity before bettors reach the product.
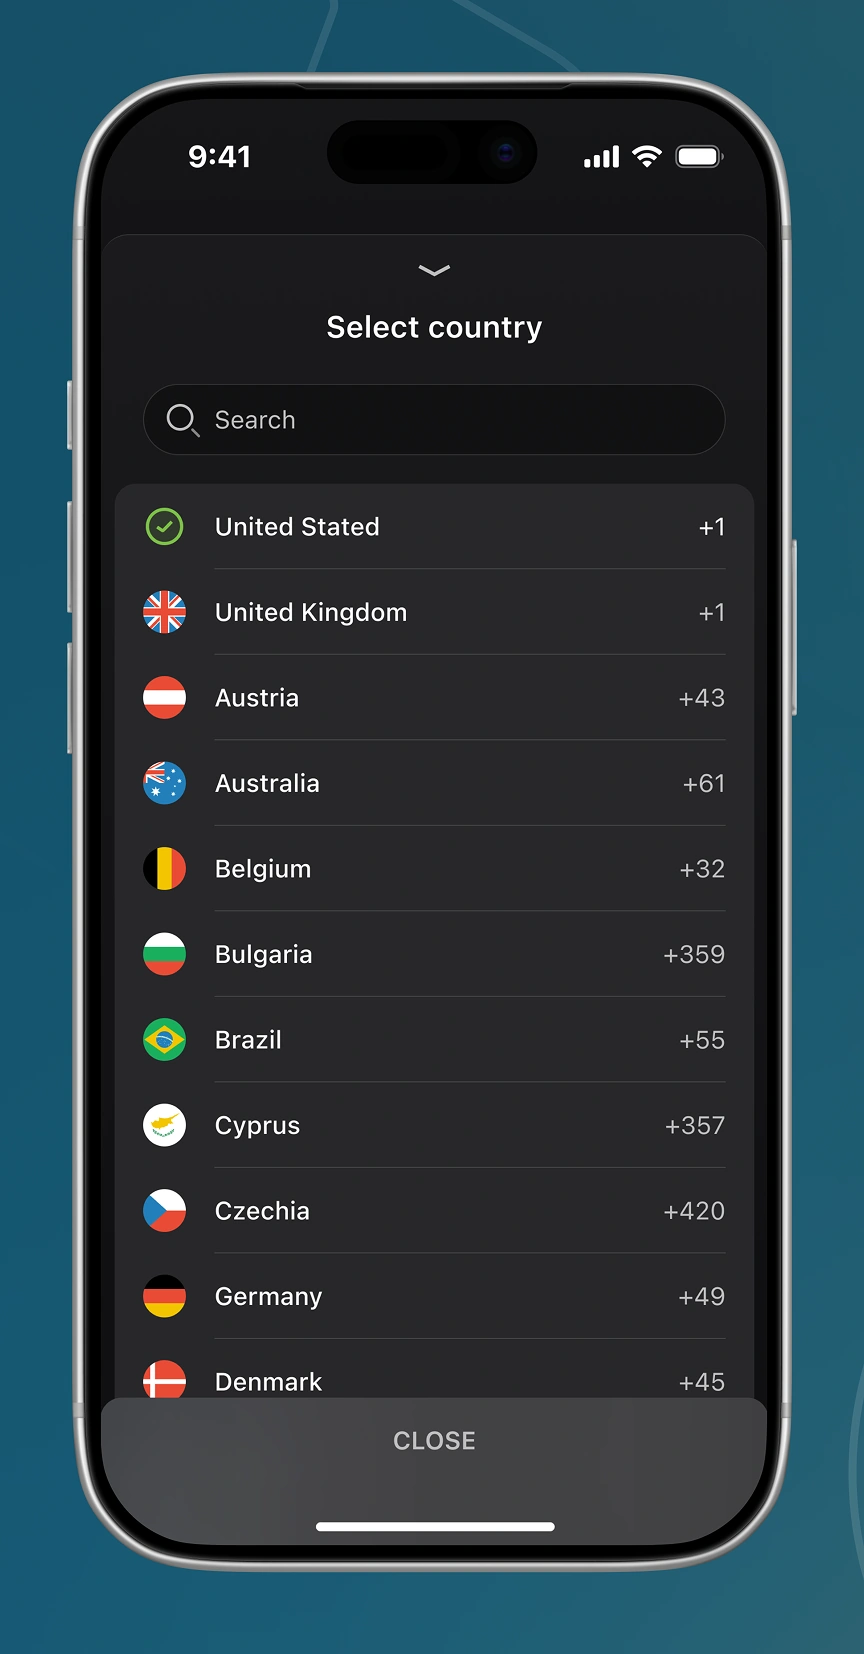
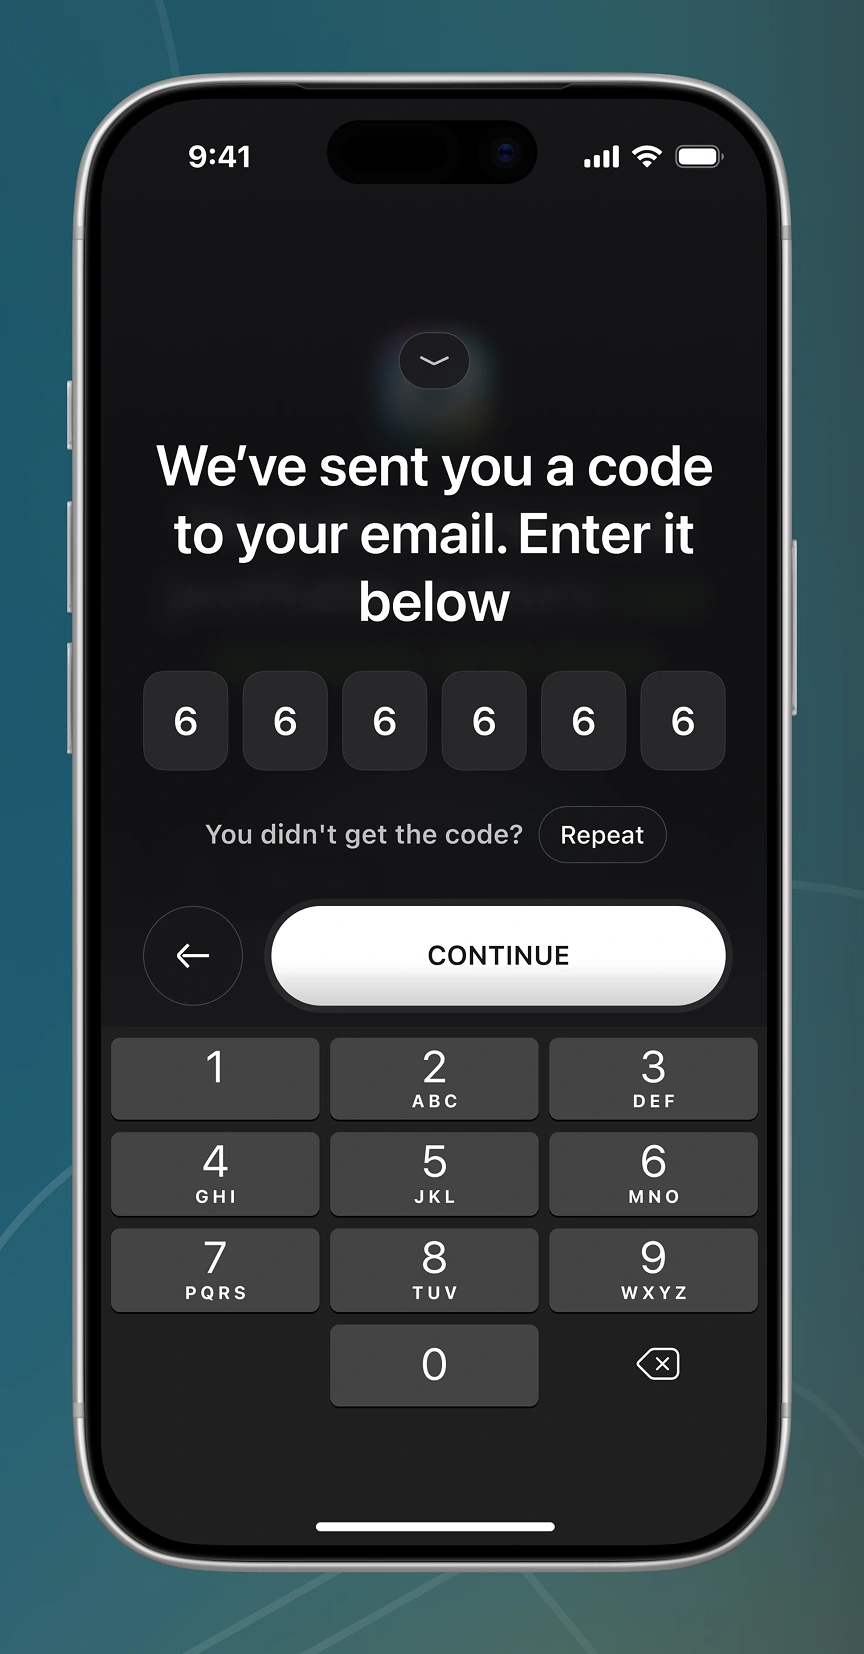
Registration covers social sign-in, email sign-up, and phone-based verification. A country picker and a 6-digit email code confirm identity before bettors reach the product.
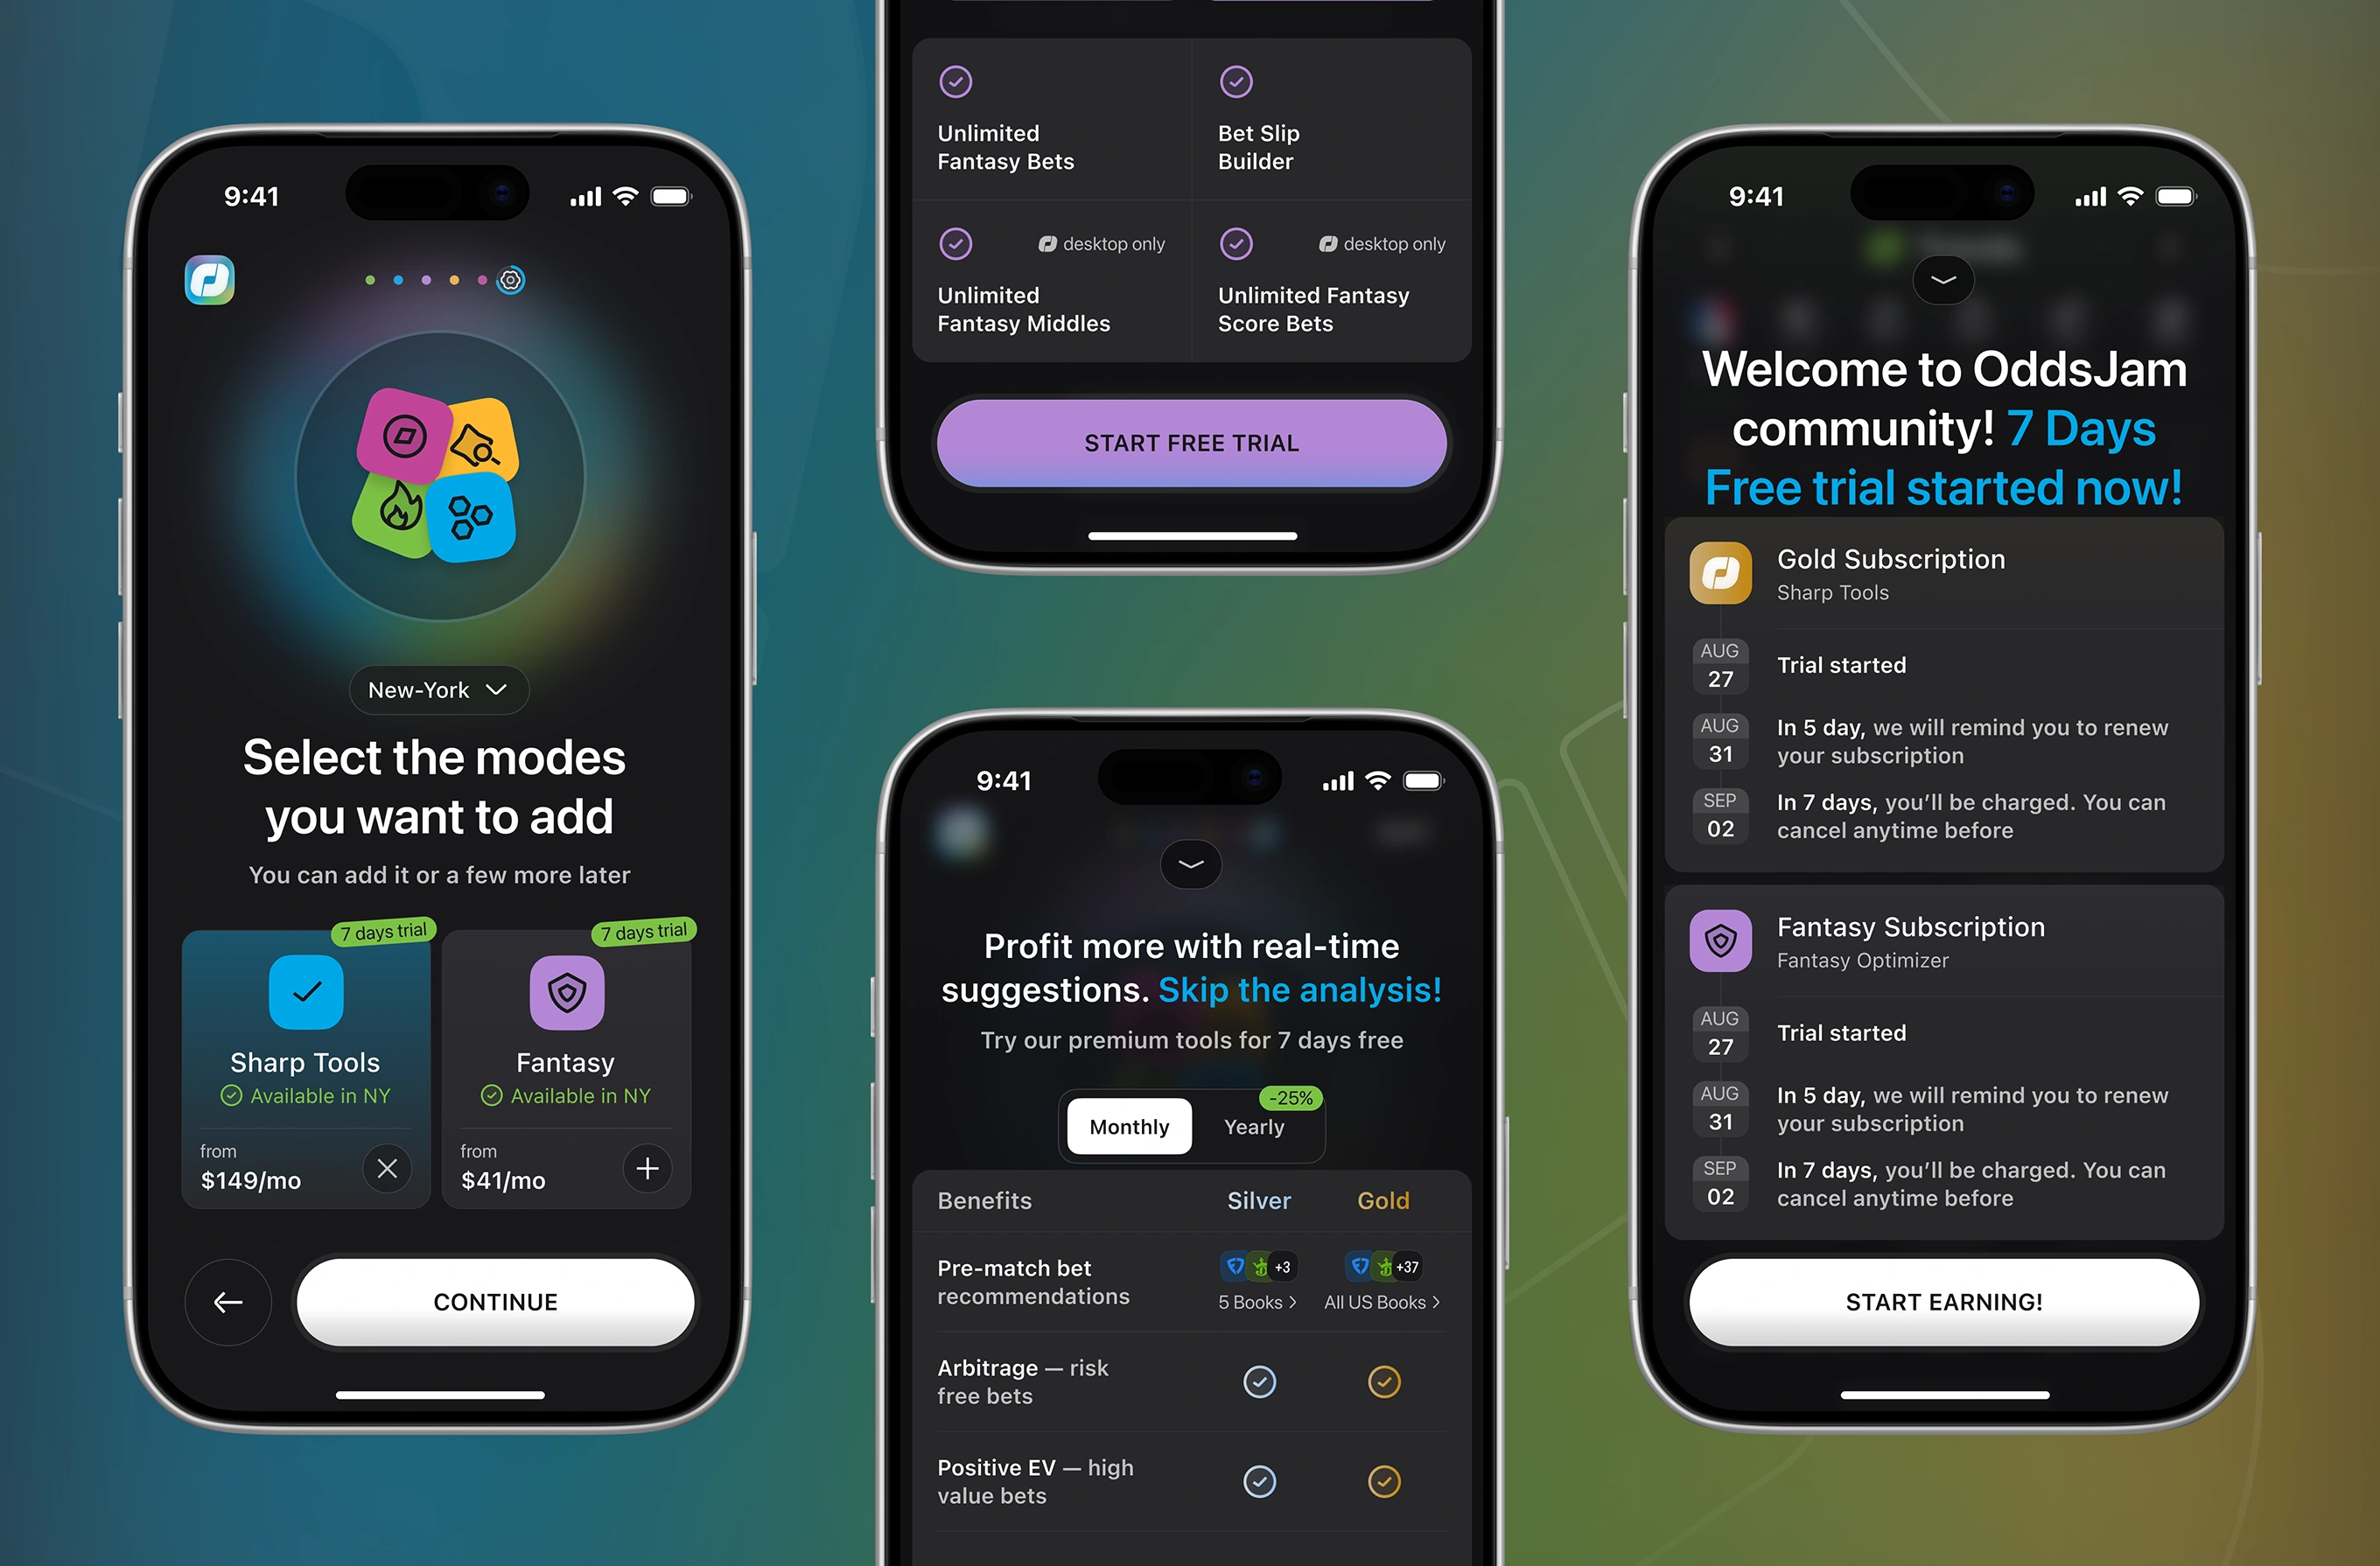
A mode-selection step inside onboarding lets bettors add optional tools as separate modules, each gated behind a trial period. A tiered comparison table then lays out feature access across two plan levels.
Trends tab. Prop rows with mini charts.
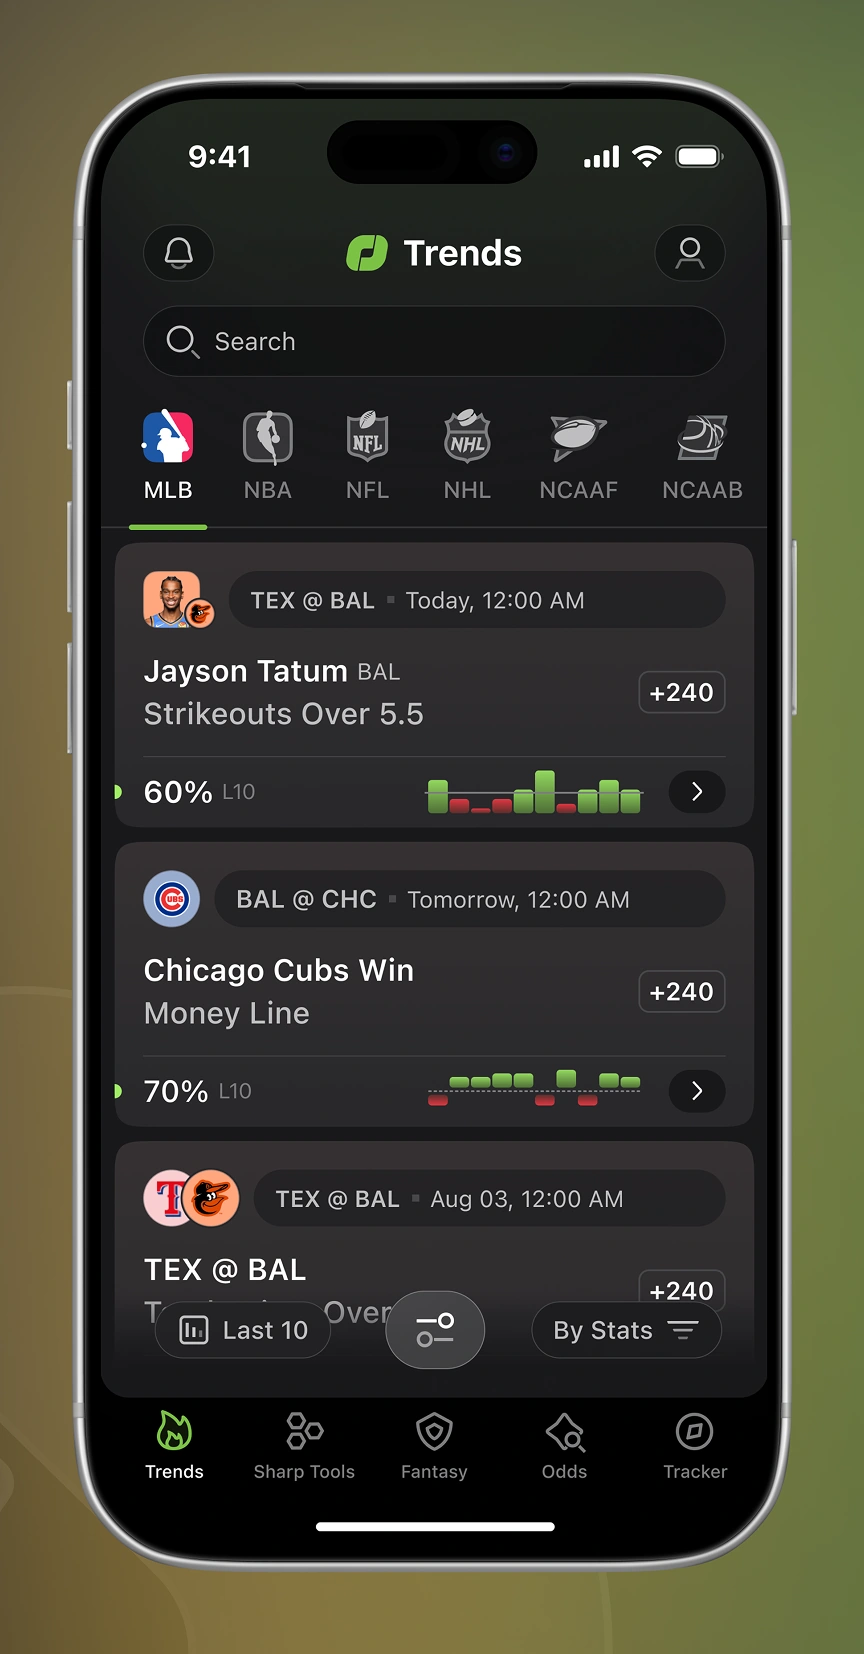
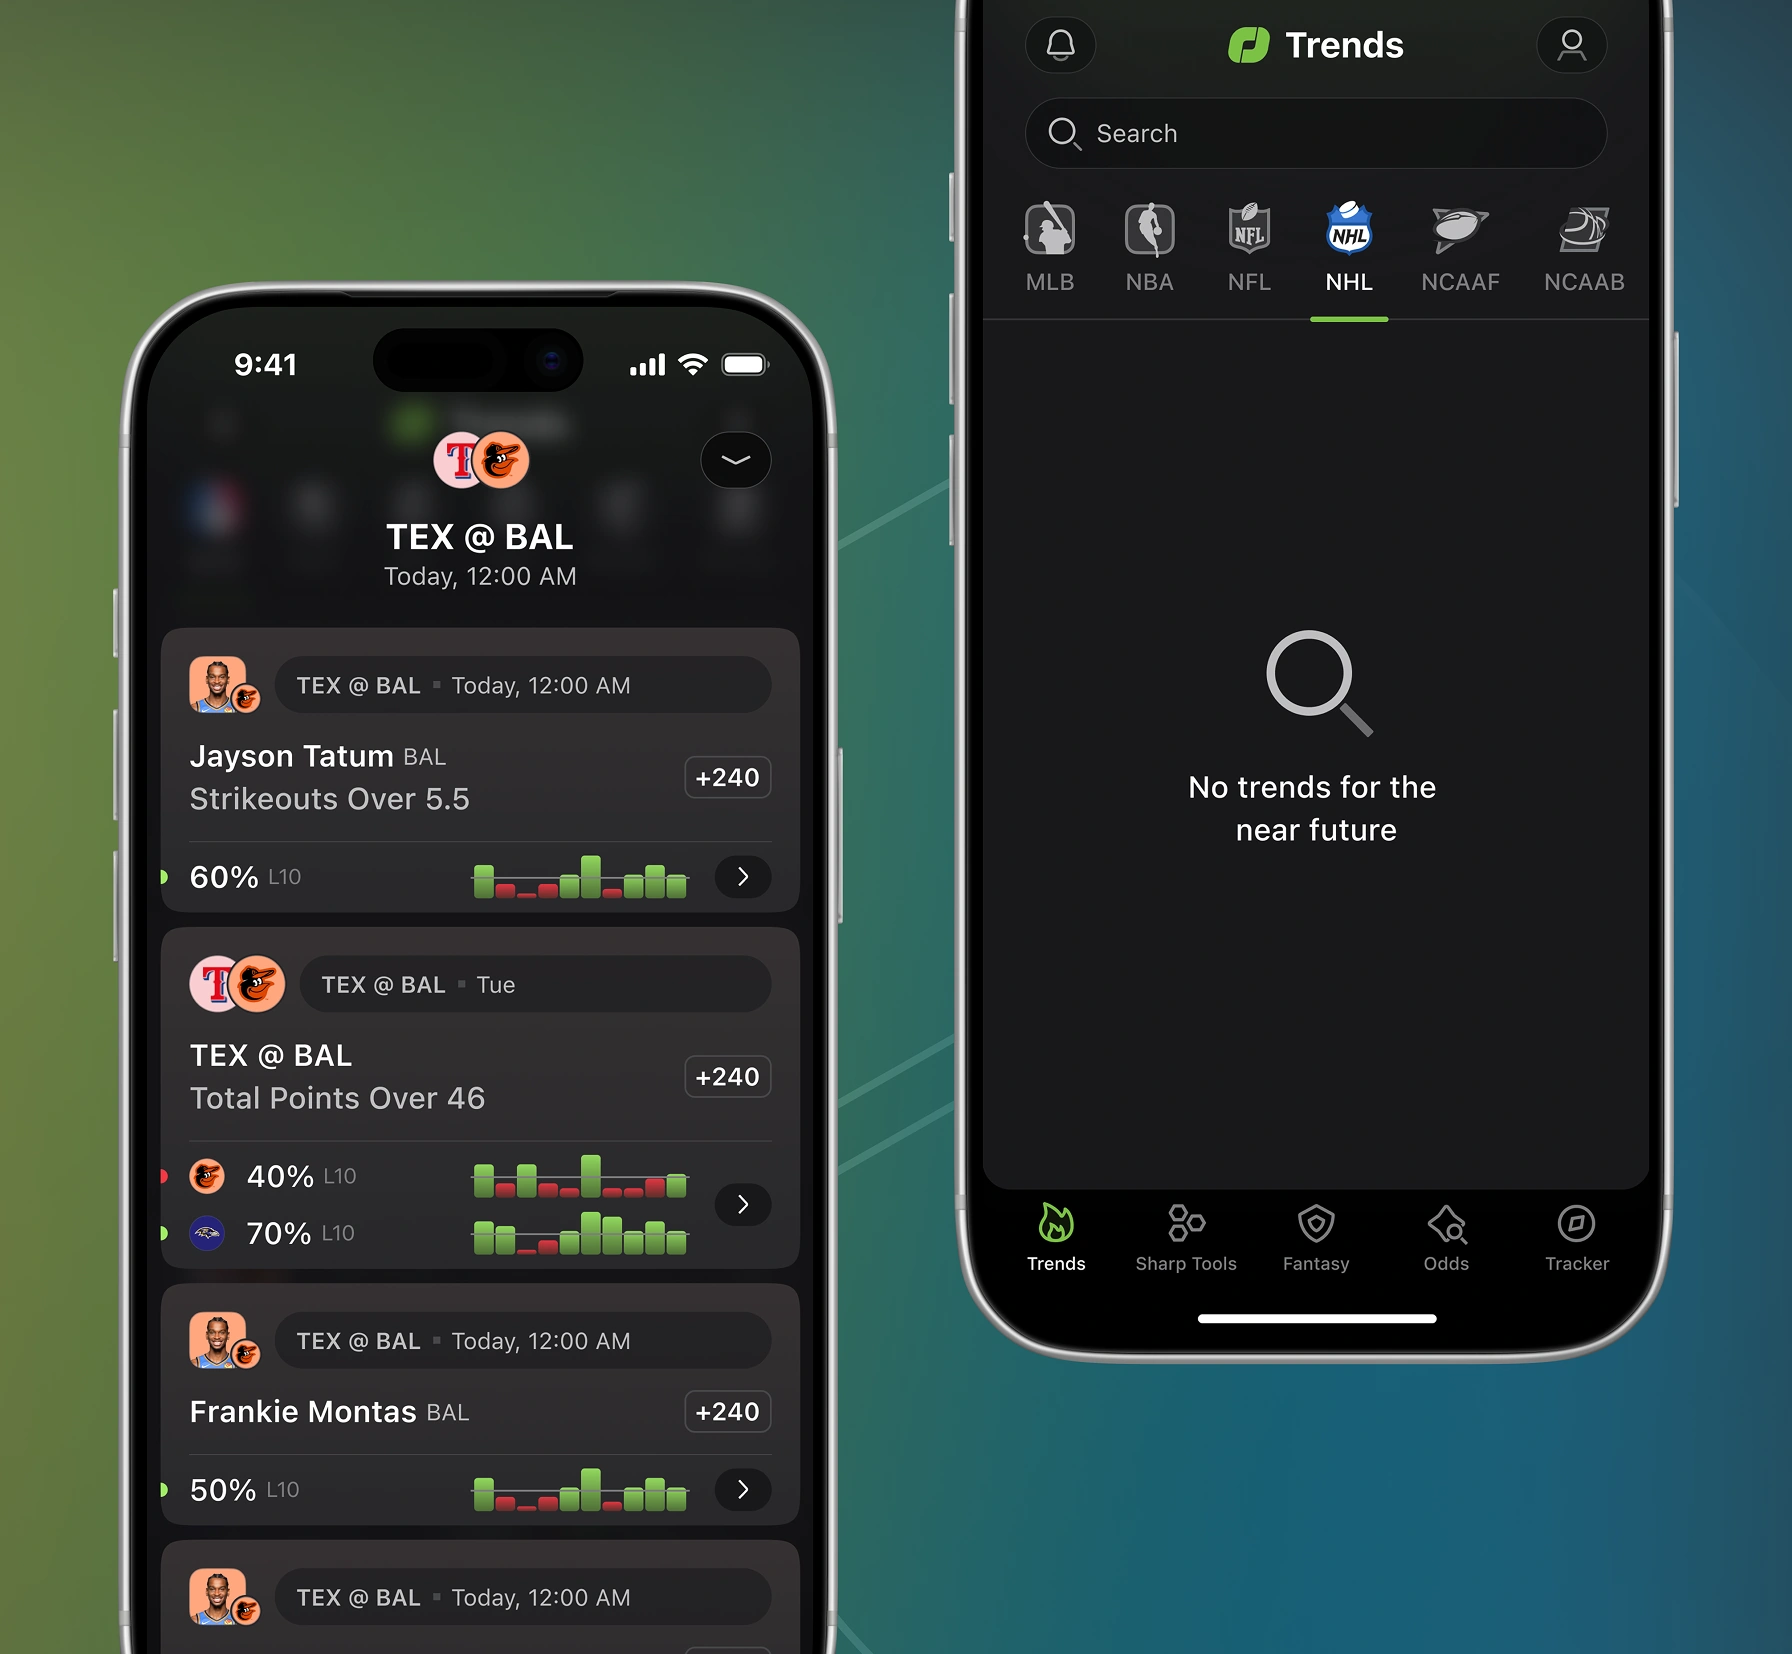
The Trends tab is the main feed spanning multiple sports and leagues. Each row pairs a prop with a hit-rate percentage and a mini trend chart; an empty state covers off-season leagues
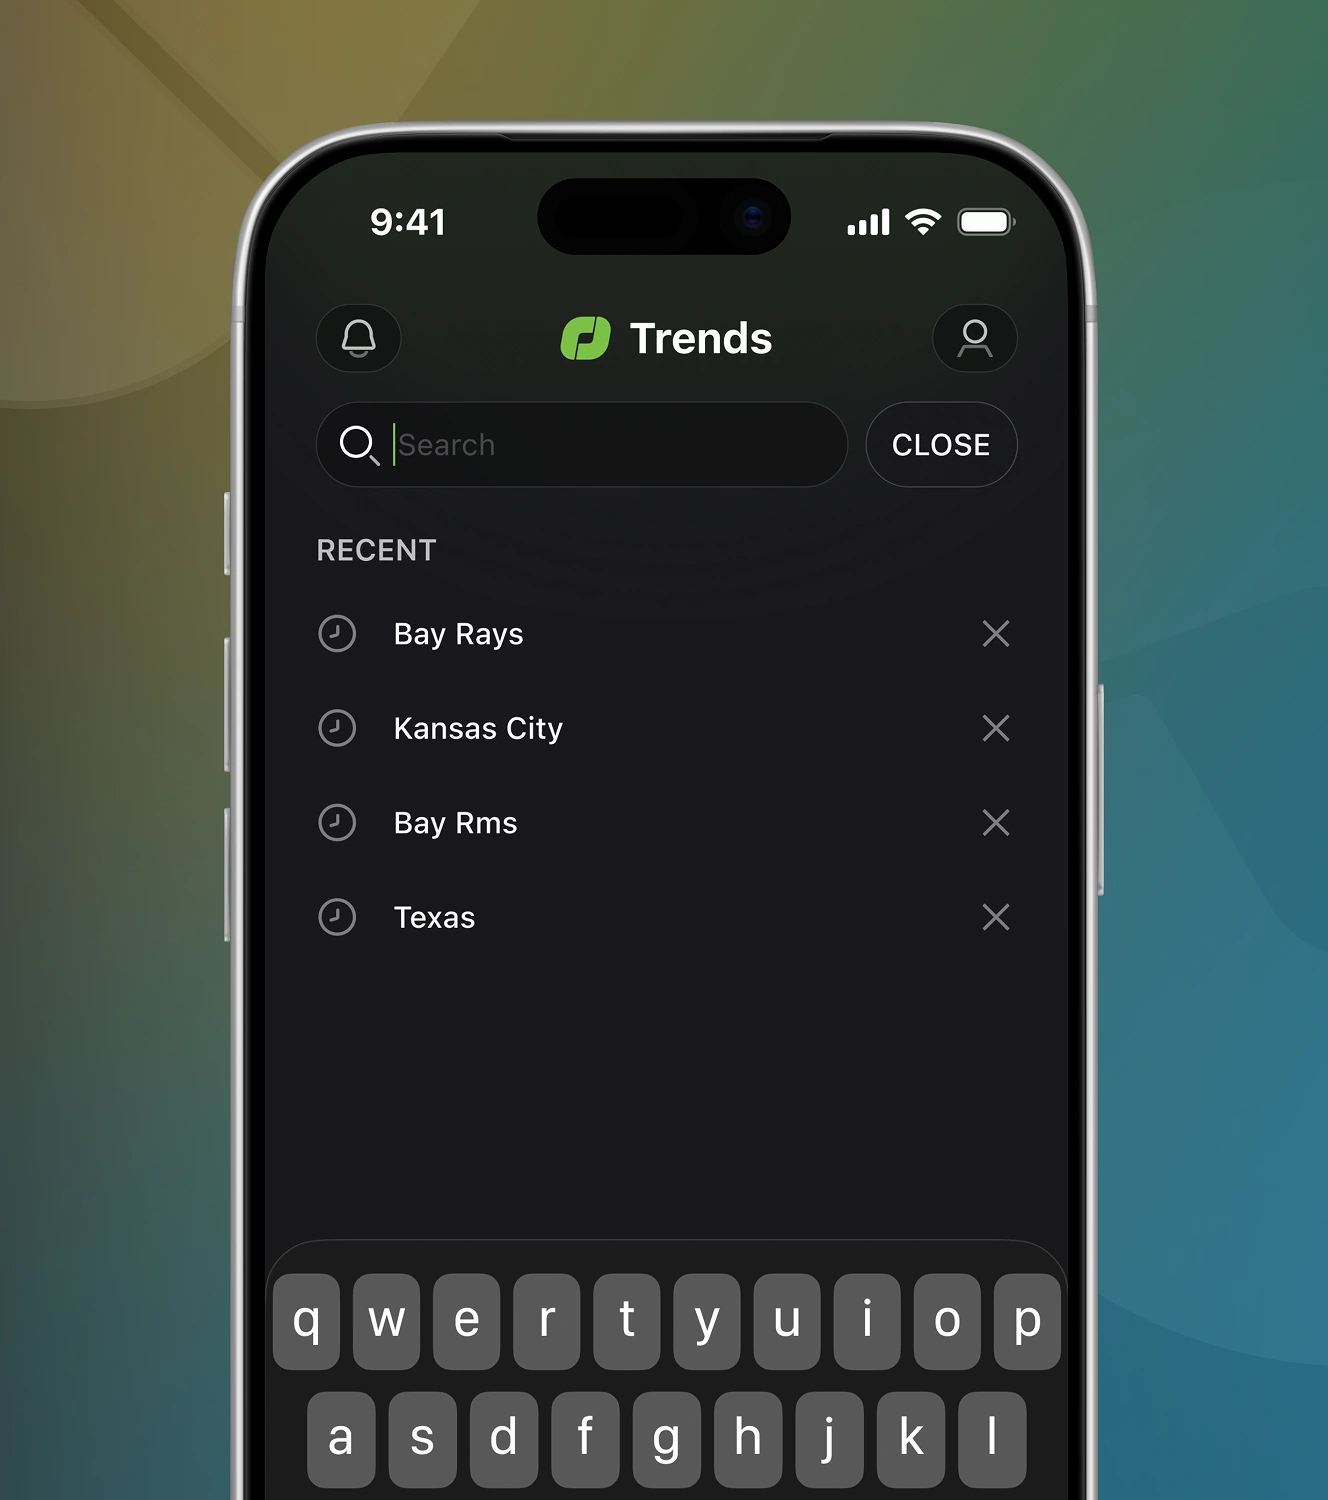
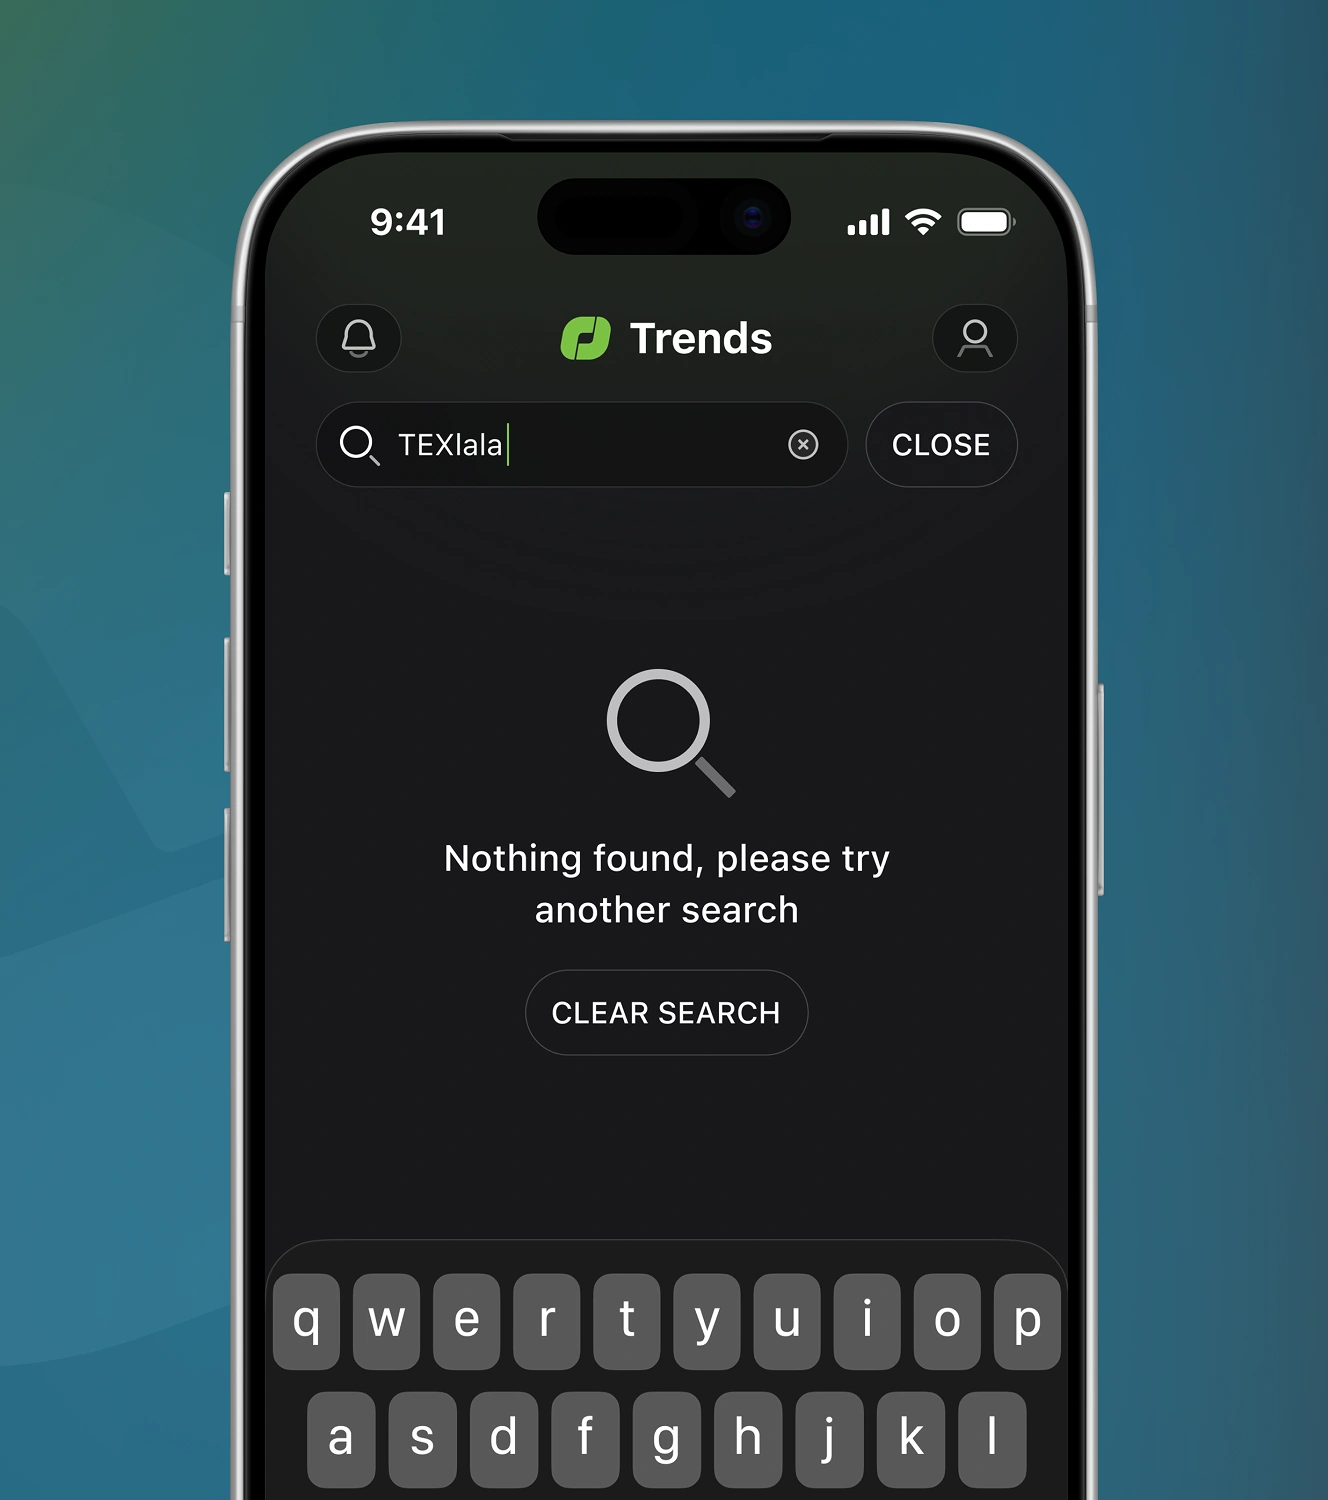
The search stores recent team lookups for one-tap reuse, shown as a list. A no-results state with a button appears when a query, such as a misspelled team name, returns nothing.
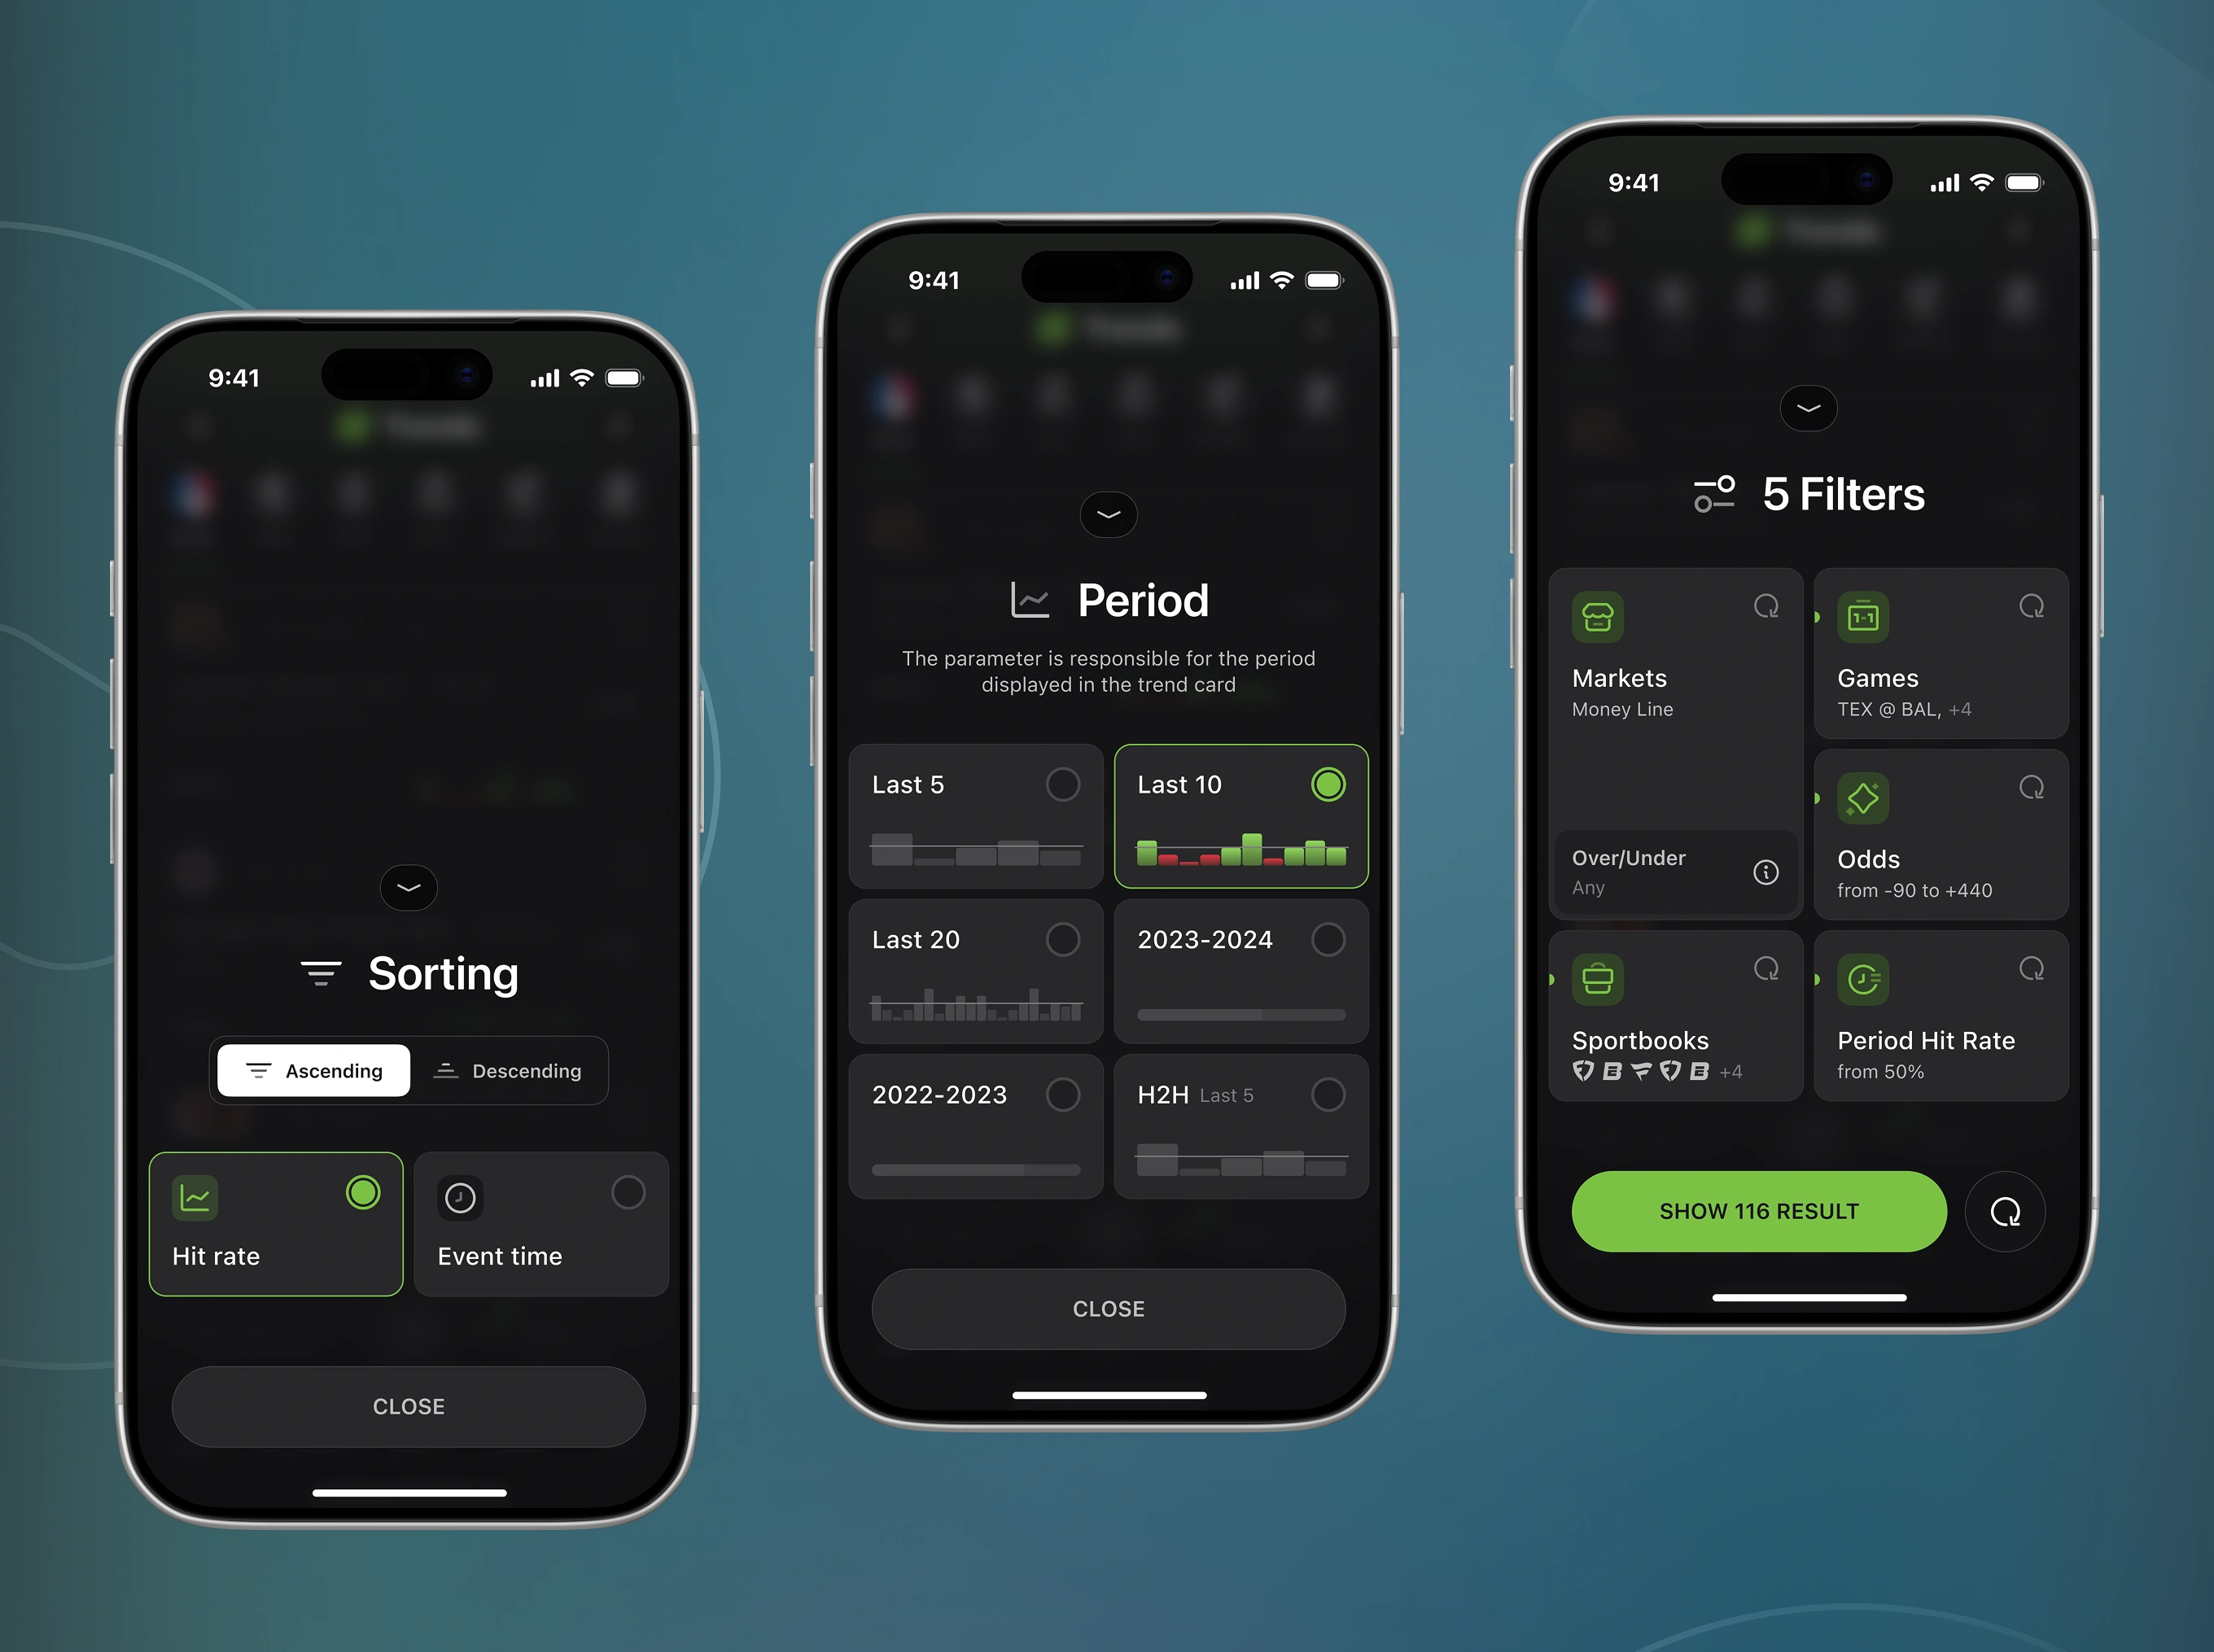
Two modals control the same feed: one flips sort direction and metric, the other sets the lookback window from Last 5 to full past seasons. A five-item filter bar then summarizes markets, games, odds range, and sportsbooks applied.
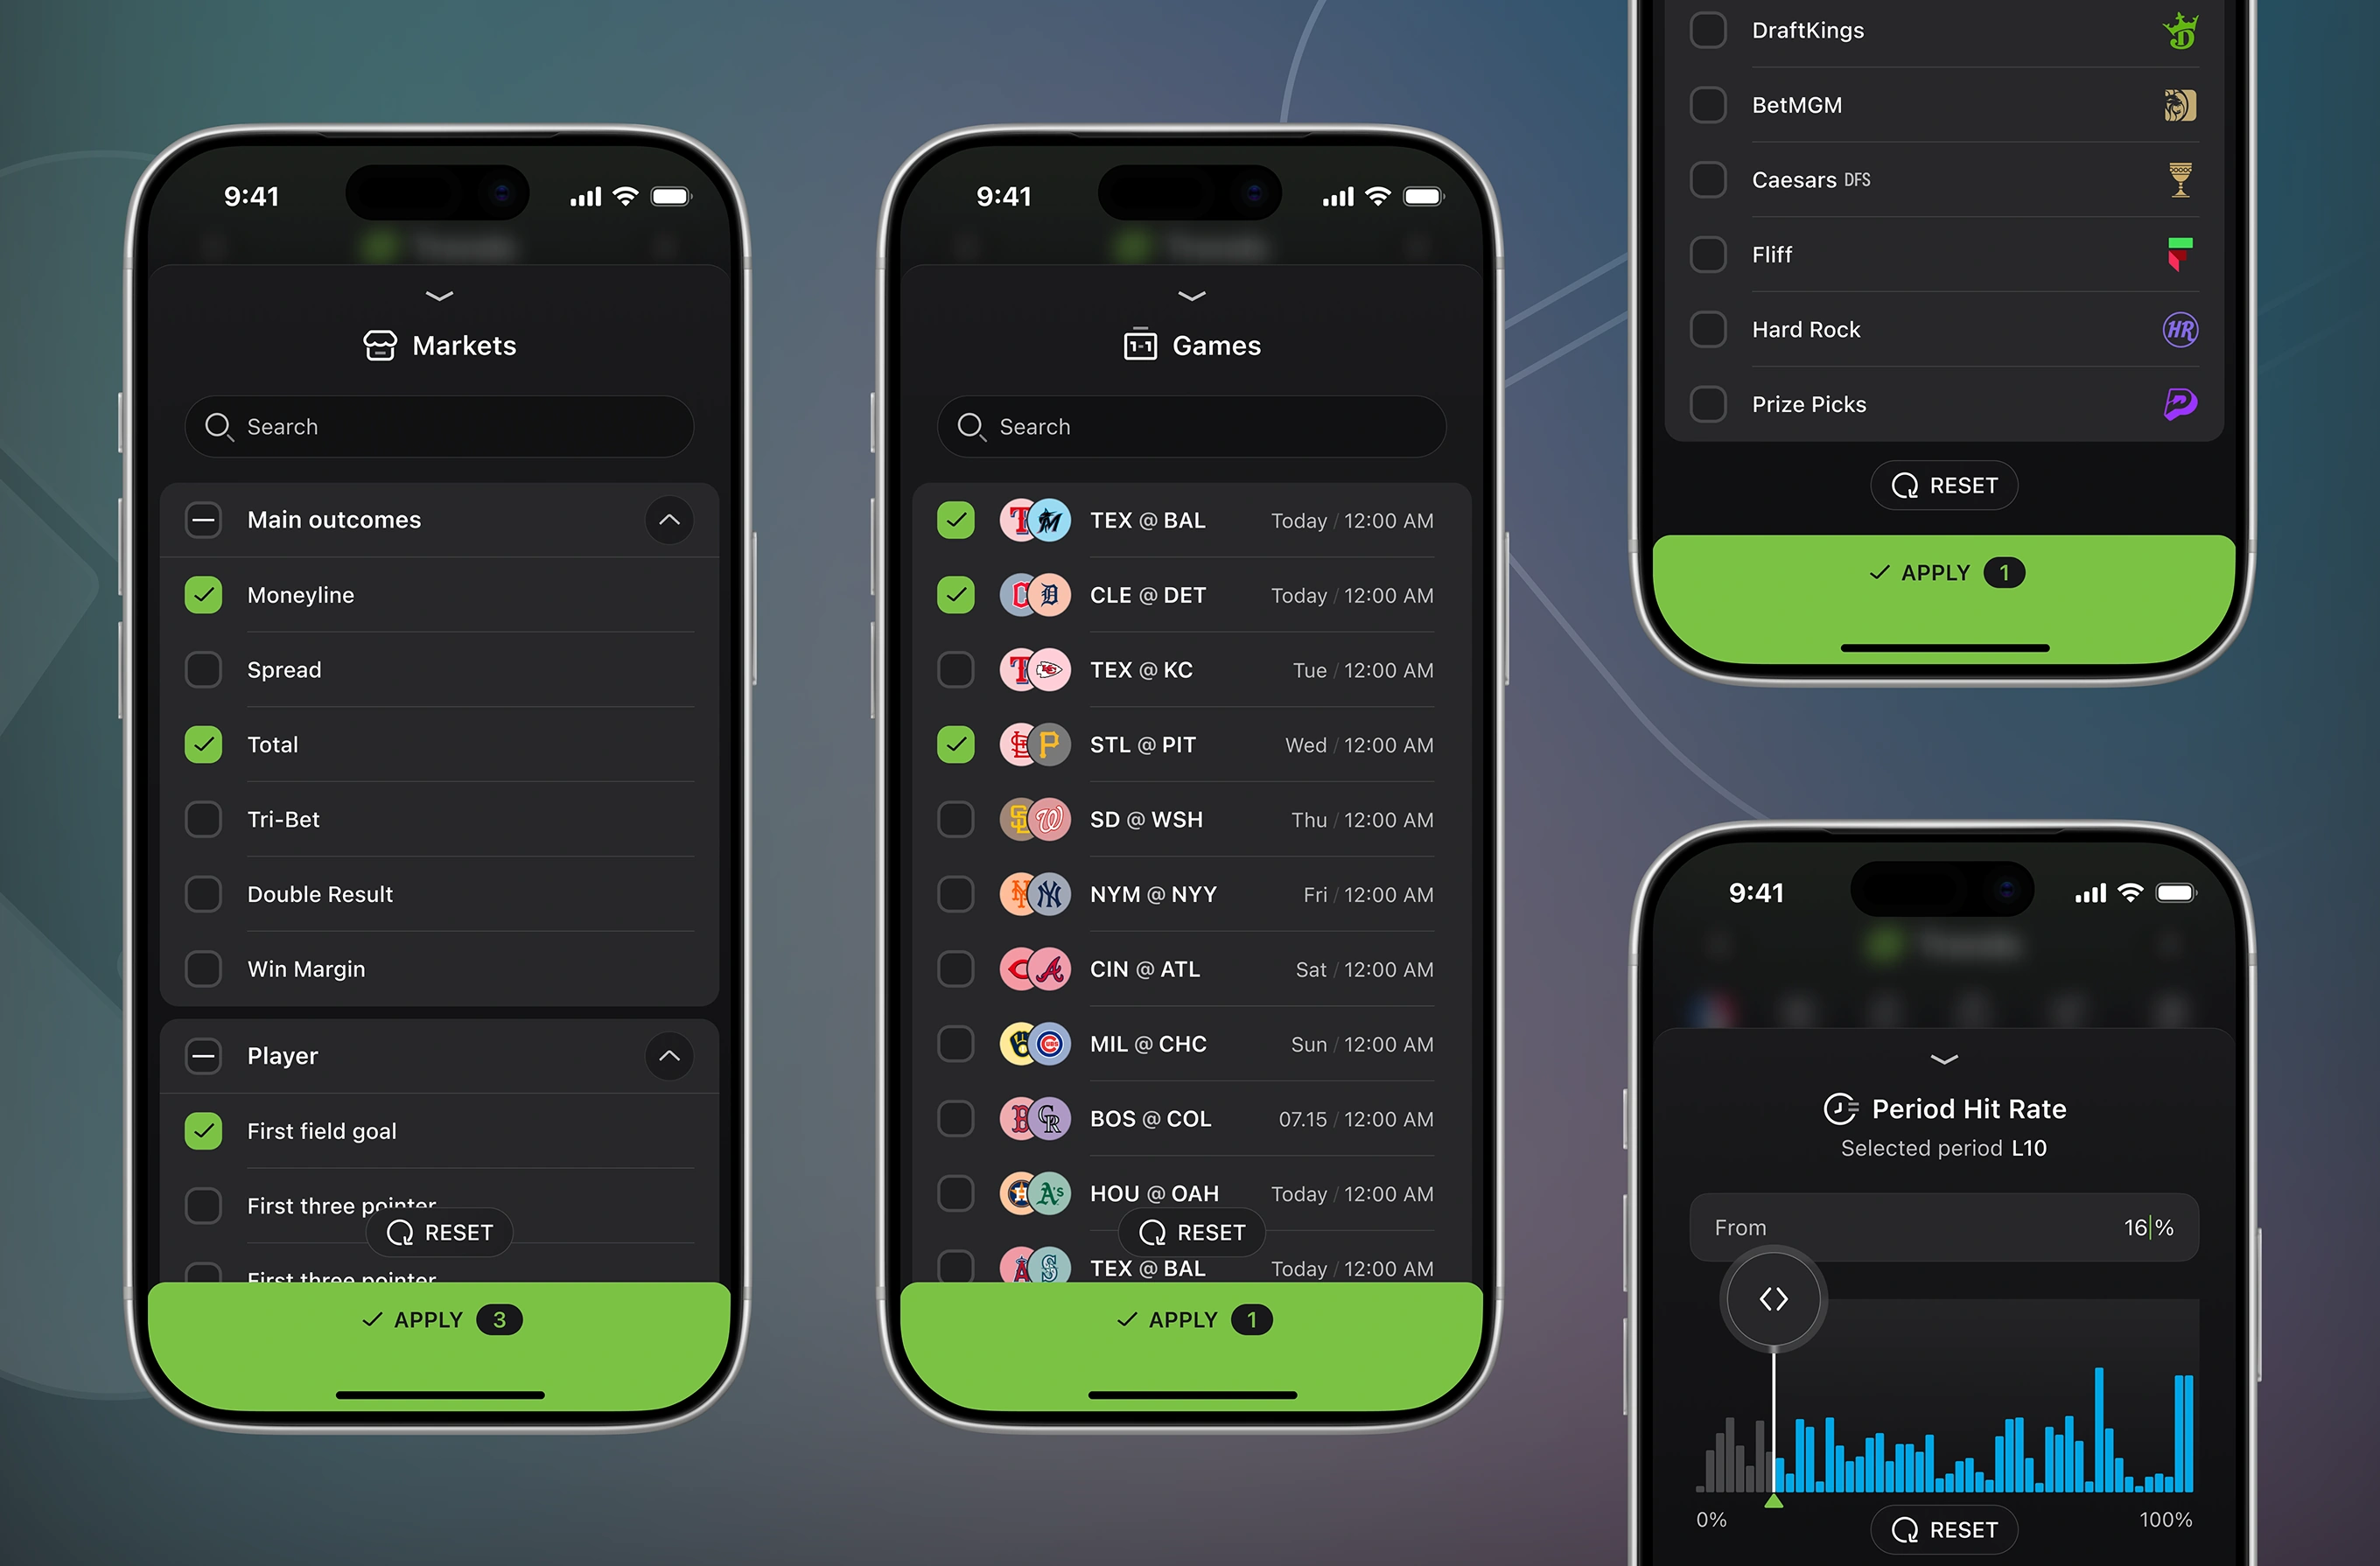
Three linked filters narrow the feed to specific markets, games, and sportsbooks. A Period Hit Rate slider then filters results by a selected win-rate range.
Spread chart. Bar breakdown with help modal.
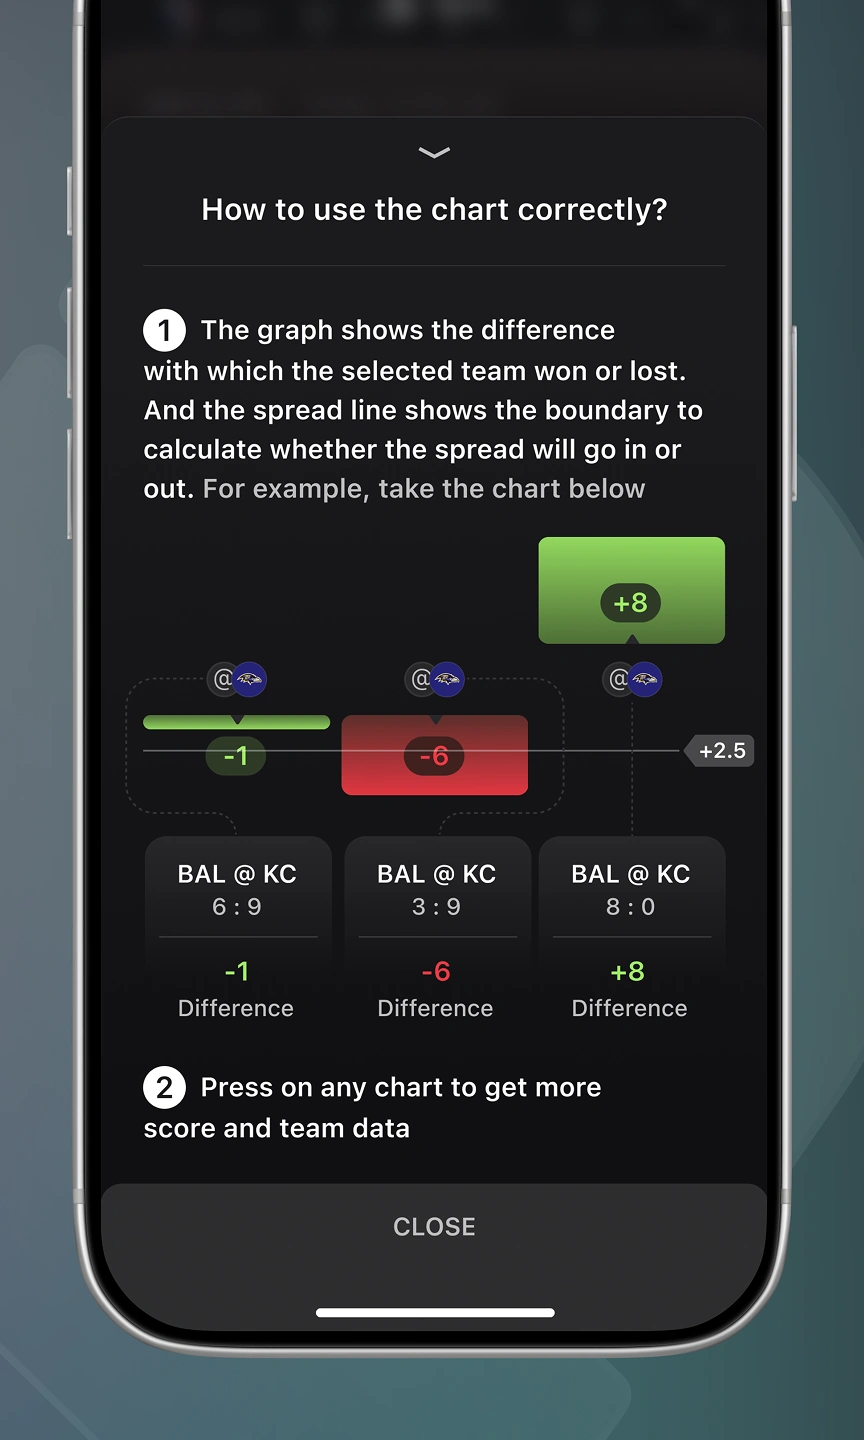
A single line expands into a per-game bar chart of point differences against the spread. An in-app help modal explains how to read the bars above and below the baseline.
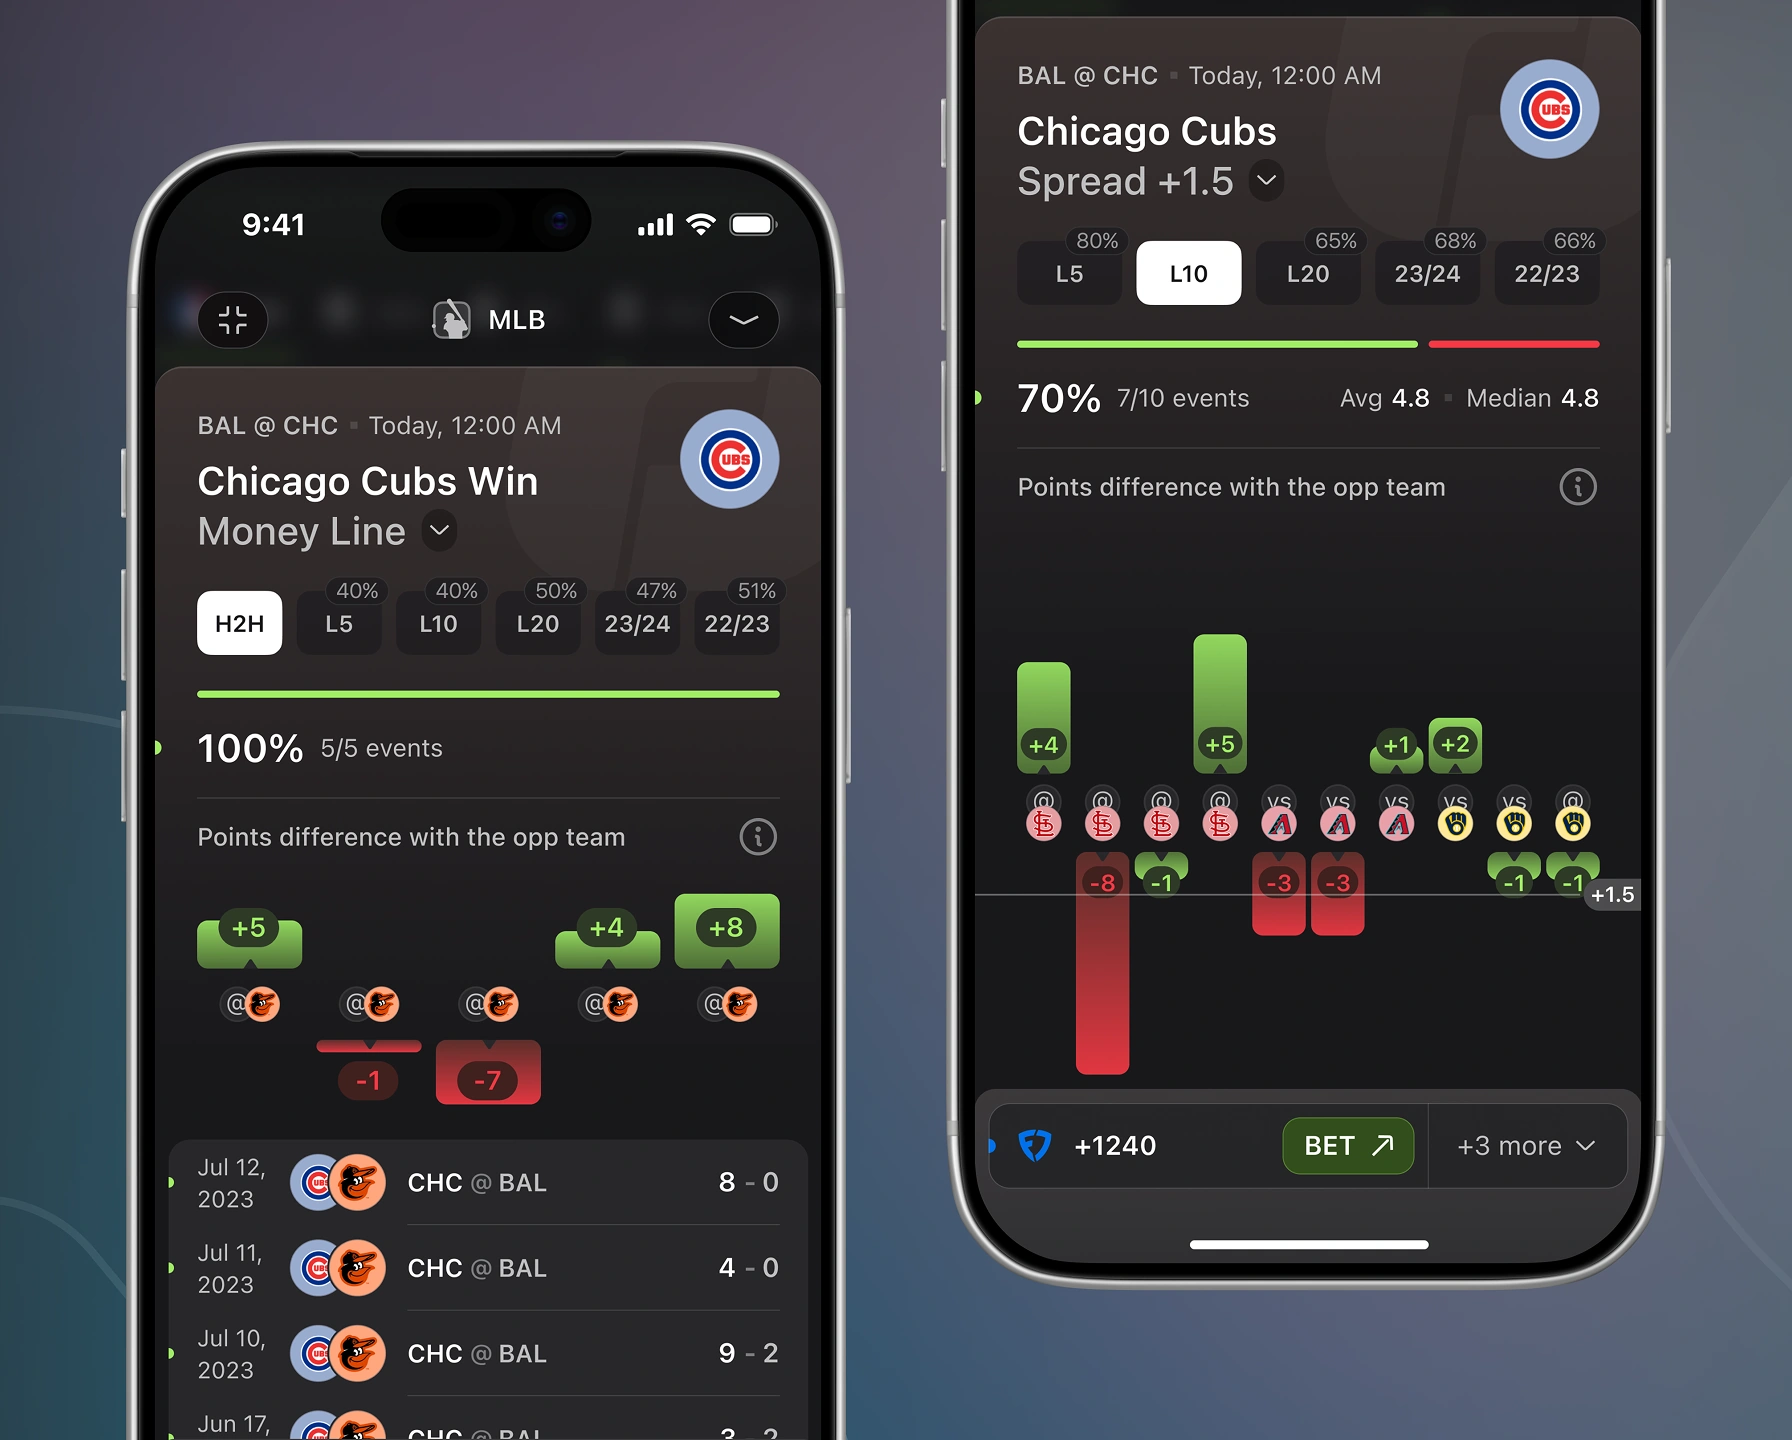
Both teams in a matchup get identical stat panels side by side for the same prop. Hit-rate bars, averages, and a game-by-game log update together when the selected tab or filter changes.
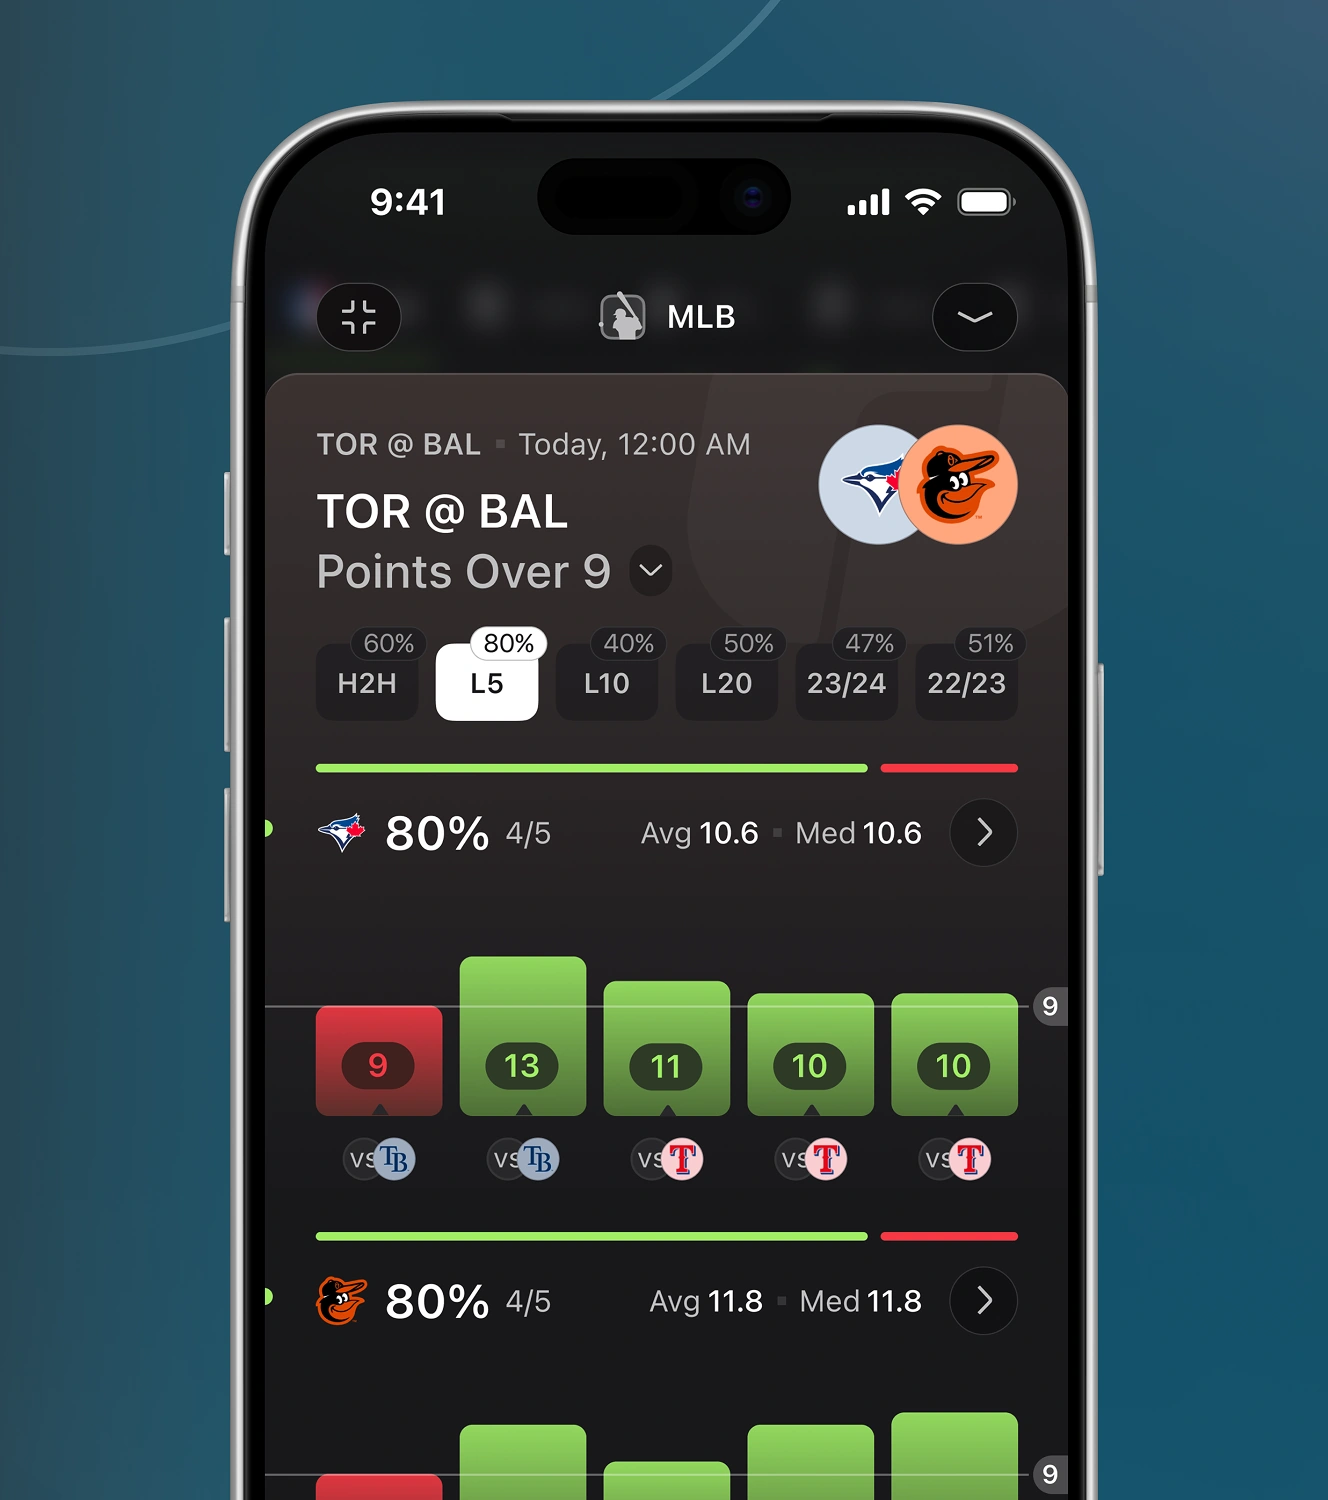
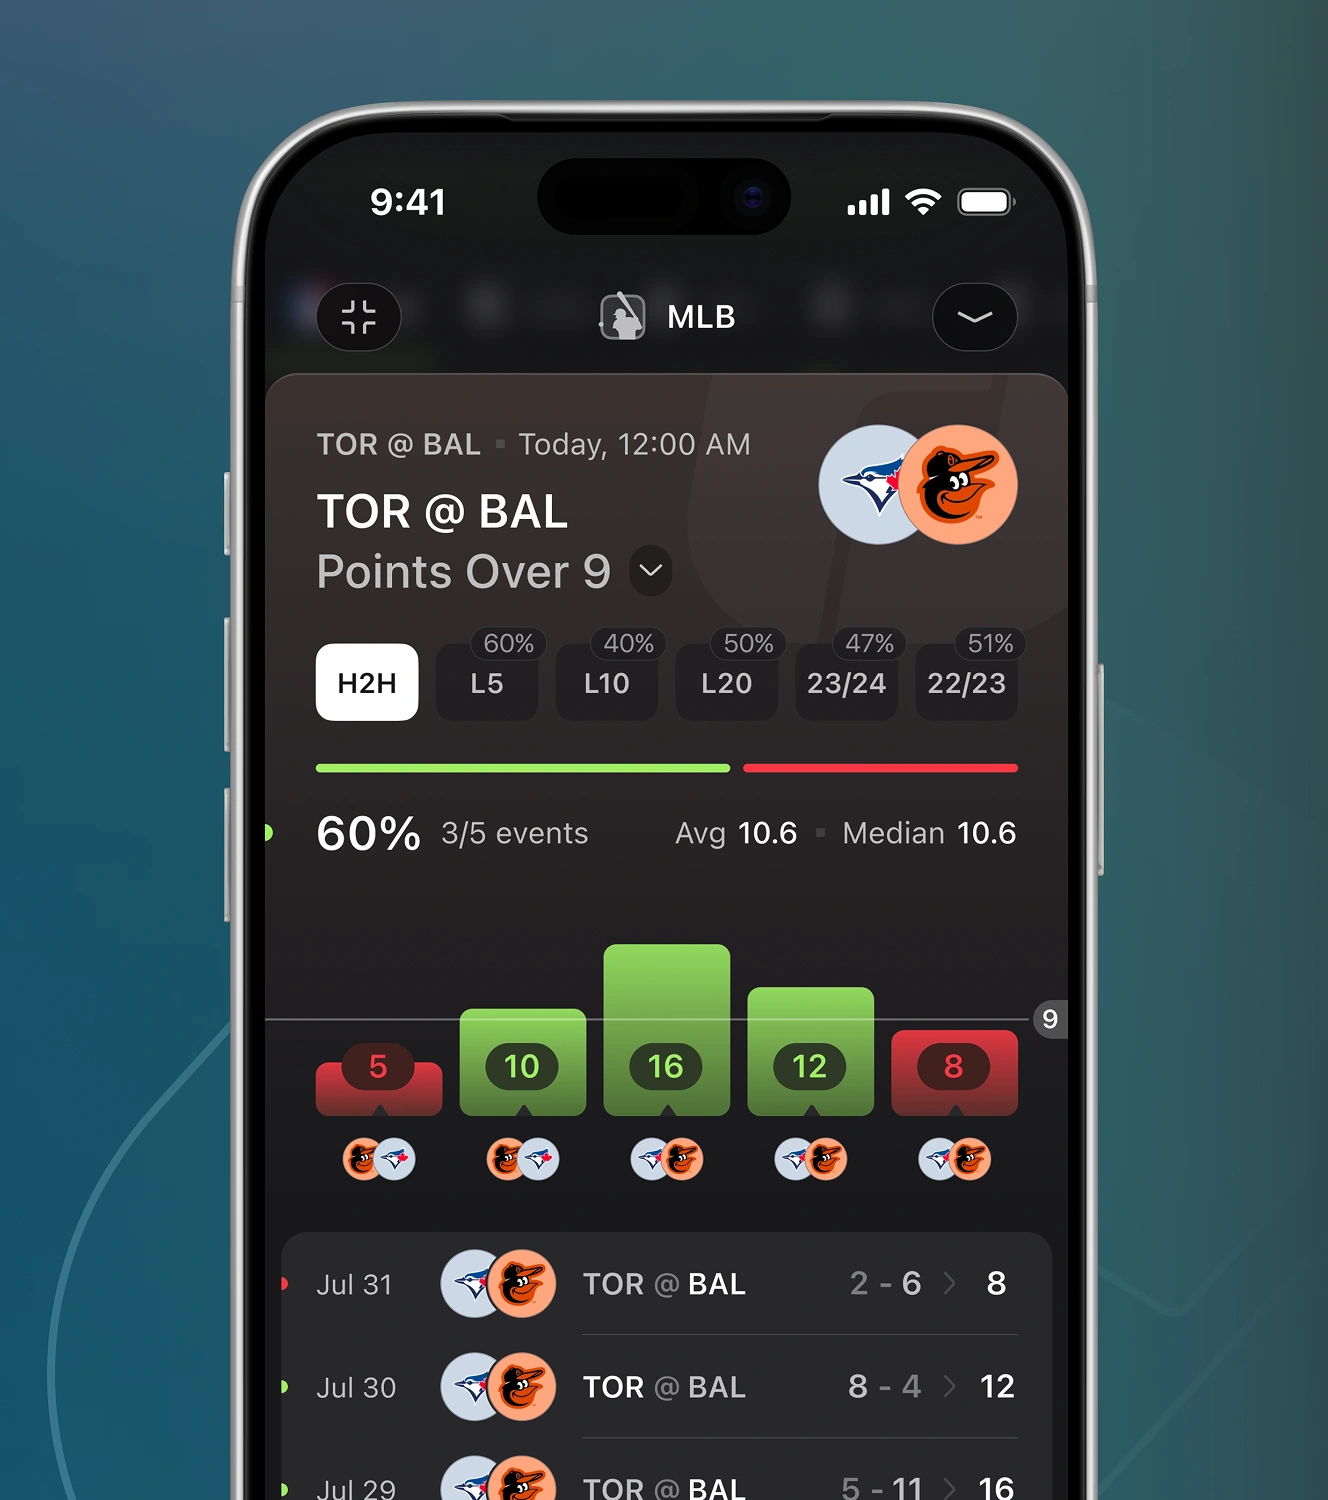
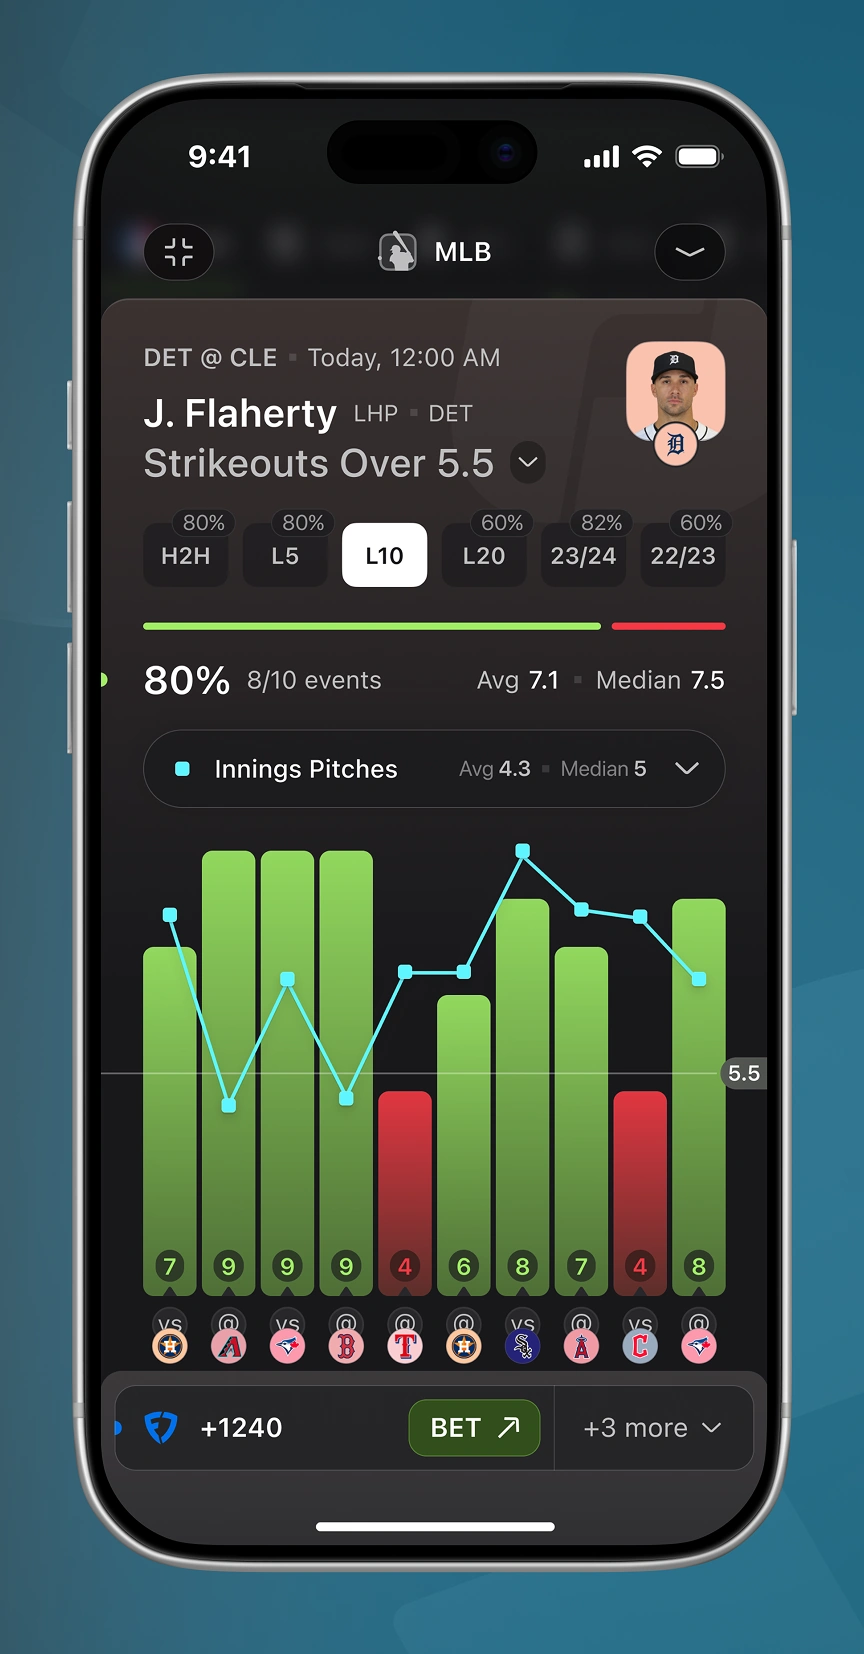
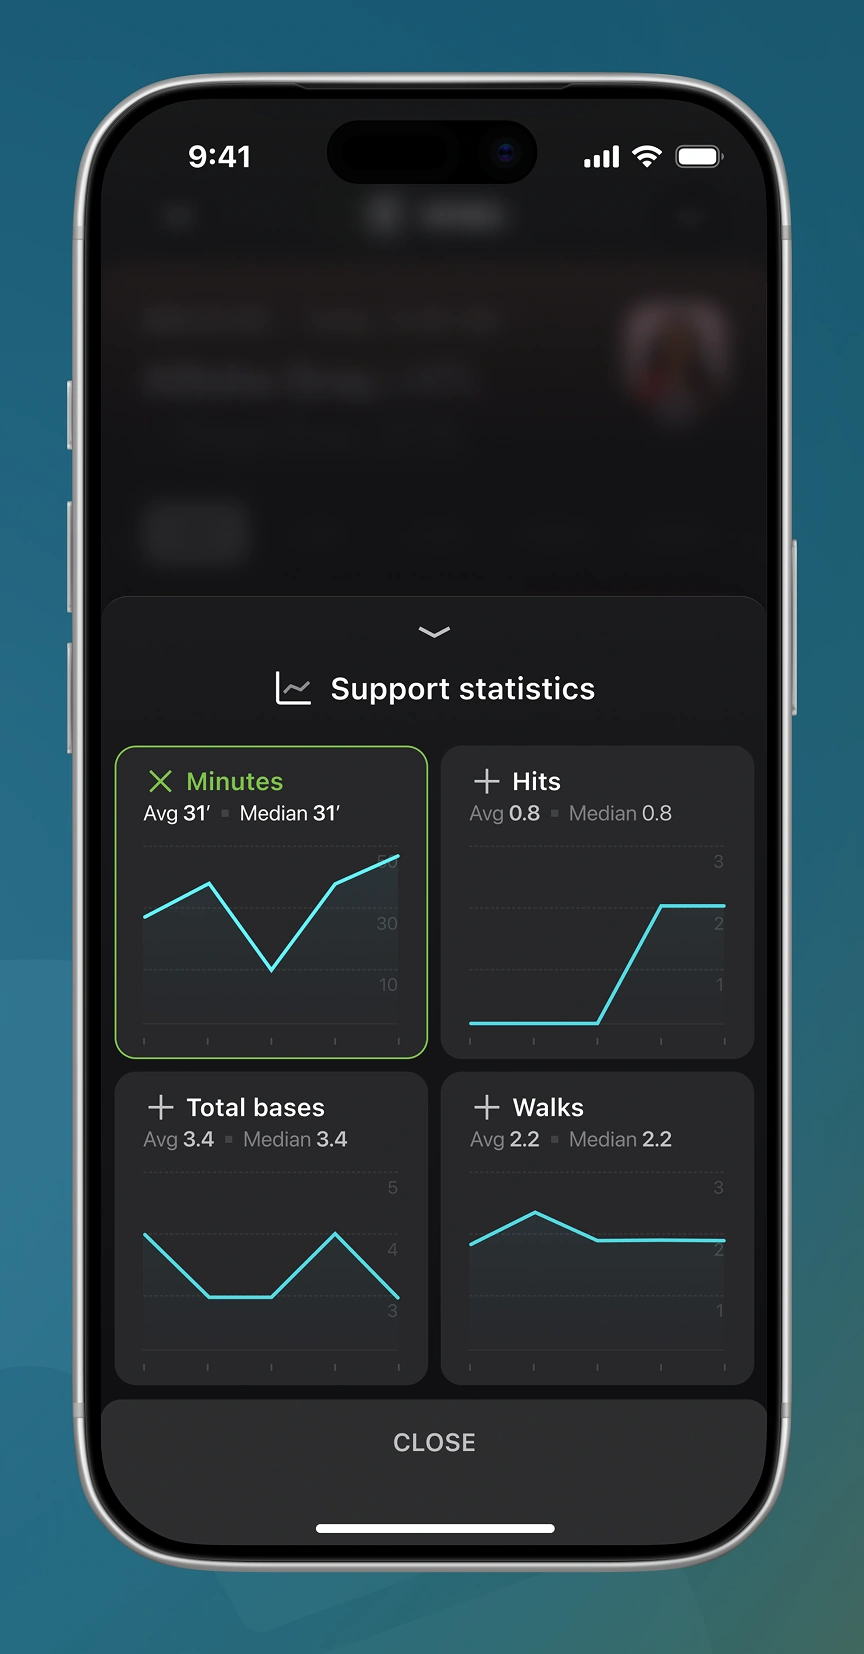
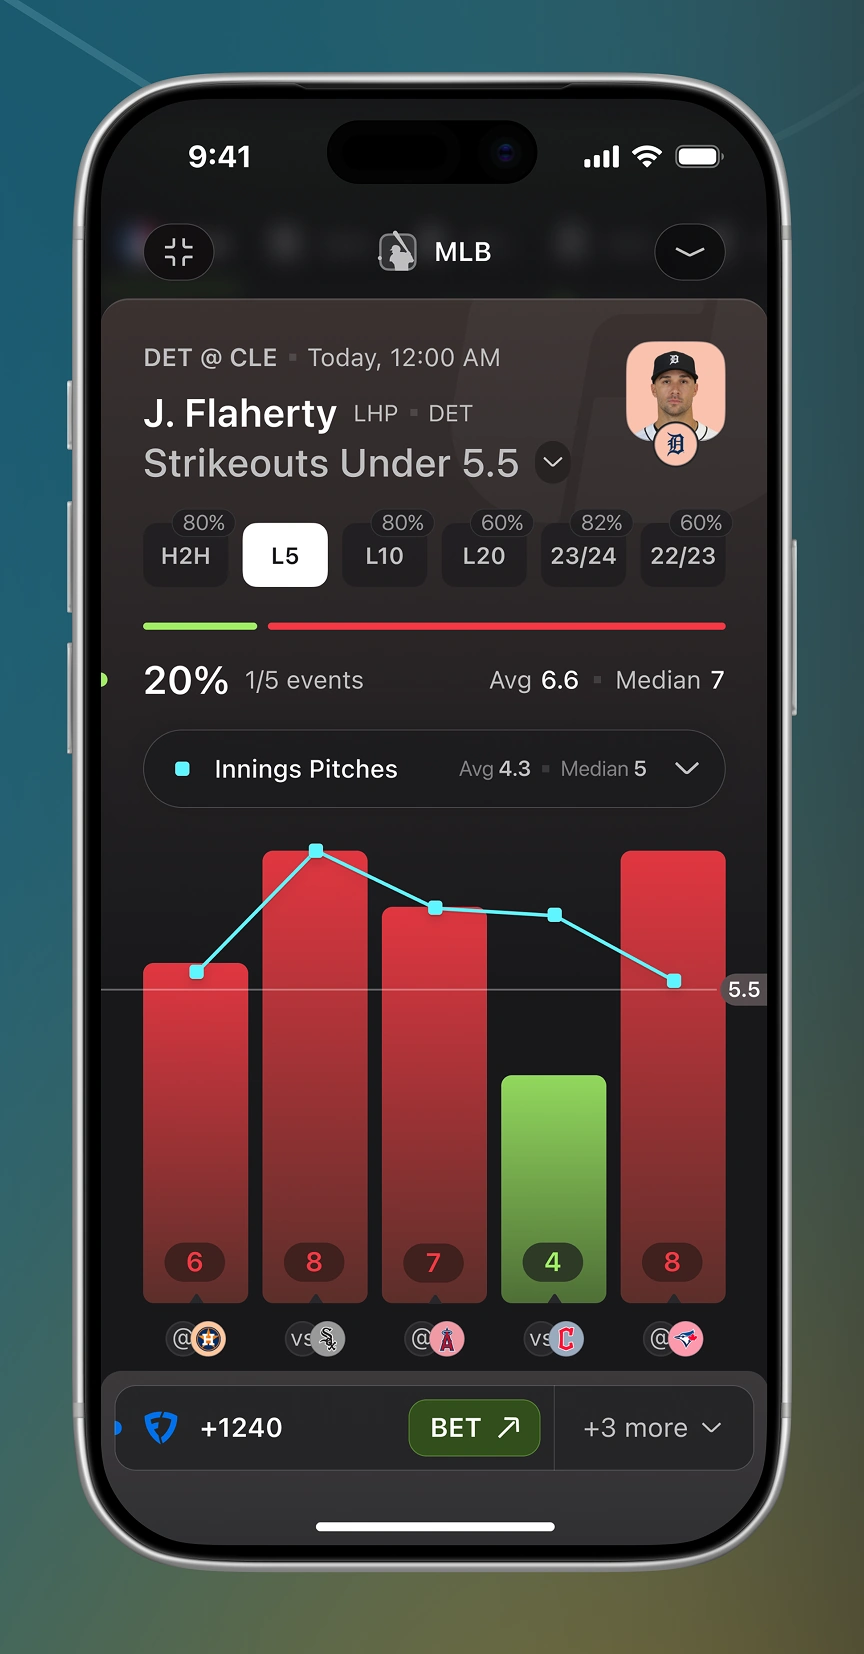
Switching a pitcher prop between flips the same hit-rate. A support-statistics panel opens four extra metrics, each with its own mini trend line.
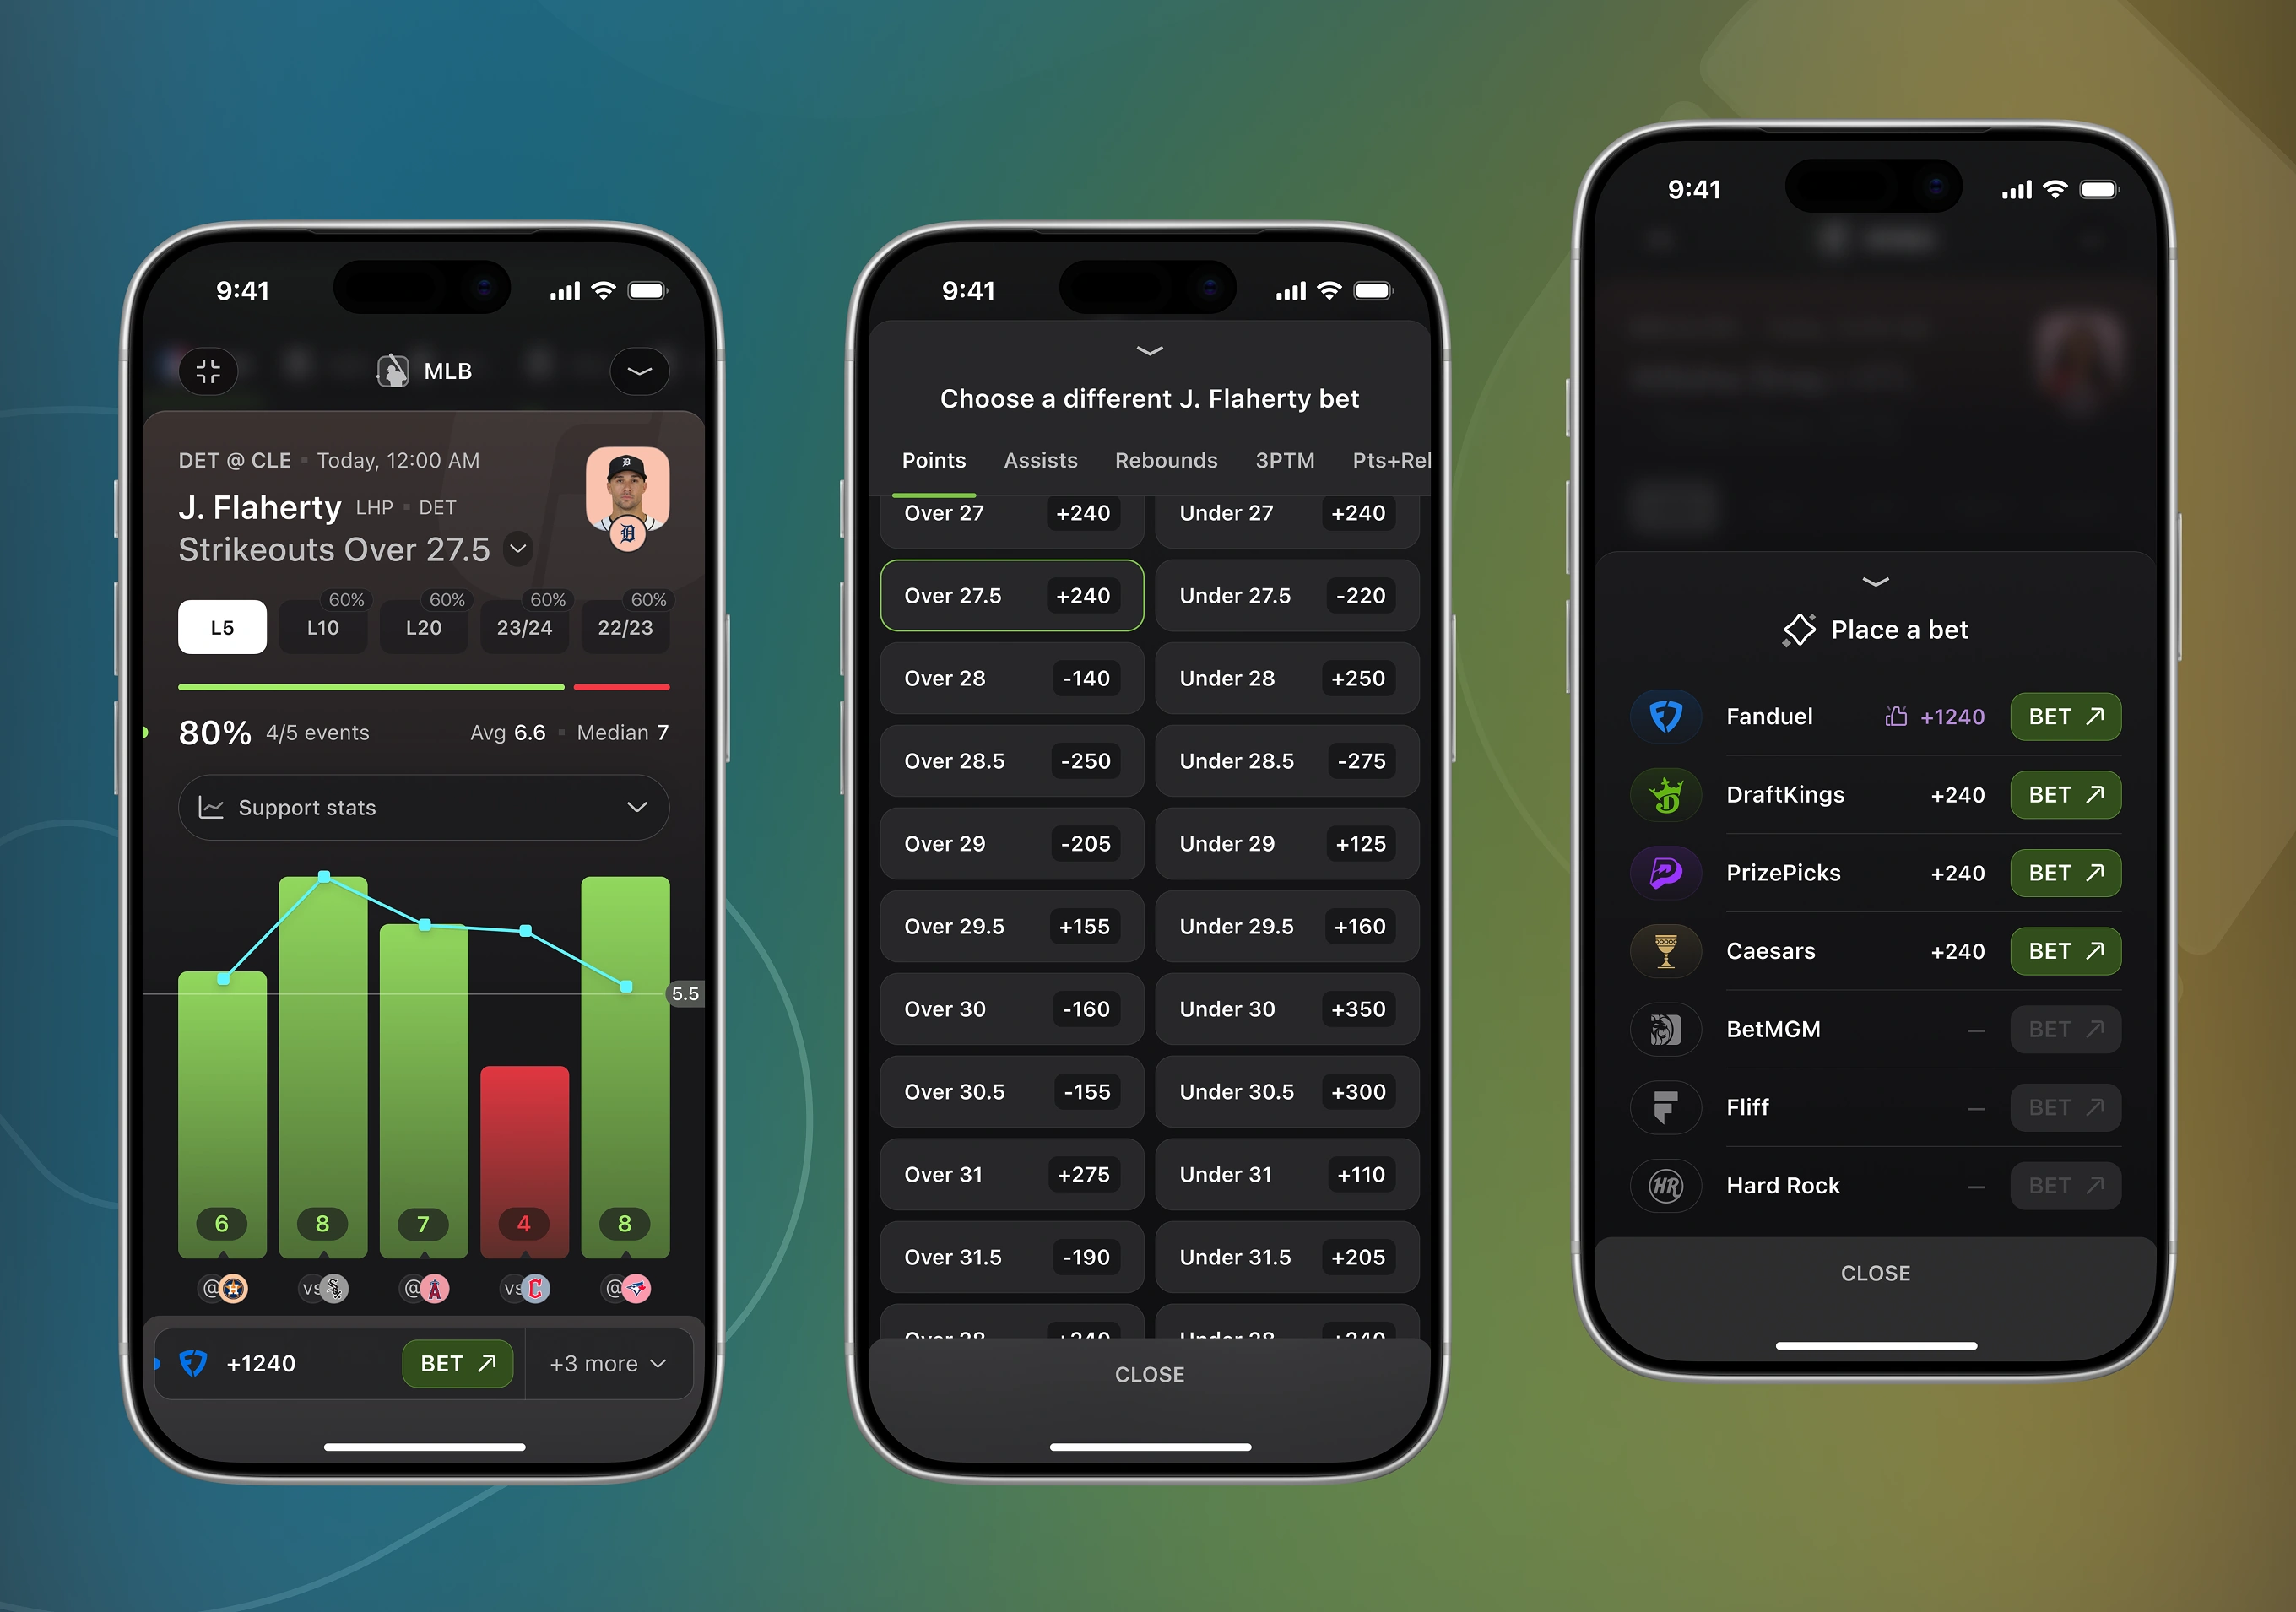
From one prop card, bettors switch to a different line for the same player across points, assists, or rebounds. Tapping a line opens a sheet listing odds, and sportsbooks.
In-app upsell. Sportsbook coverage table.
A premium subscription experience focused on feature discovery and conversion. The flow combines onboarding, plan comparison, and contextual upgrade prompts to help users understand the benefits of advanced betting tools.
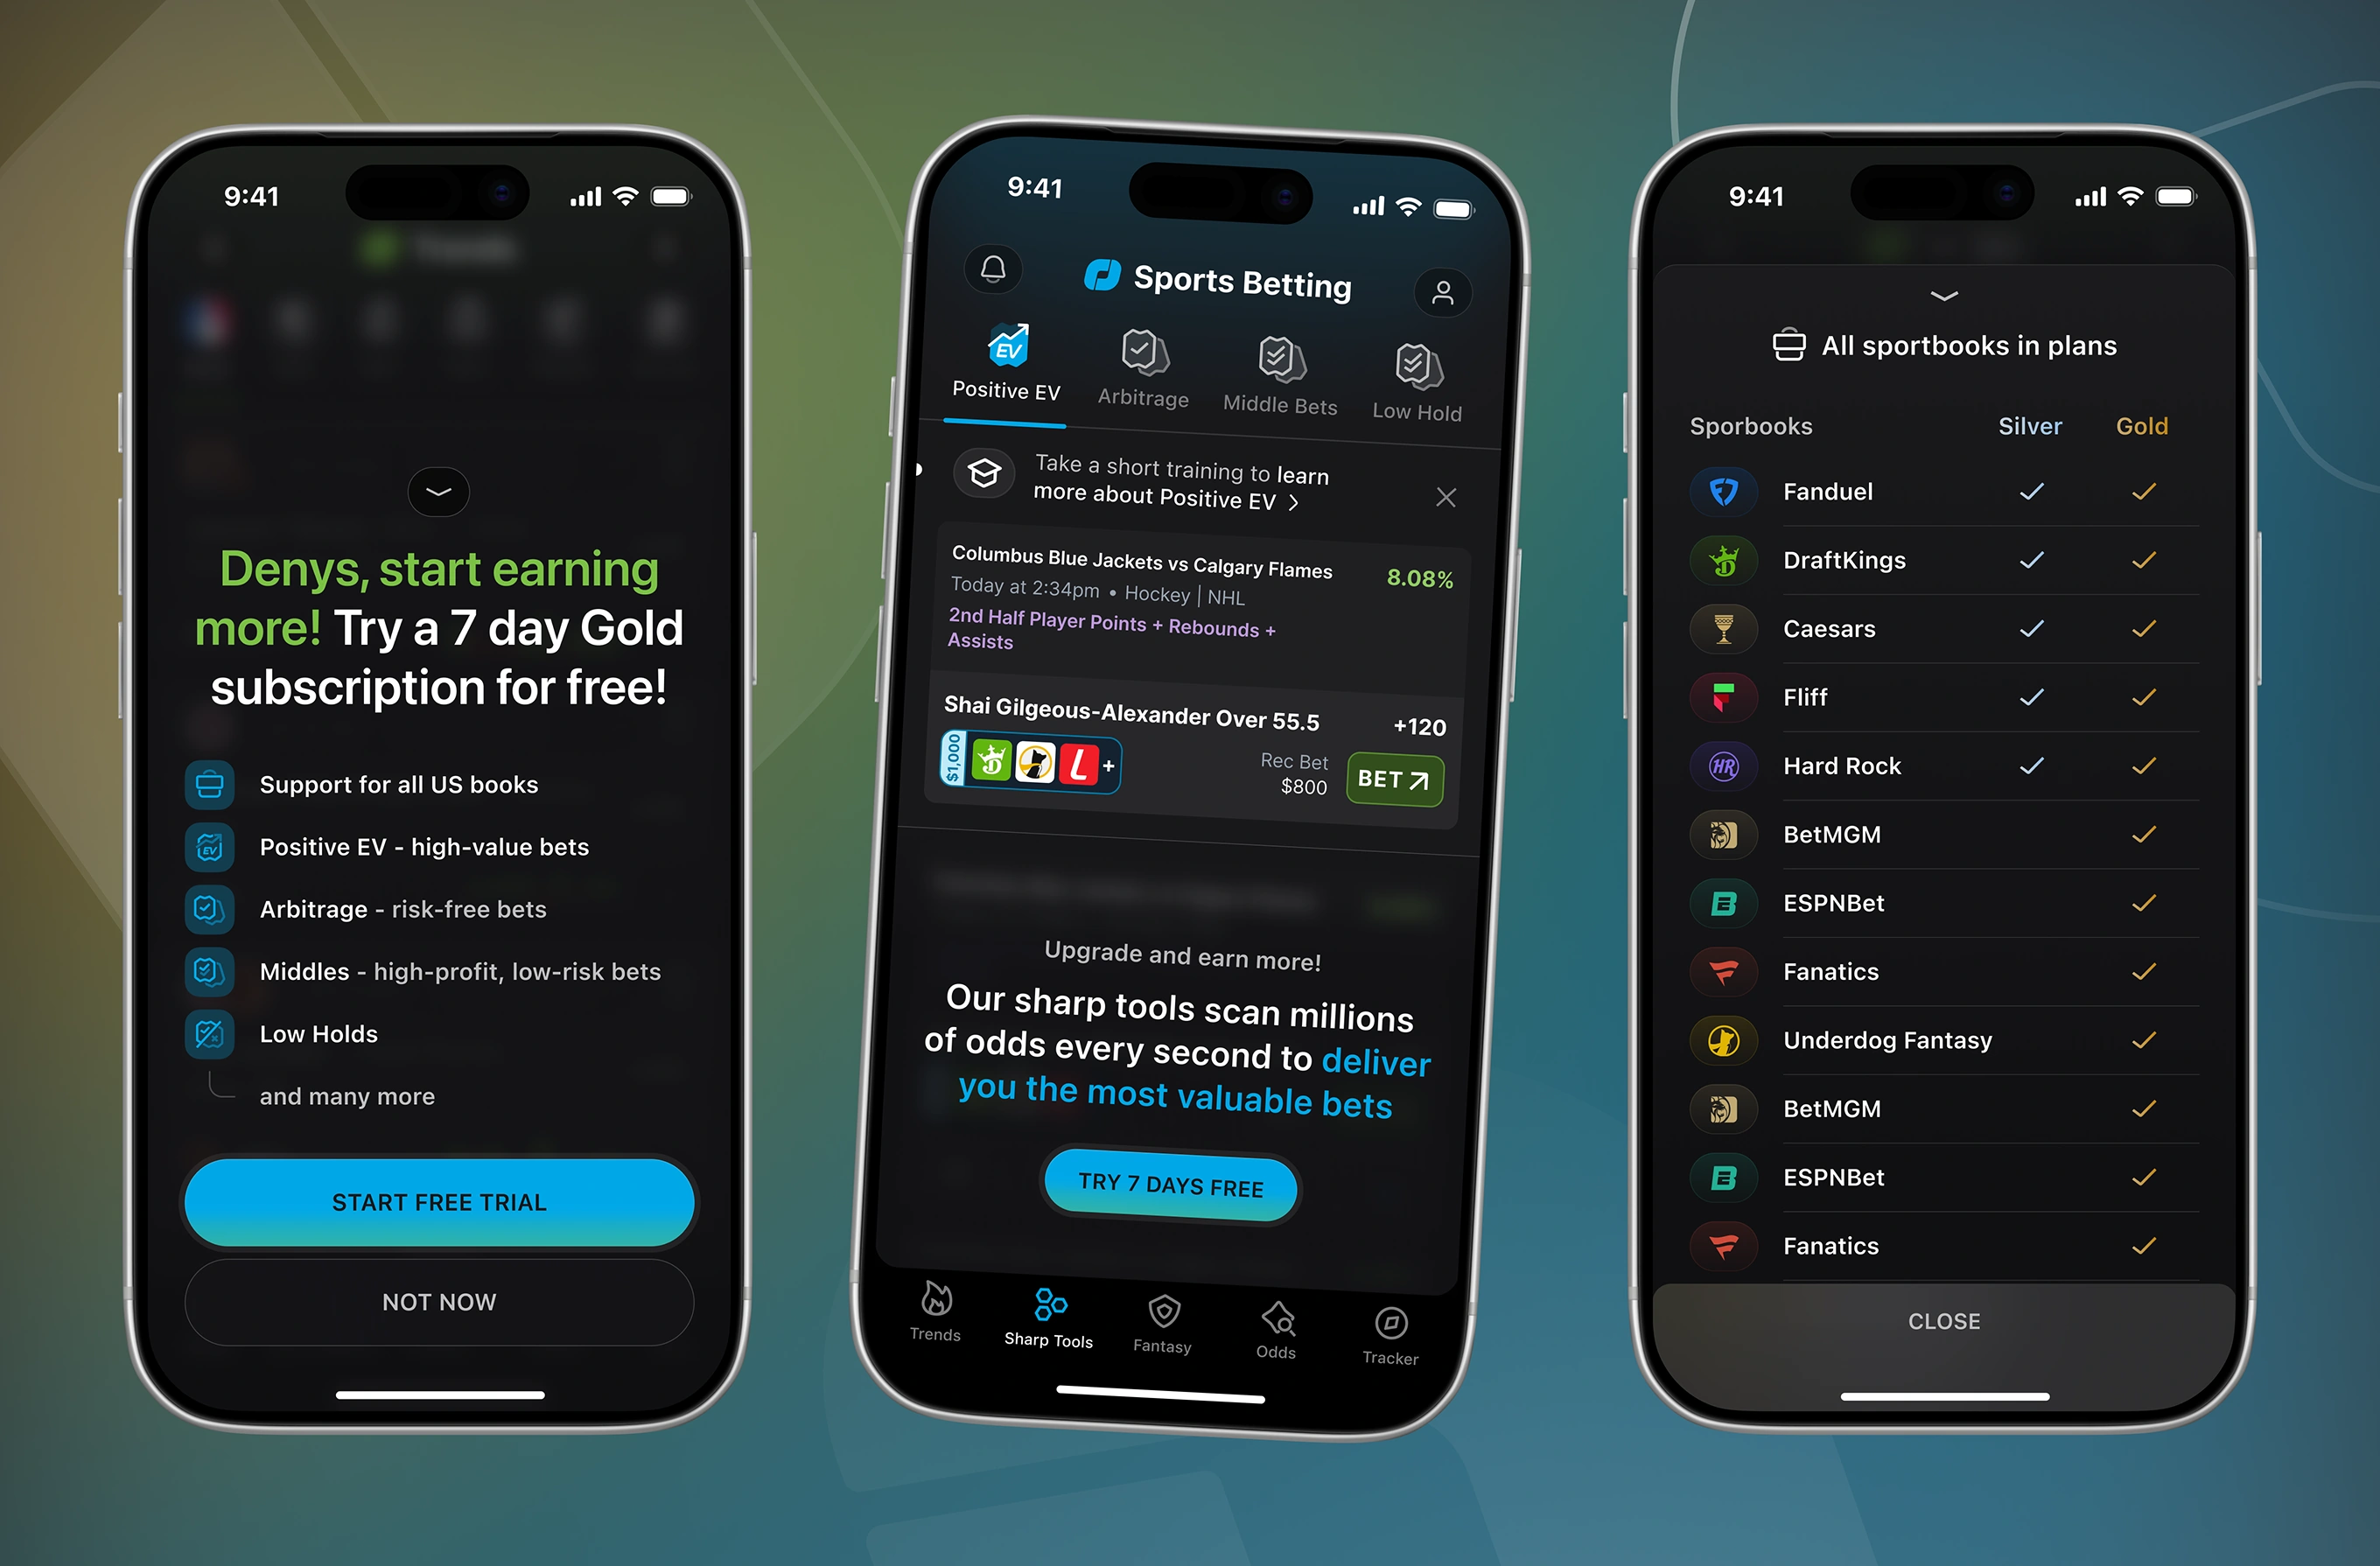
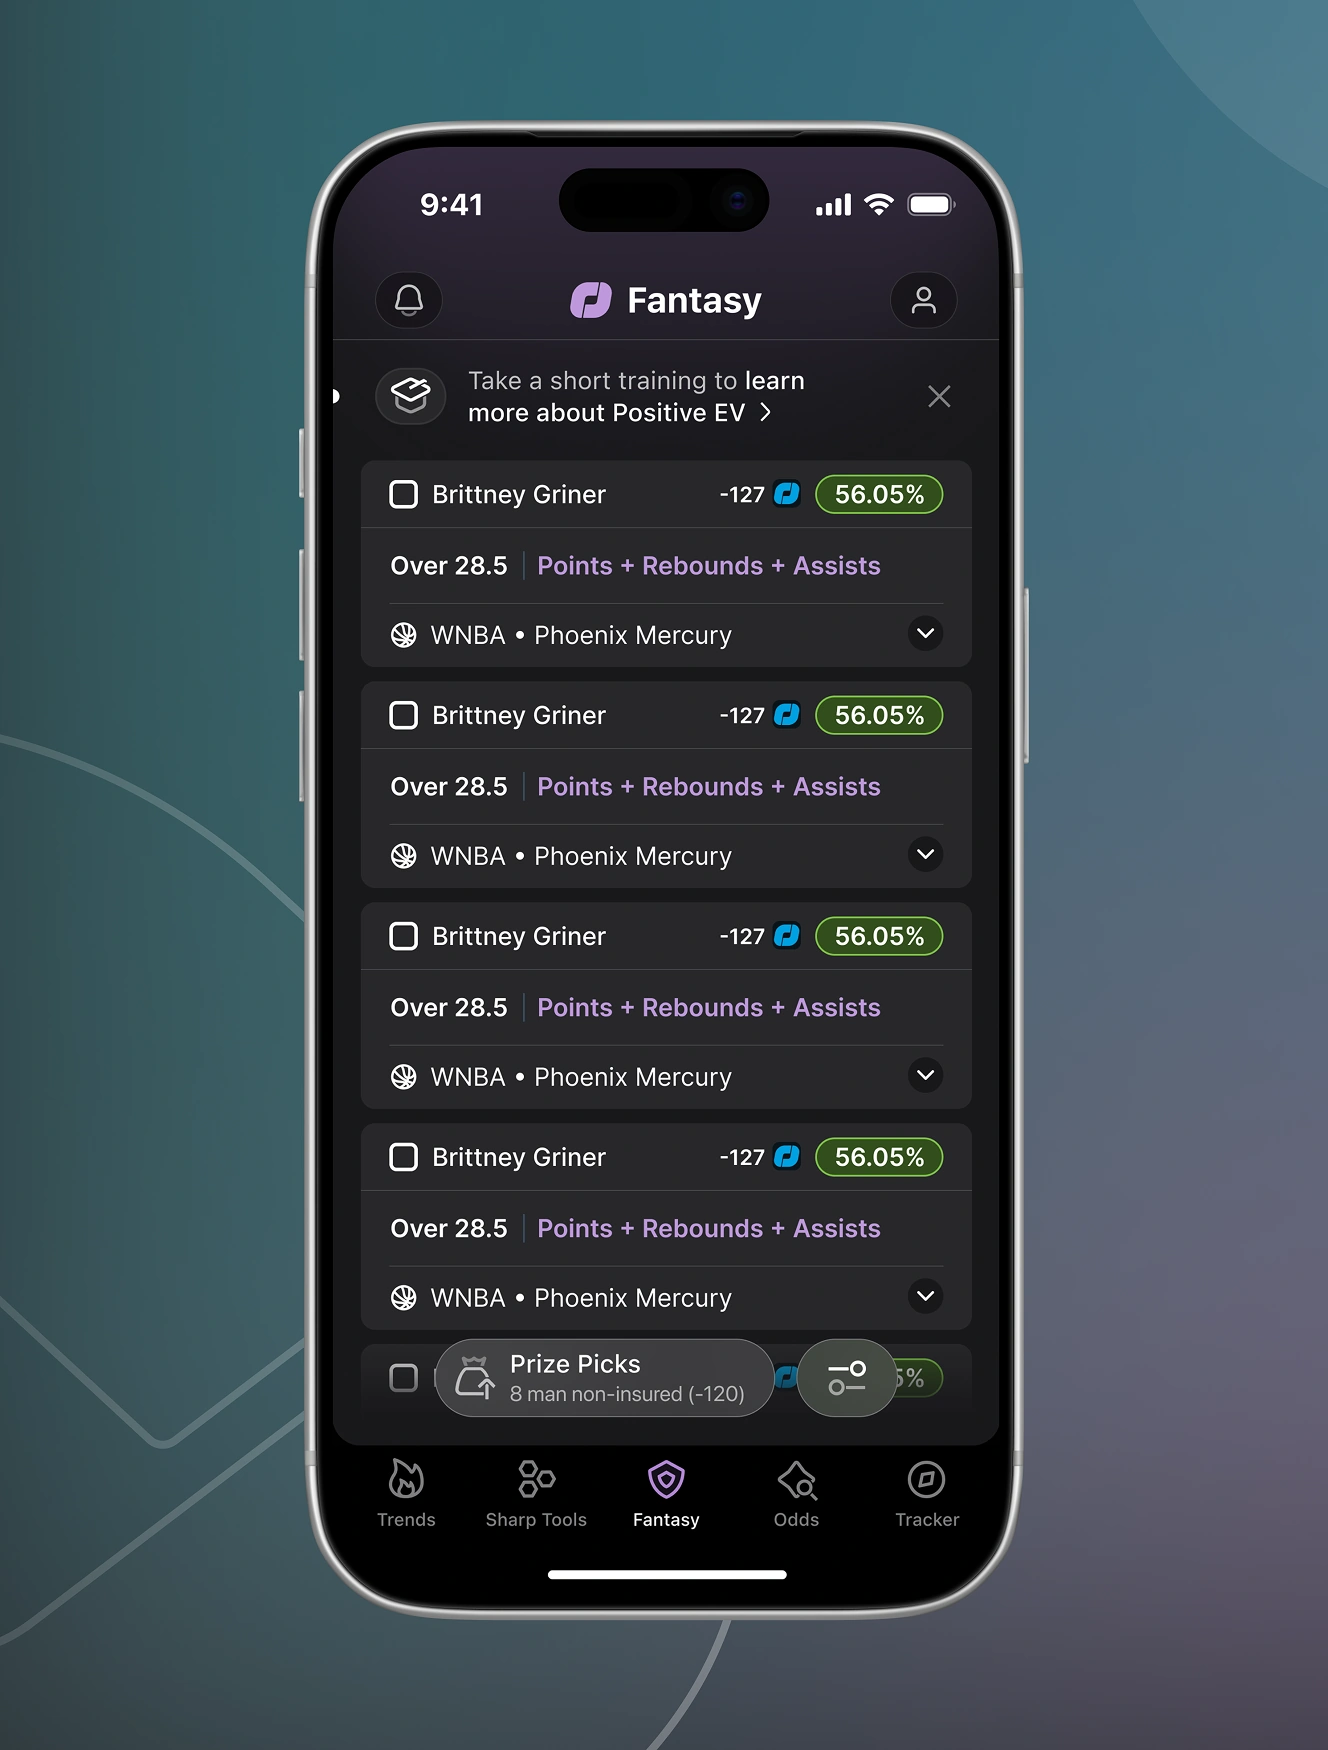
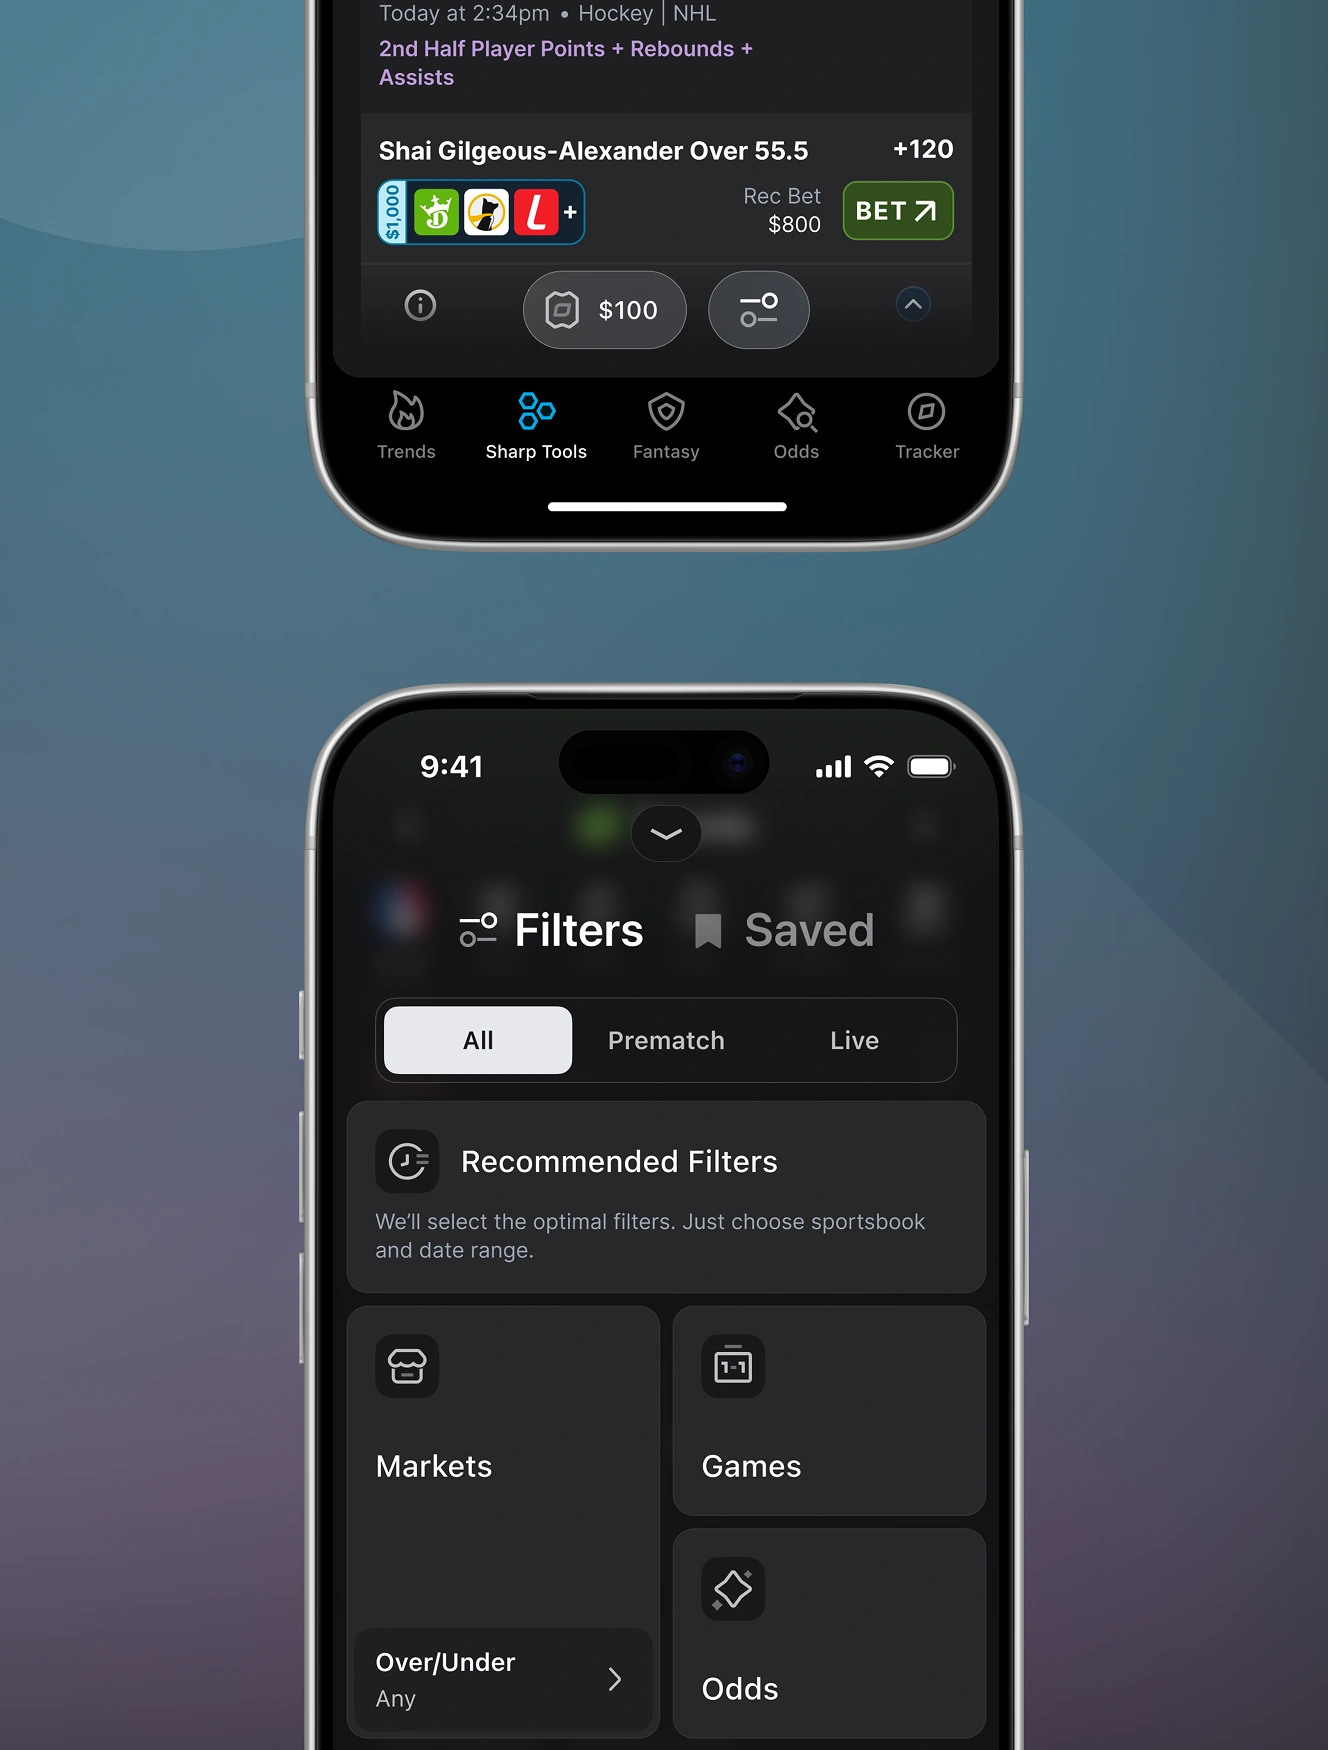
The Sharp Tools feed lists fantasy and sportsbook lines side by side. One-tap presets suggest starting filters, while saved combinations sit under a separate tab for quick reuse.


“Flatstudio delivered a 20% conversion rate to paid users, reaching 1,000+ subscribers at $20/mo in just six weeks with zero advertising. Their UX expertise eliminated user confusion, while their branding perfectly aligned with our target values. They are a massive asset to our product and growth strategy."

A trend indicator that reads negative but still supports a good bet — how do you design that for a sportsbook without confusing the user? State-flexible layouts encode direction, value, and betting relevance directly into the interface. Let's scope it.
