









View more
Published in
2023

Clouty. Music equity on a prediction & asset platform

Elena Buzila
Bohdan Kononets
Andrei Zolotukhin
Services
User Research
Information Architecture
UX Design
UI Design
Design System
Email & Newsletter Design
Illustration
Marketing Design
Landing Page Design
Component Library
Wireframing
Market Research
Deliverables
Deployed Web App
Research Findings
Information Architecture Map
Figma Source Files
User Personas
High-Fidelity Mockups
Design System
Component Library
Asset Pack
Technical Documentation

Clouty is a data-driven prediction market for music assets.

We built it from a one-line concept into a professional-grade financial platform, covering user research, information architecture, and a full design system. Clouty needed to turn an early idea into something investable – and the product was completed as scoped, though Clouty did not secure funding.

Visual Design System for Music Markets

A single visual system, first shaped under Pitch & Product Concept, carries color, icon, and card design from genre index cards to artist pages and price charts. 3D icons and color-coded cards mark each market type, and the styling adapts to mobile.
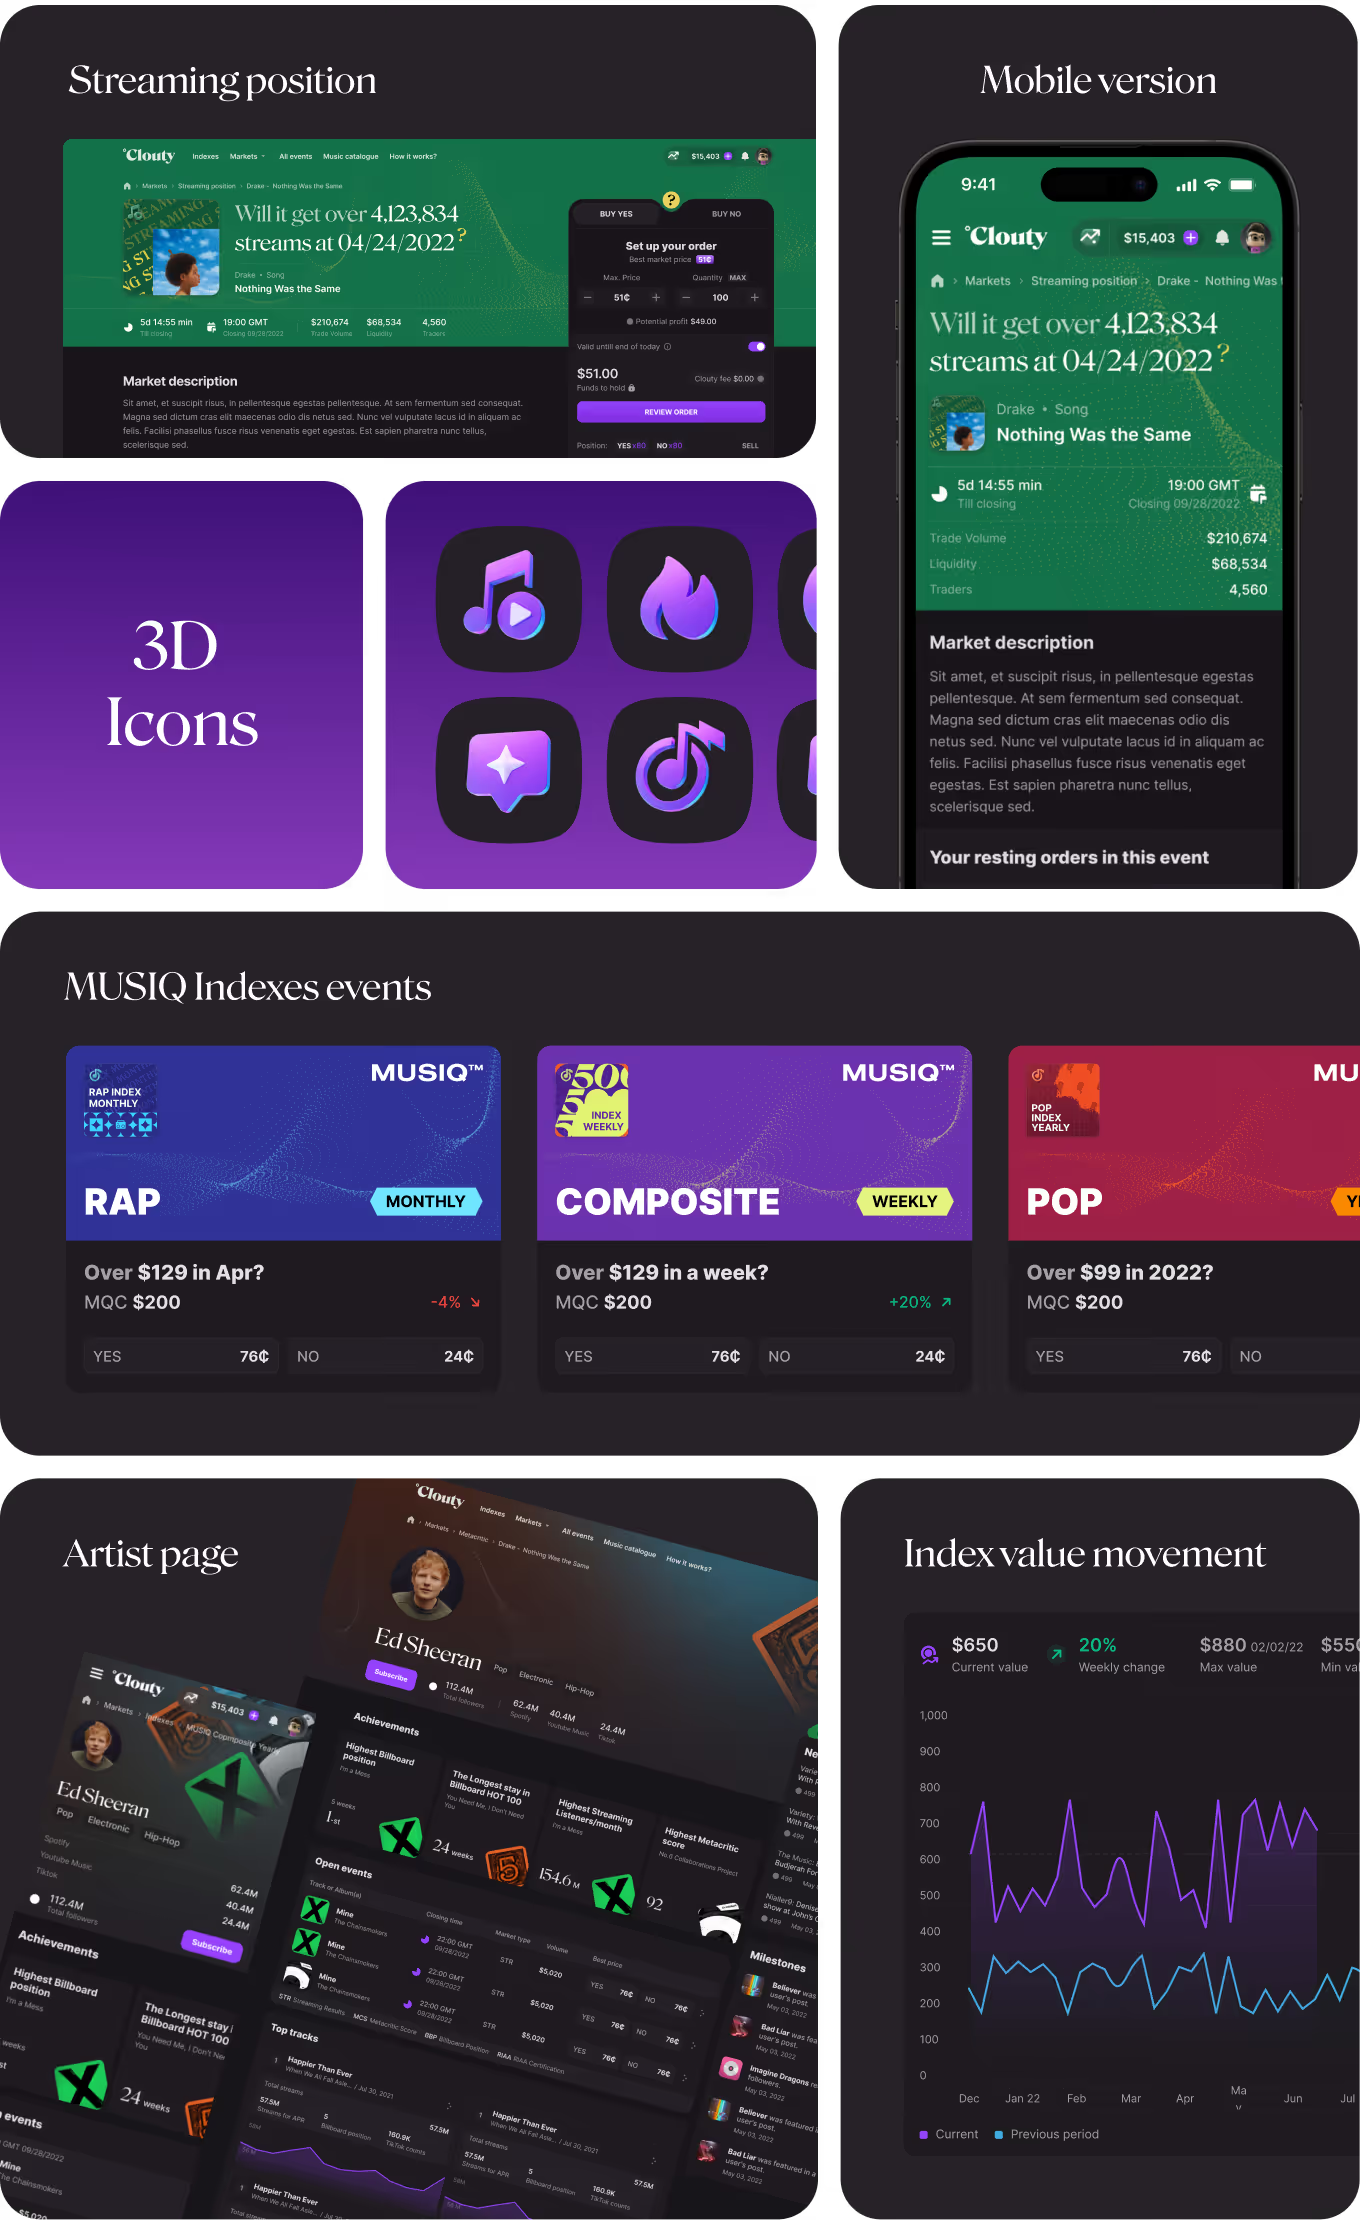
Design system preview showing 3D icons, market cards, artist page, and index charts

Homepage Structure for Market Categories

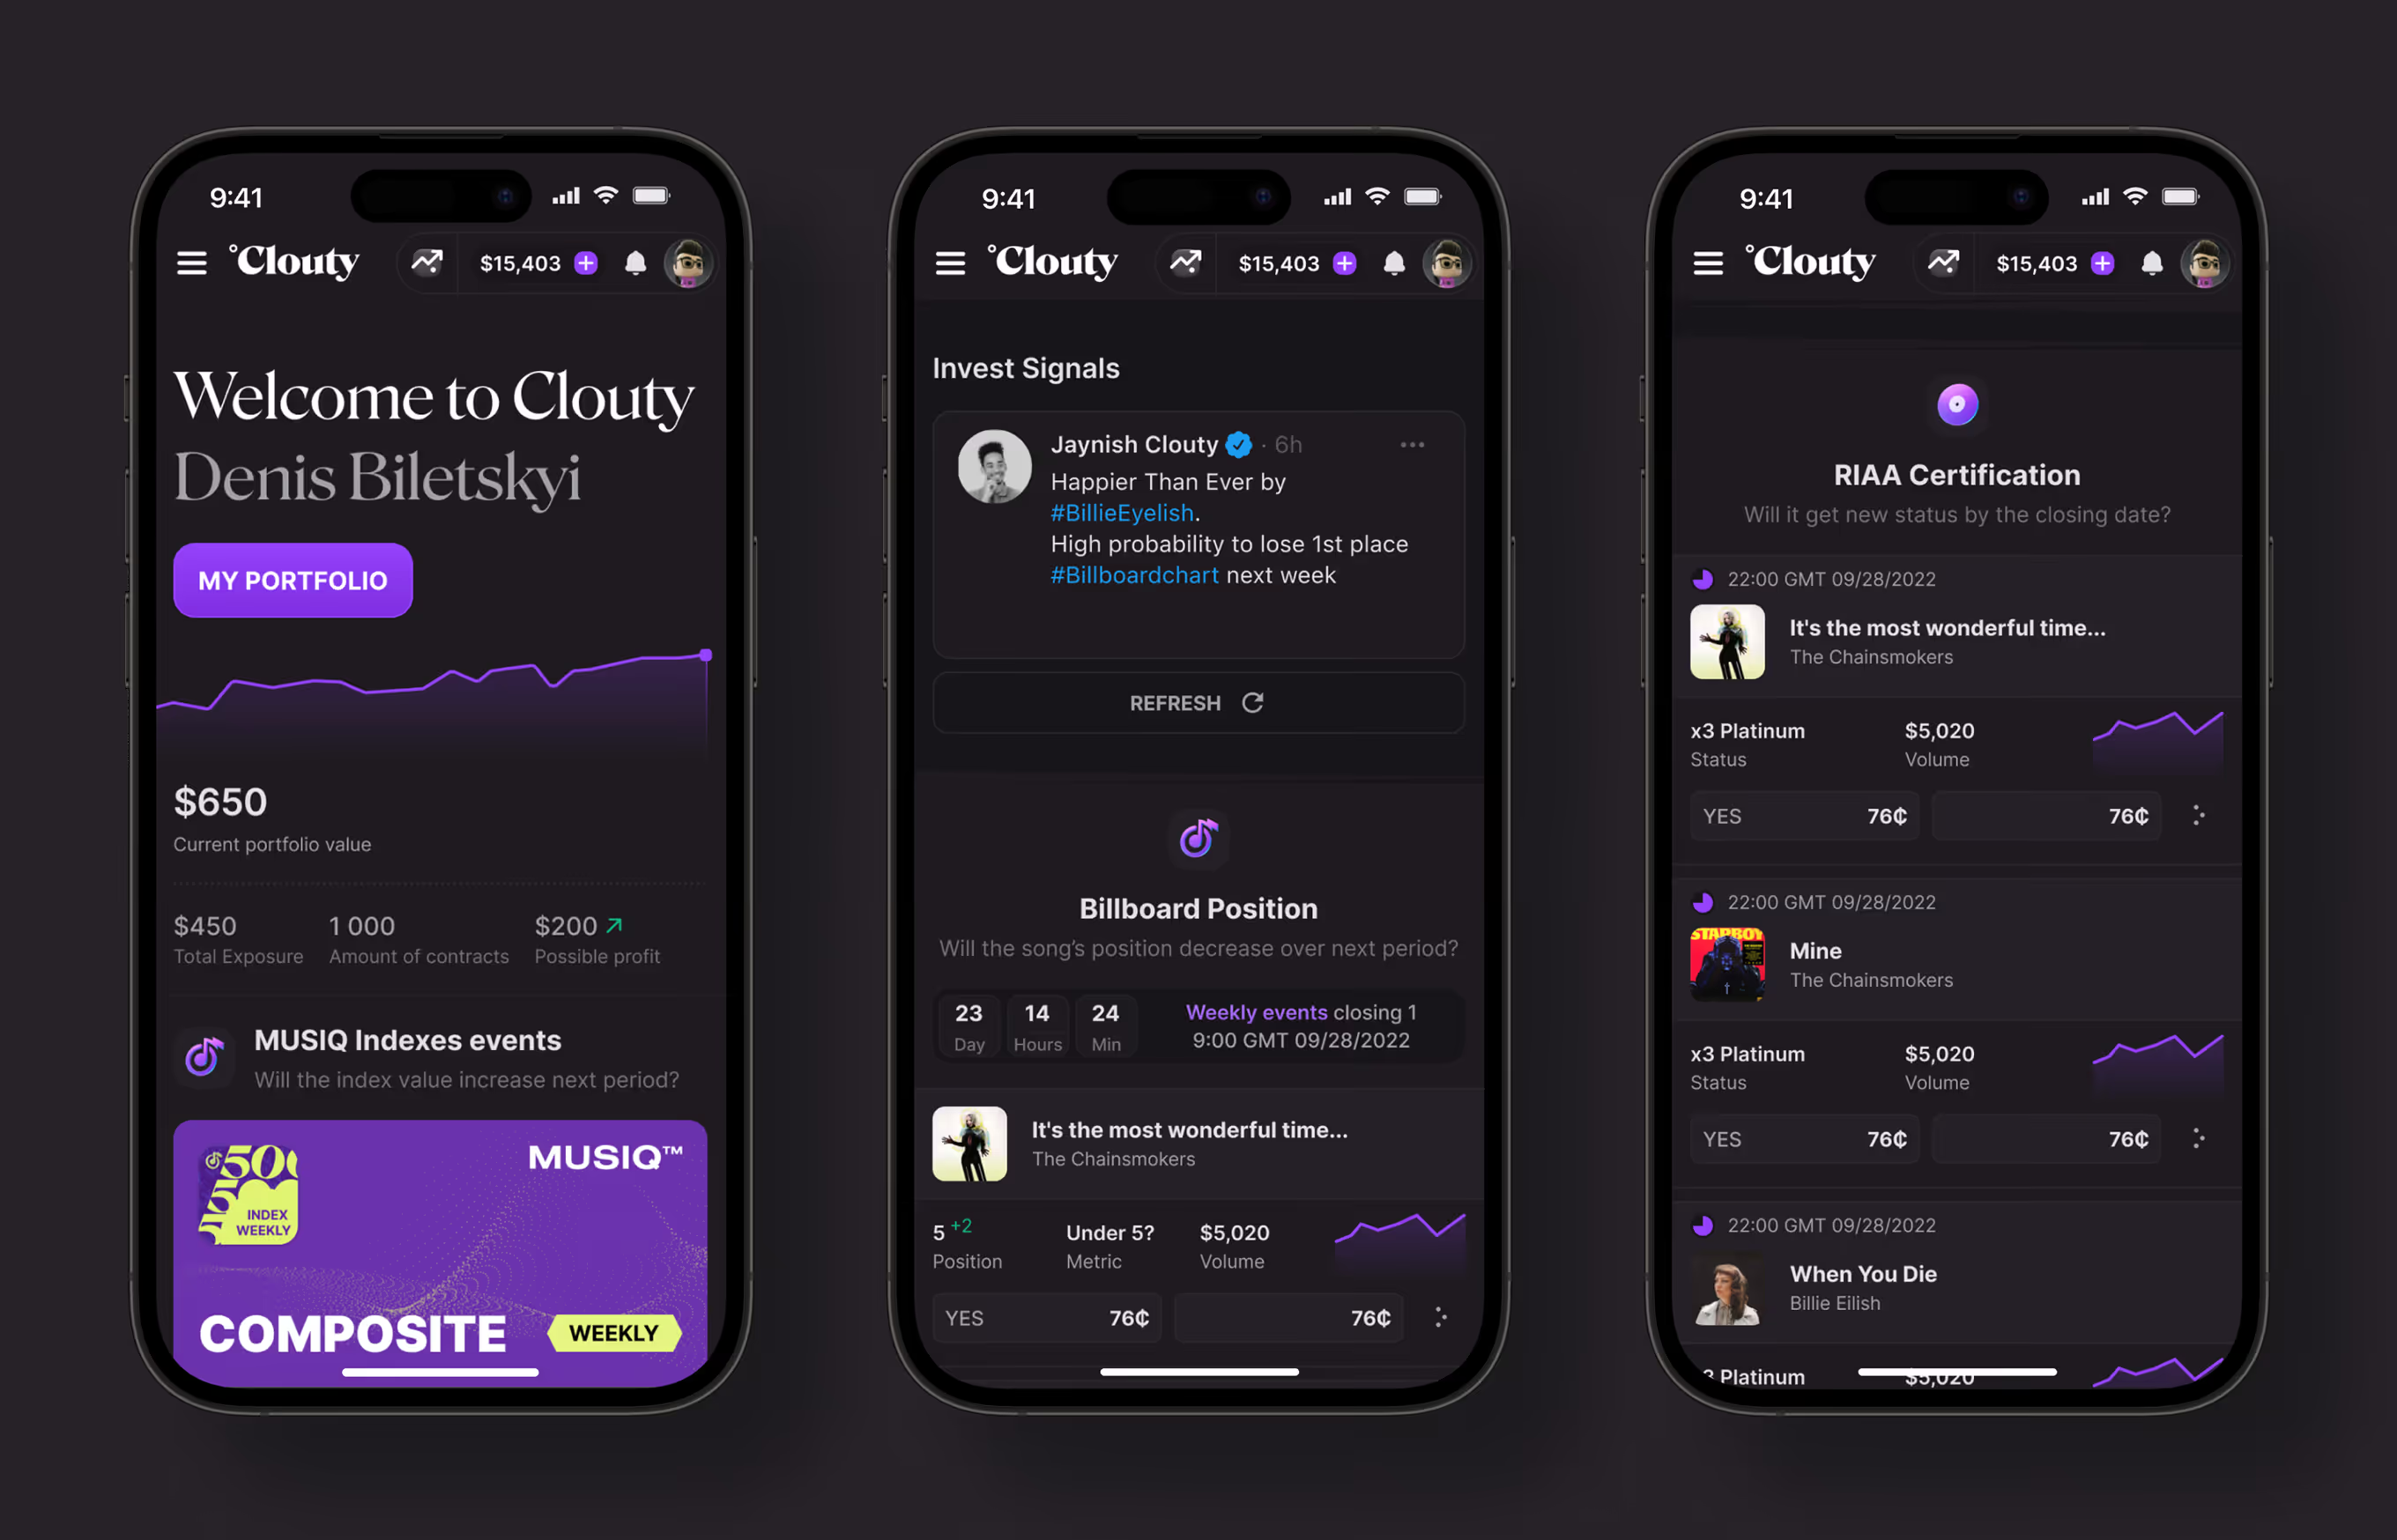
The homepage organizes the whole product at a glance, with portfolio balance and a live Invest Signals feed up top. Separate category tables below cover Billboard, streaming, certification, and score-based markets.
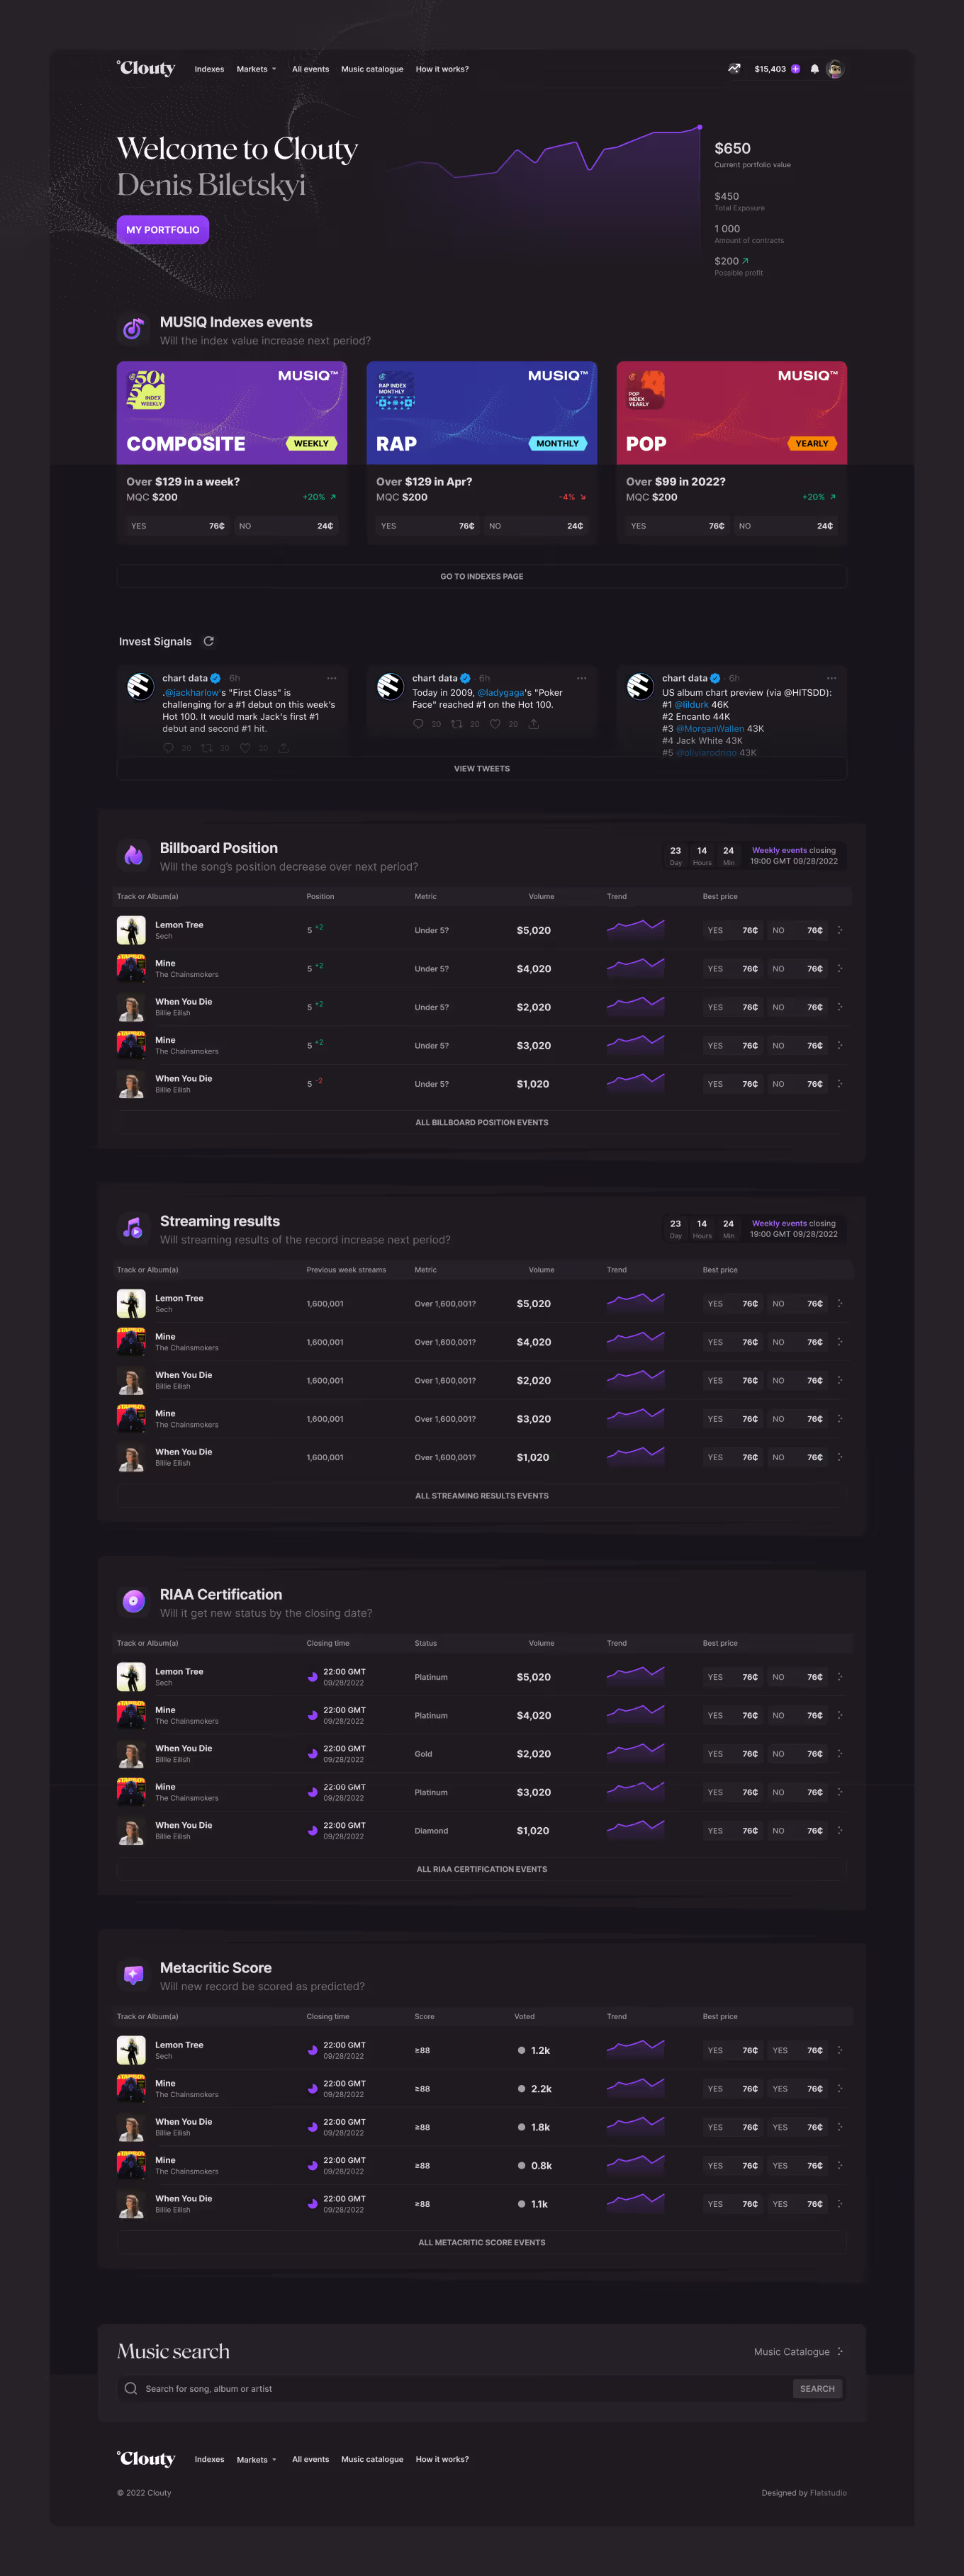
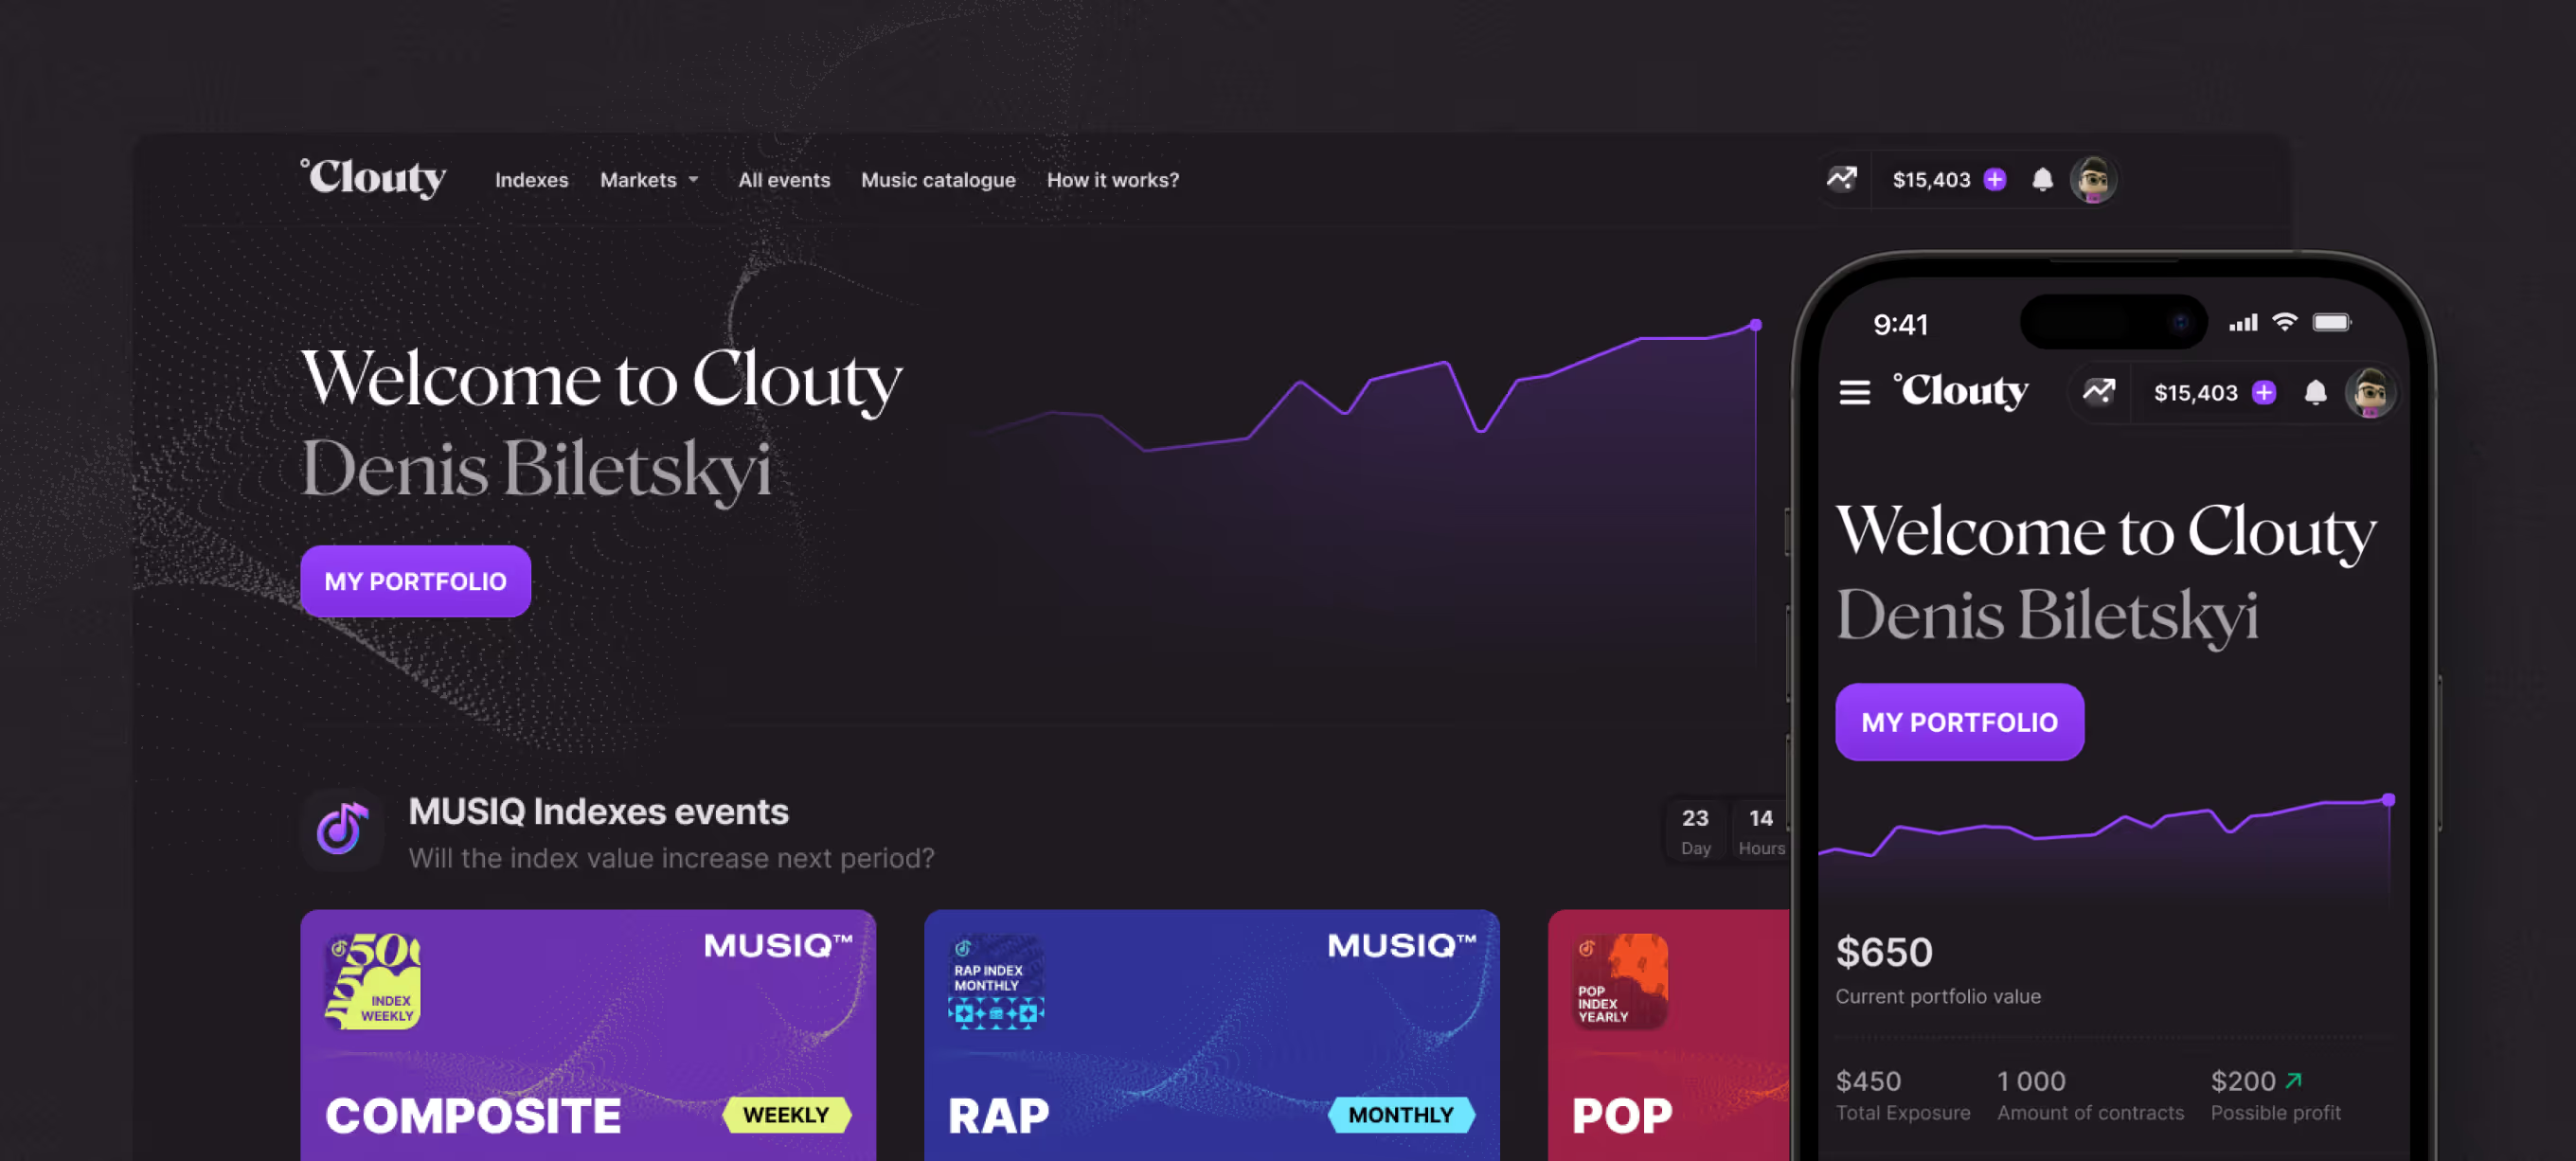
Clouty dashboard showing portfolio value, MUSIQ index events, and streaming data tables
Mobile dashboard, Invest Signals feed, and RIAA Certification screens for a music prediction platform

Composite to Genre Market Structure

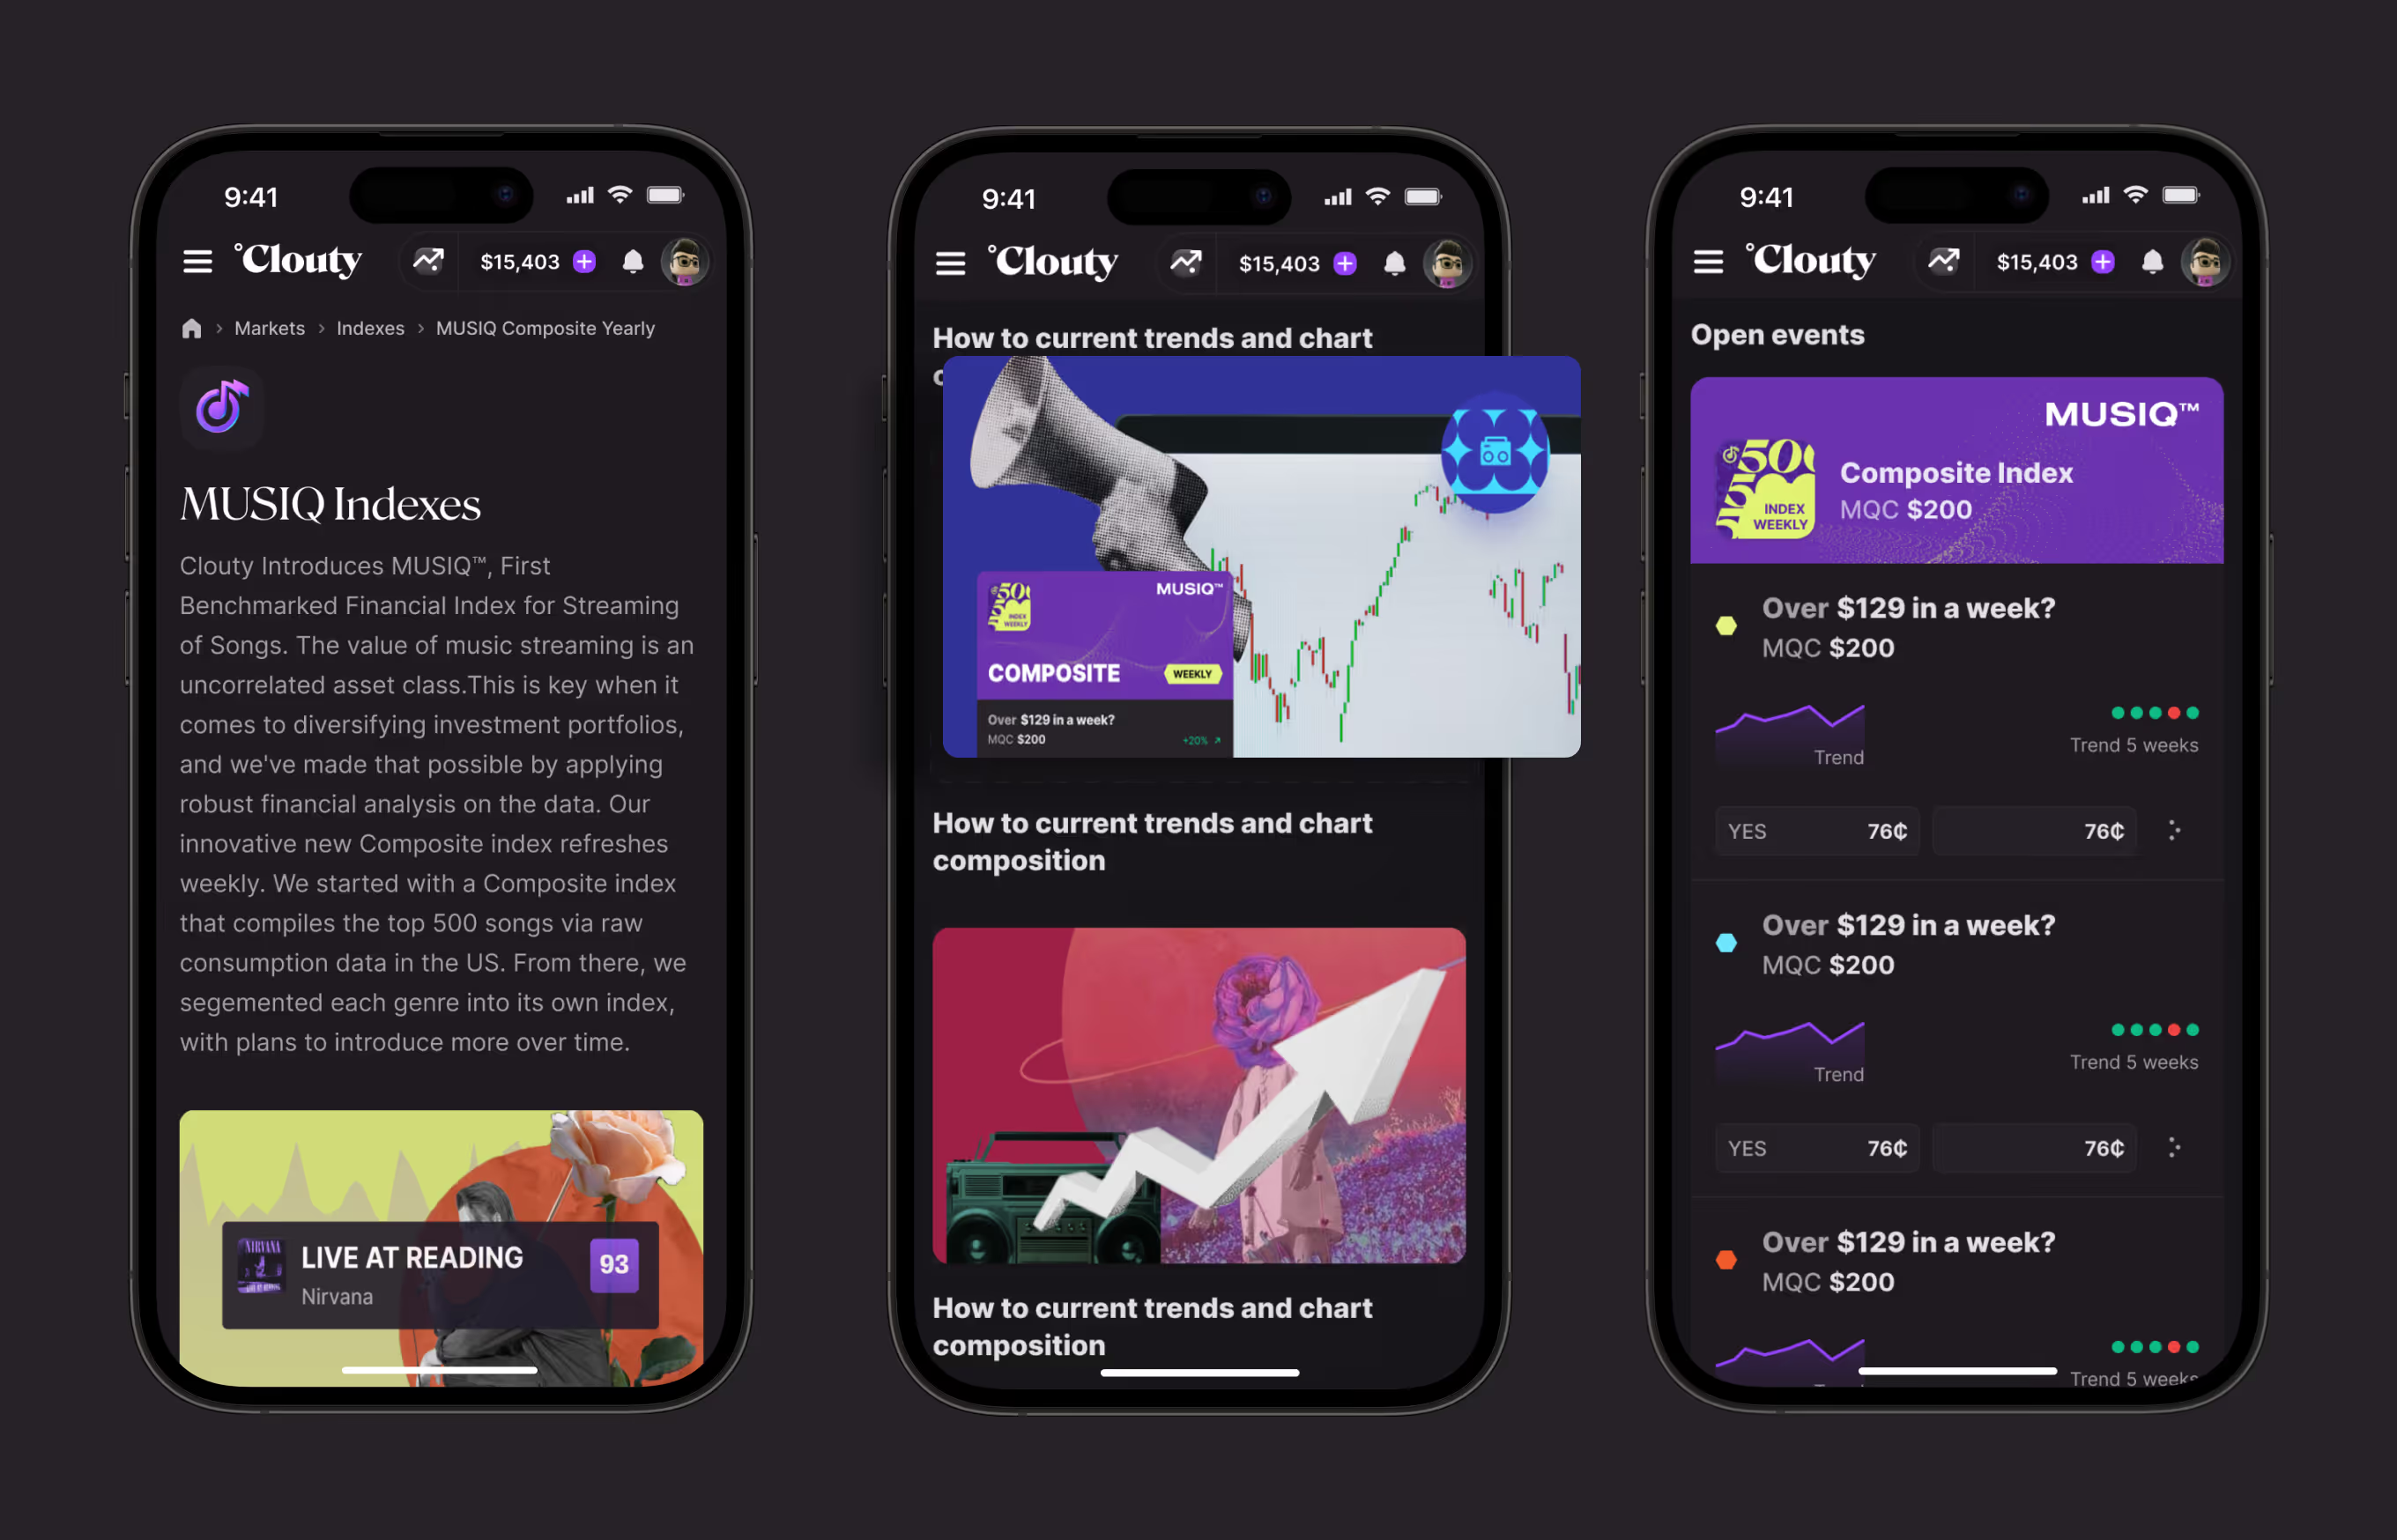
Each index type on this page branches into separate weekly, monthly, and yearly markets, and each time frame becomes its own tradeable event with a trend line and live price. The same pattern repeats across every index, genre or otherwise.
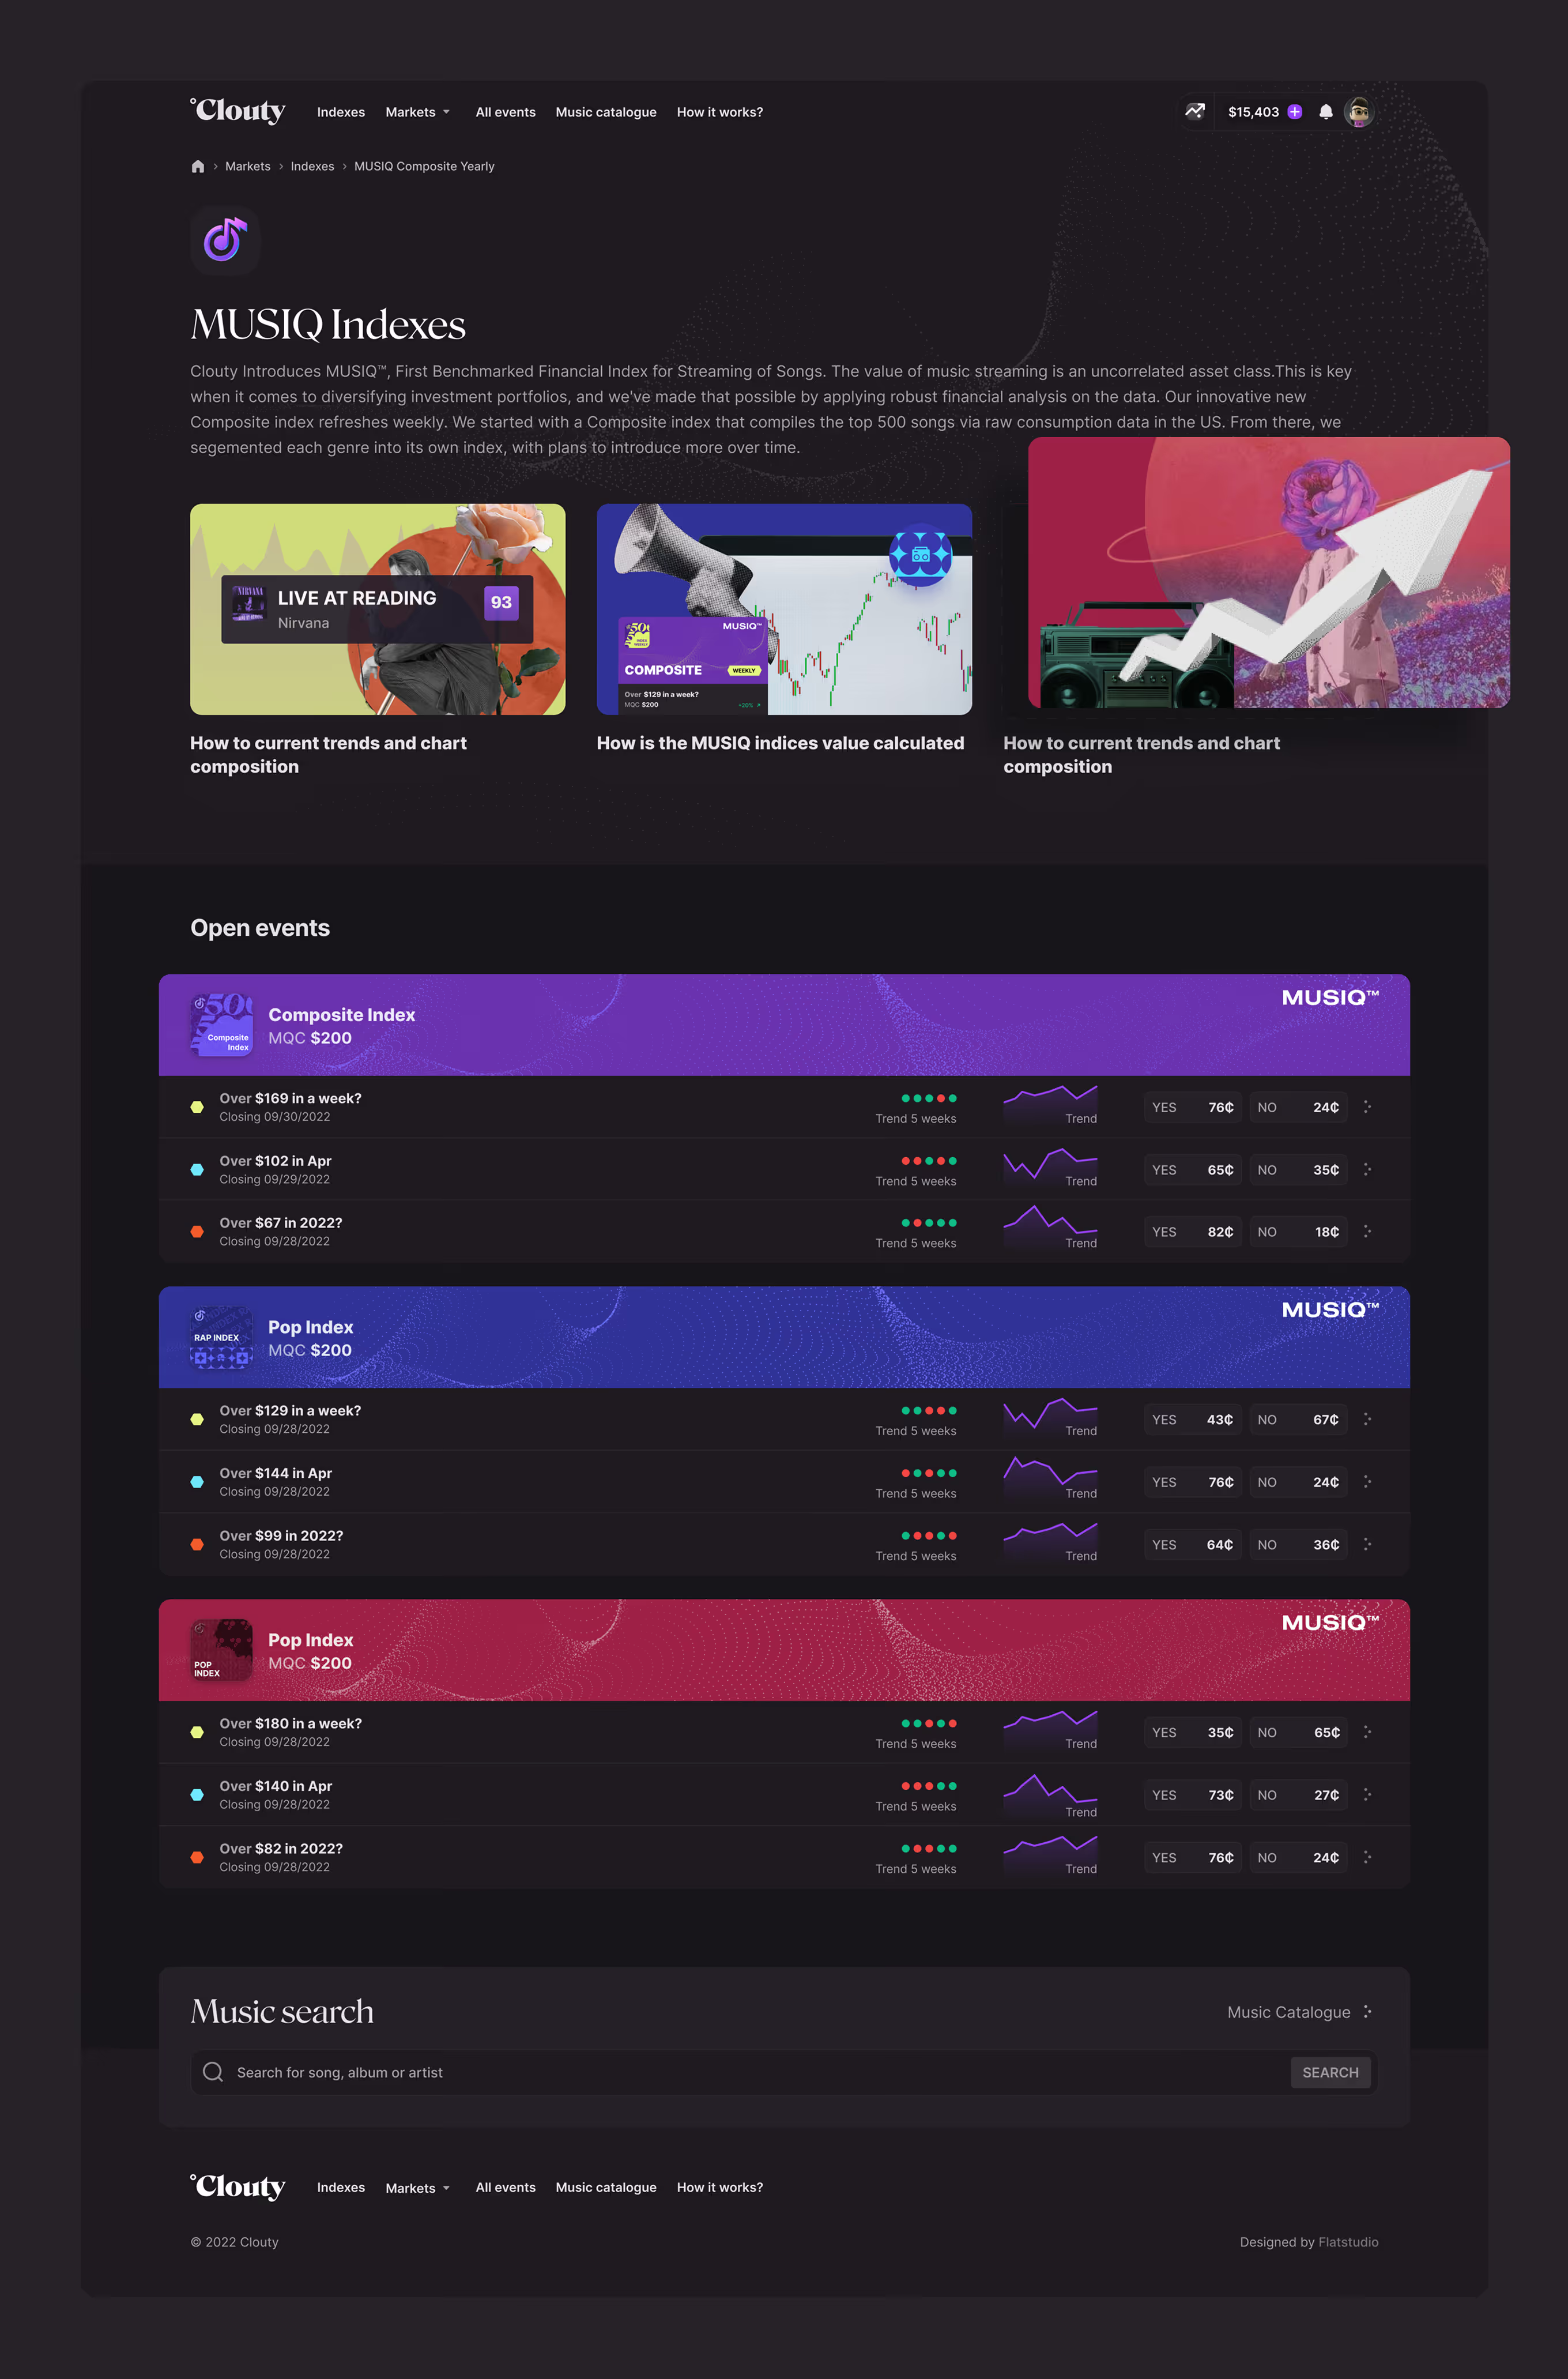
Desktop Indexes page showing MUSIQ intro, explainer illustrations, and weekly, monthly, yearly market tiers
Mobile Indexes page showing MUSIQ intro, explainer illustration, and open weekly market events
Structure of a Market Detail Page

Each market's detail page follows the same structure: composition data up top, then a price chart comparing current and past performance. Social Insights and news sit alongside, echoing familiar Fintech charting patterns.
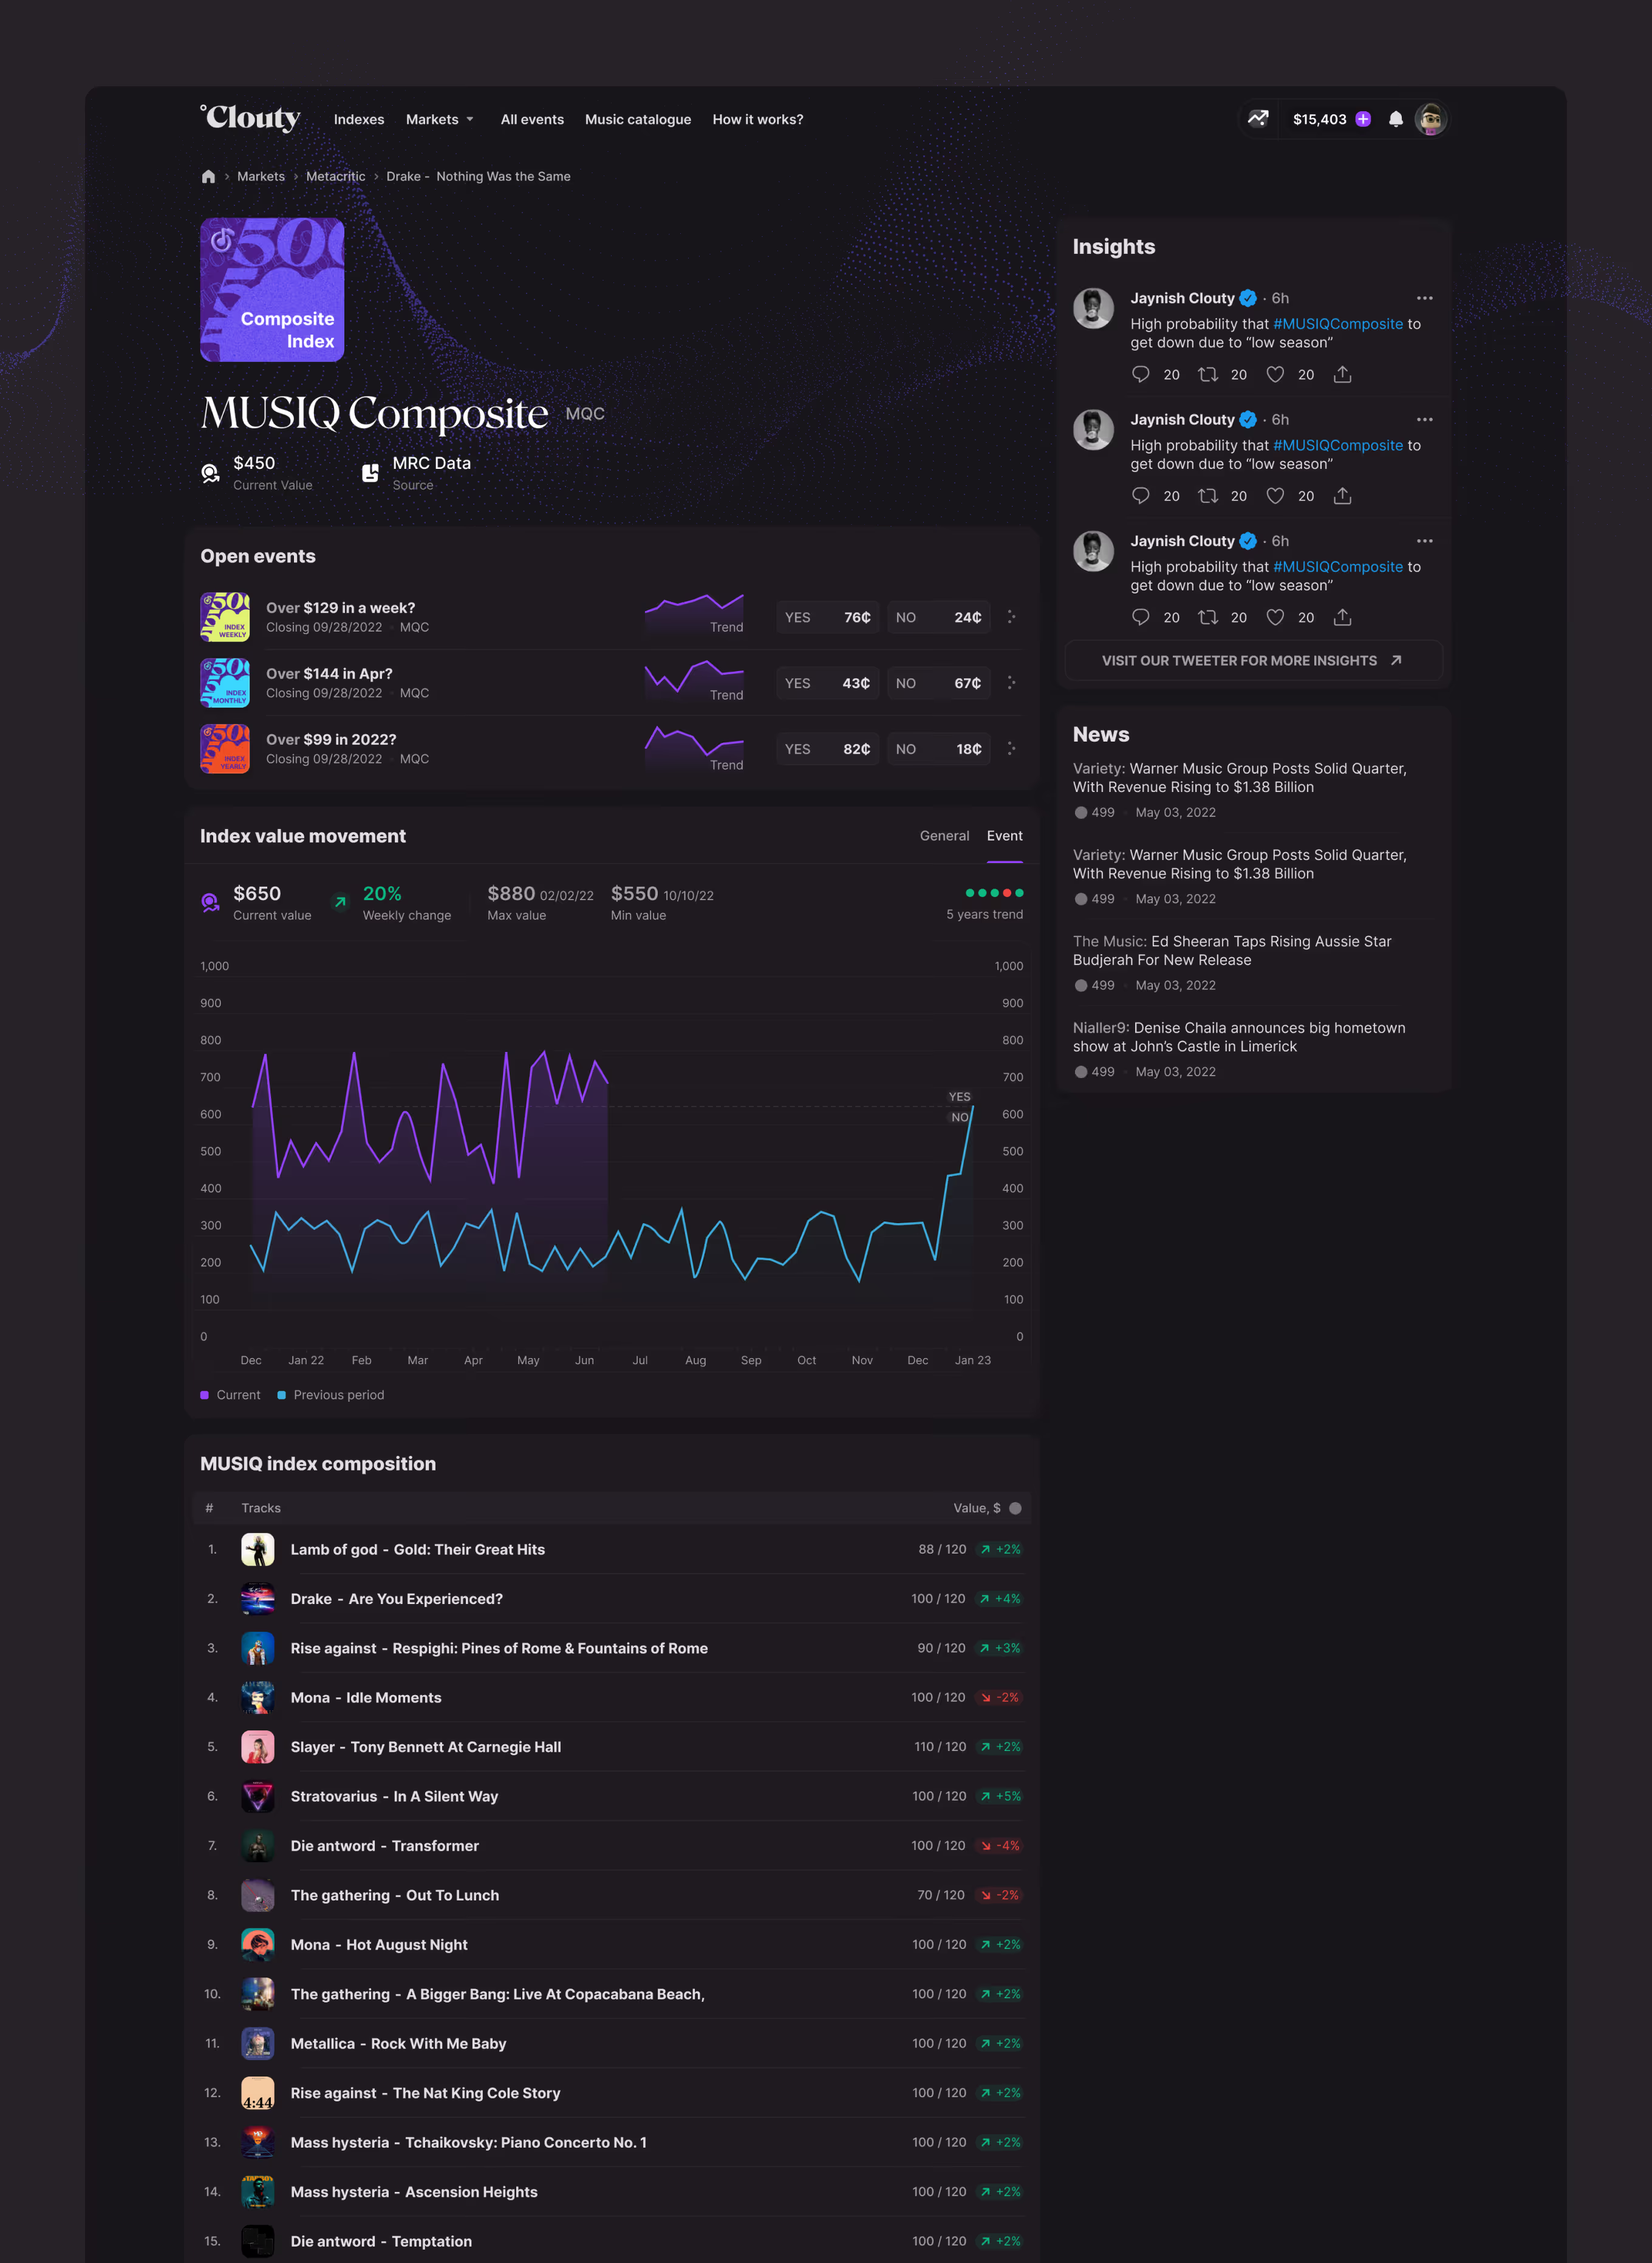
Market detail page structure showing composition, price chart, and social insights panel
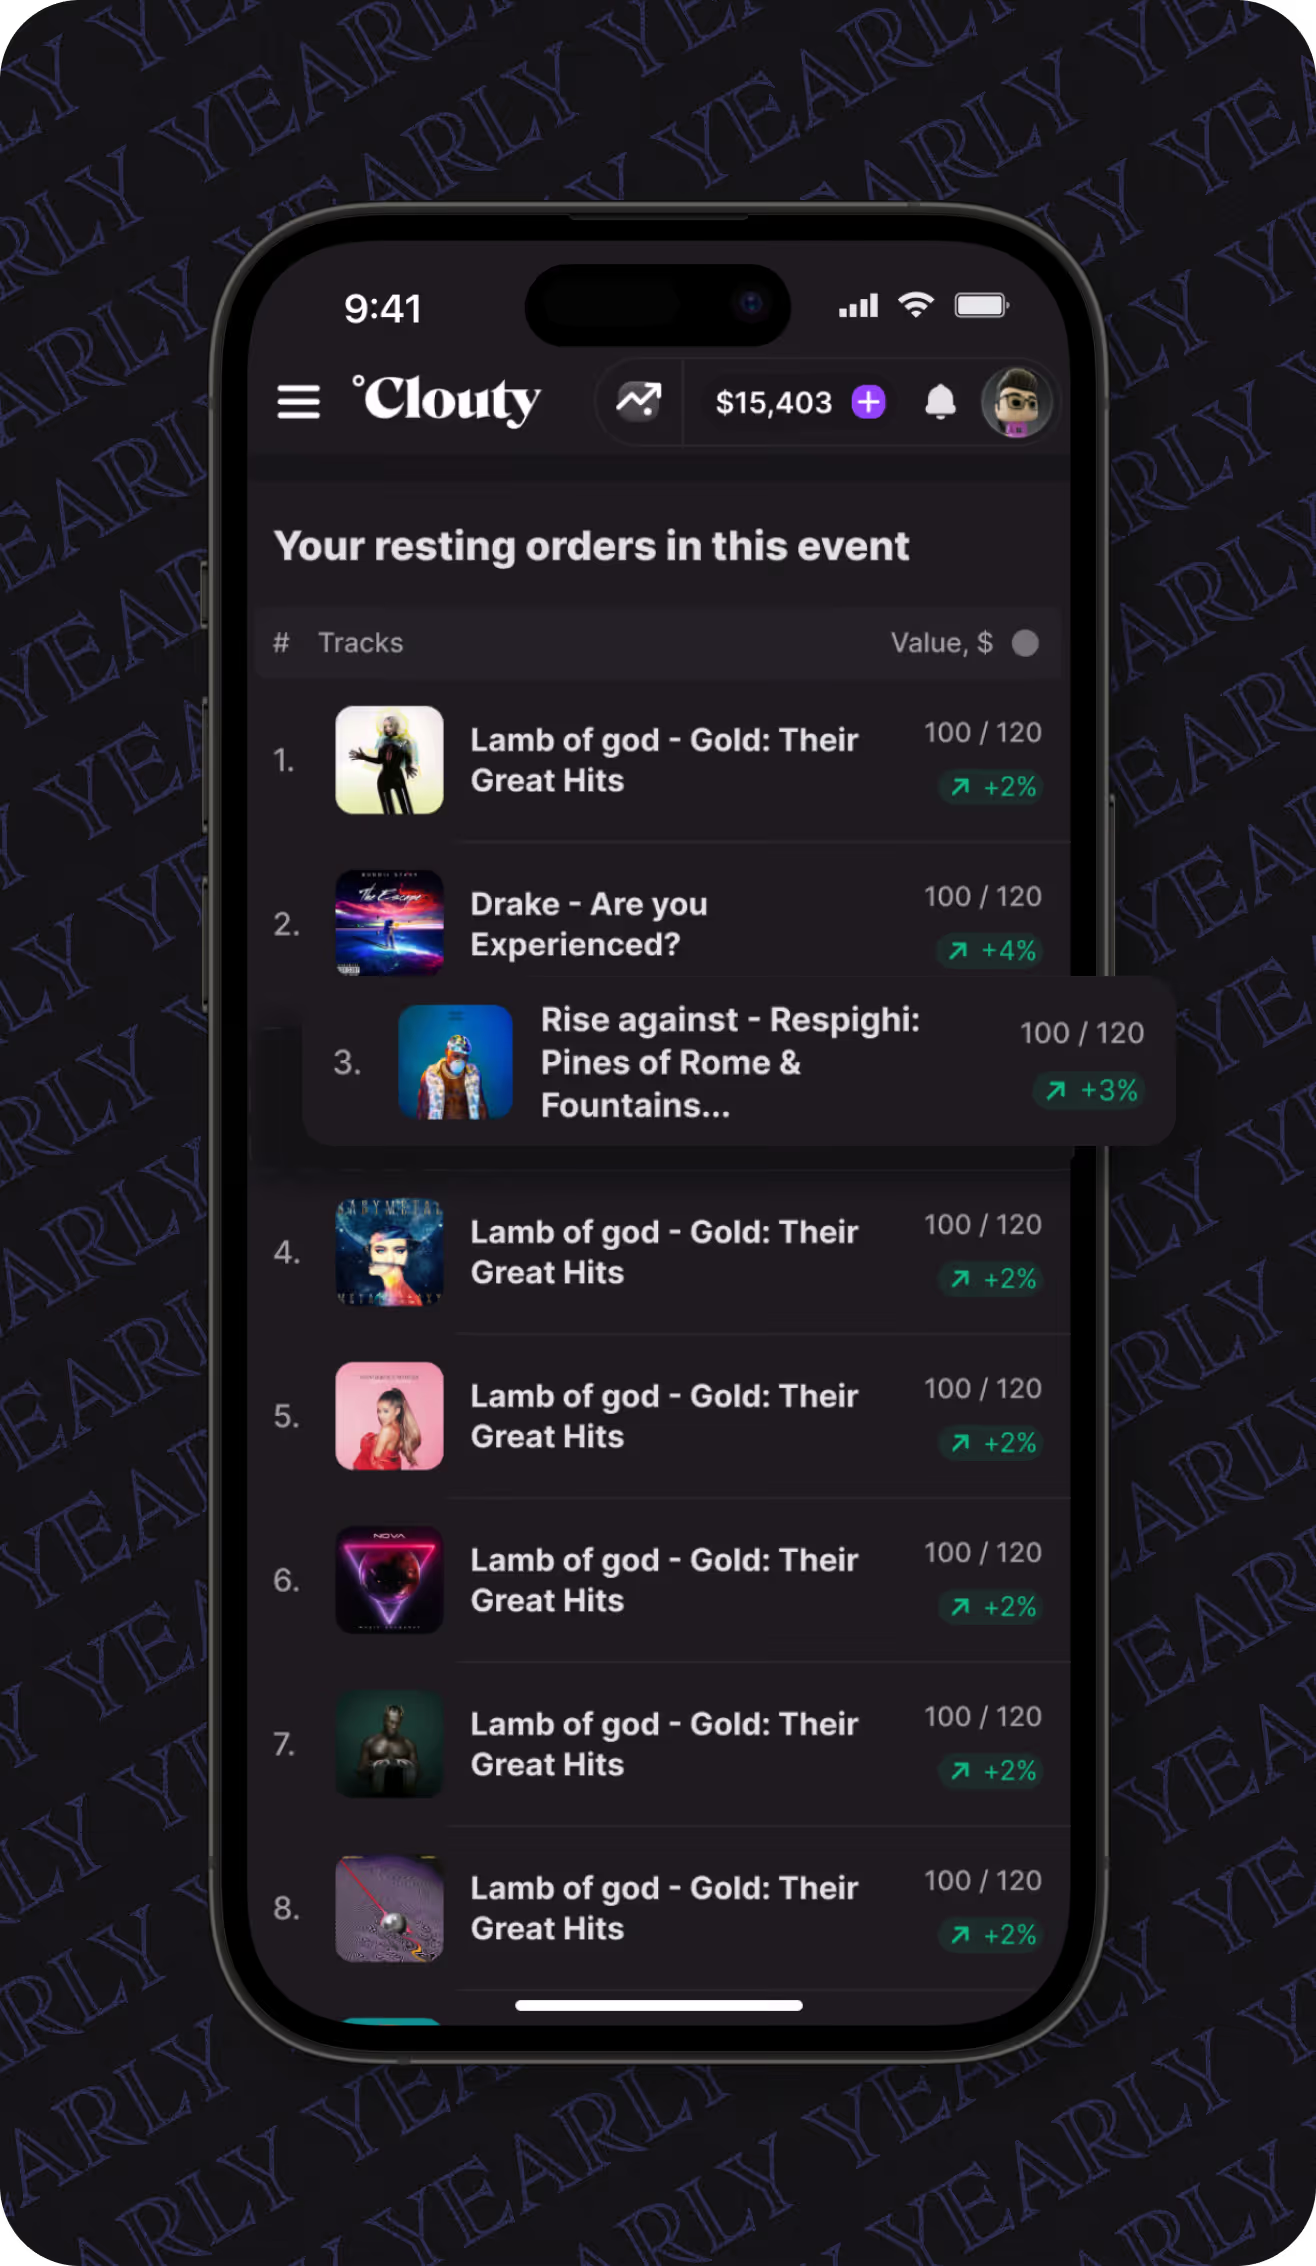
Mobile resting orders list showing tracks weighted inside a music index event
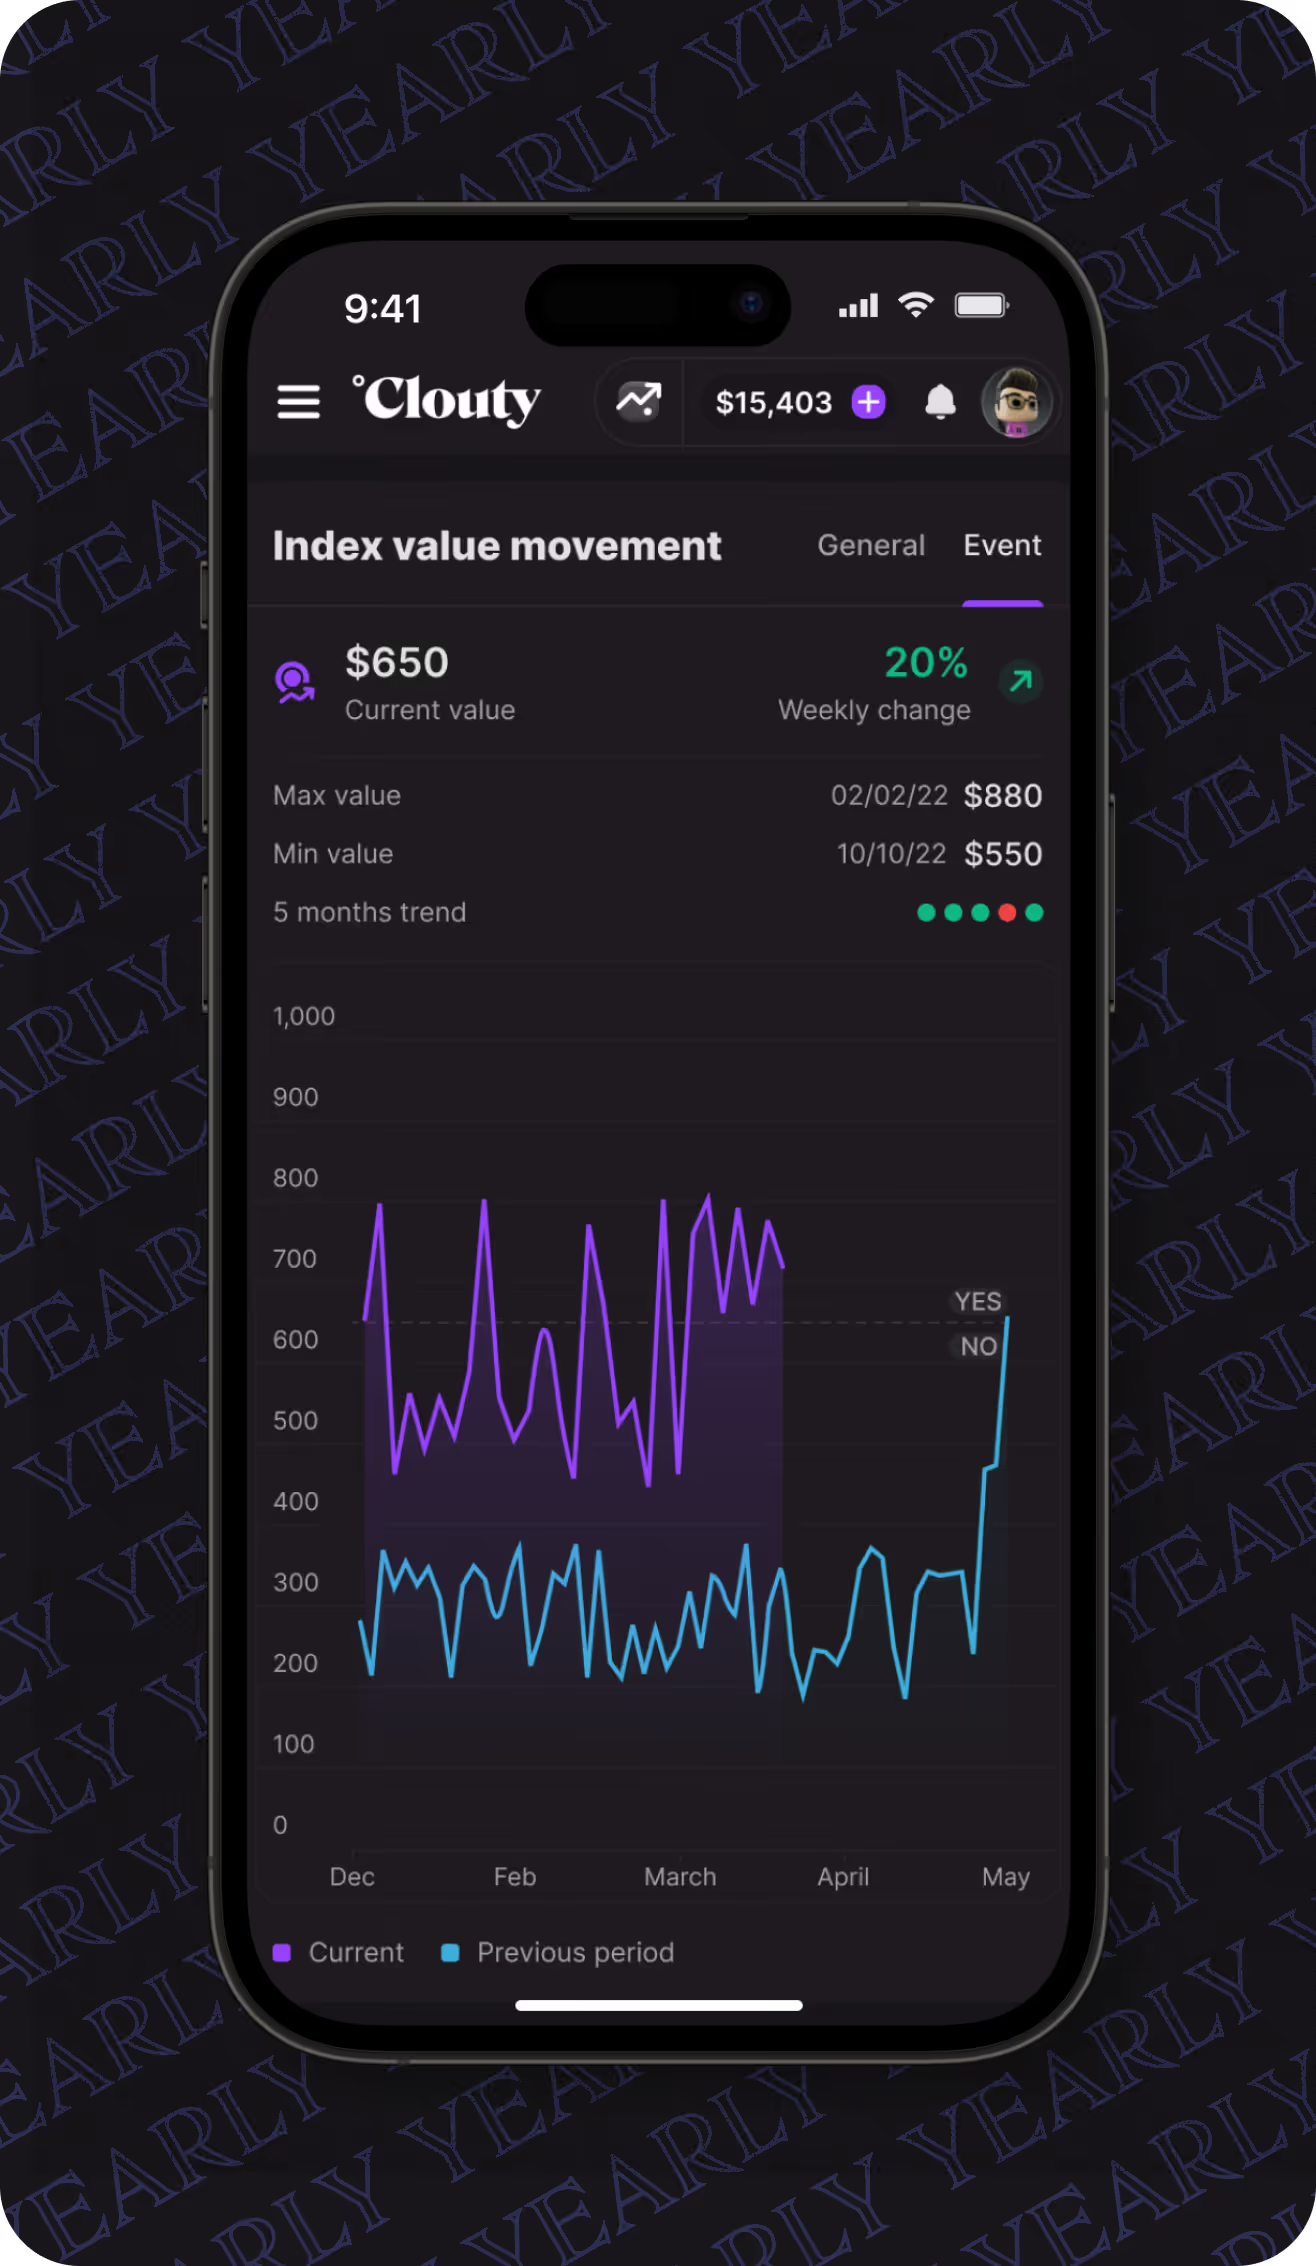
Mobile index value chart comparing current and previous period with weekly change

Market Browser for All Event Types

This page lists every open event across market categories, including streaming, Billboard, certification, and score data. Users filter by category, sort by volume or closing time, and page through results without leaving the view.
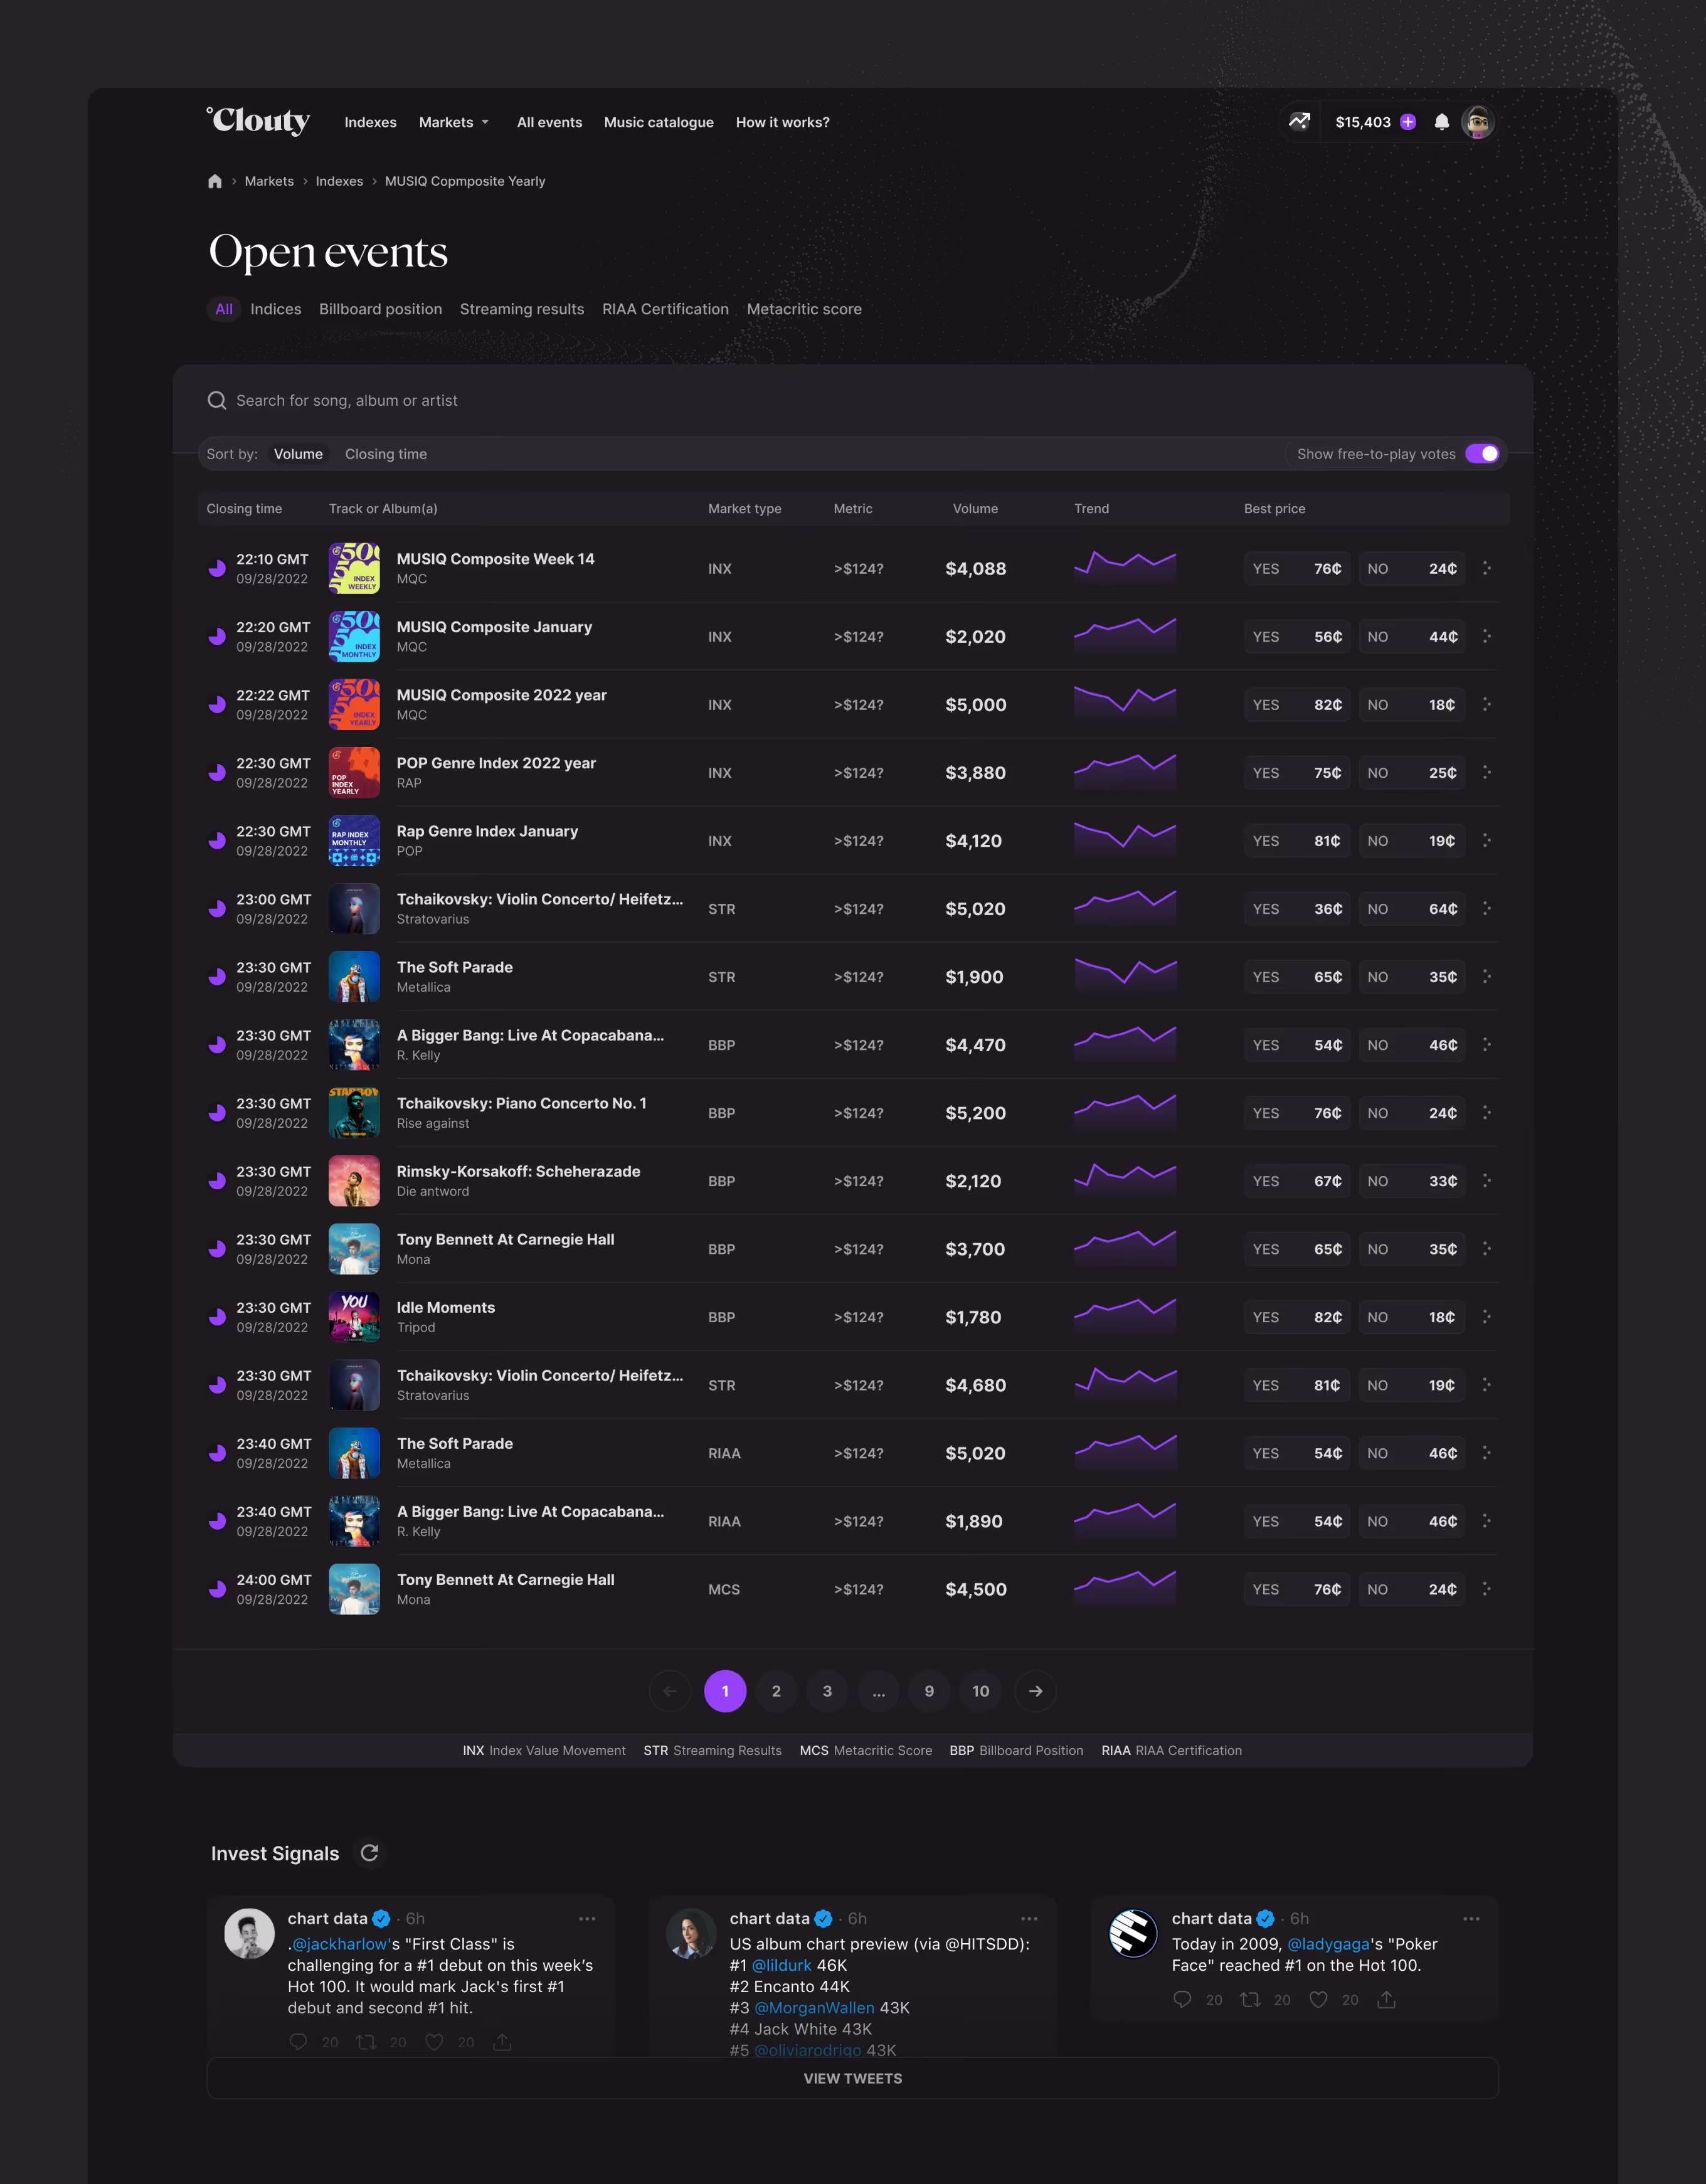
Desktop open events table filtering index, streaming, Billboard, certification, and score-based markets by volume
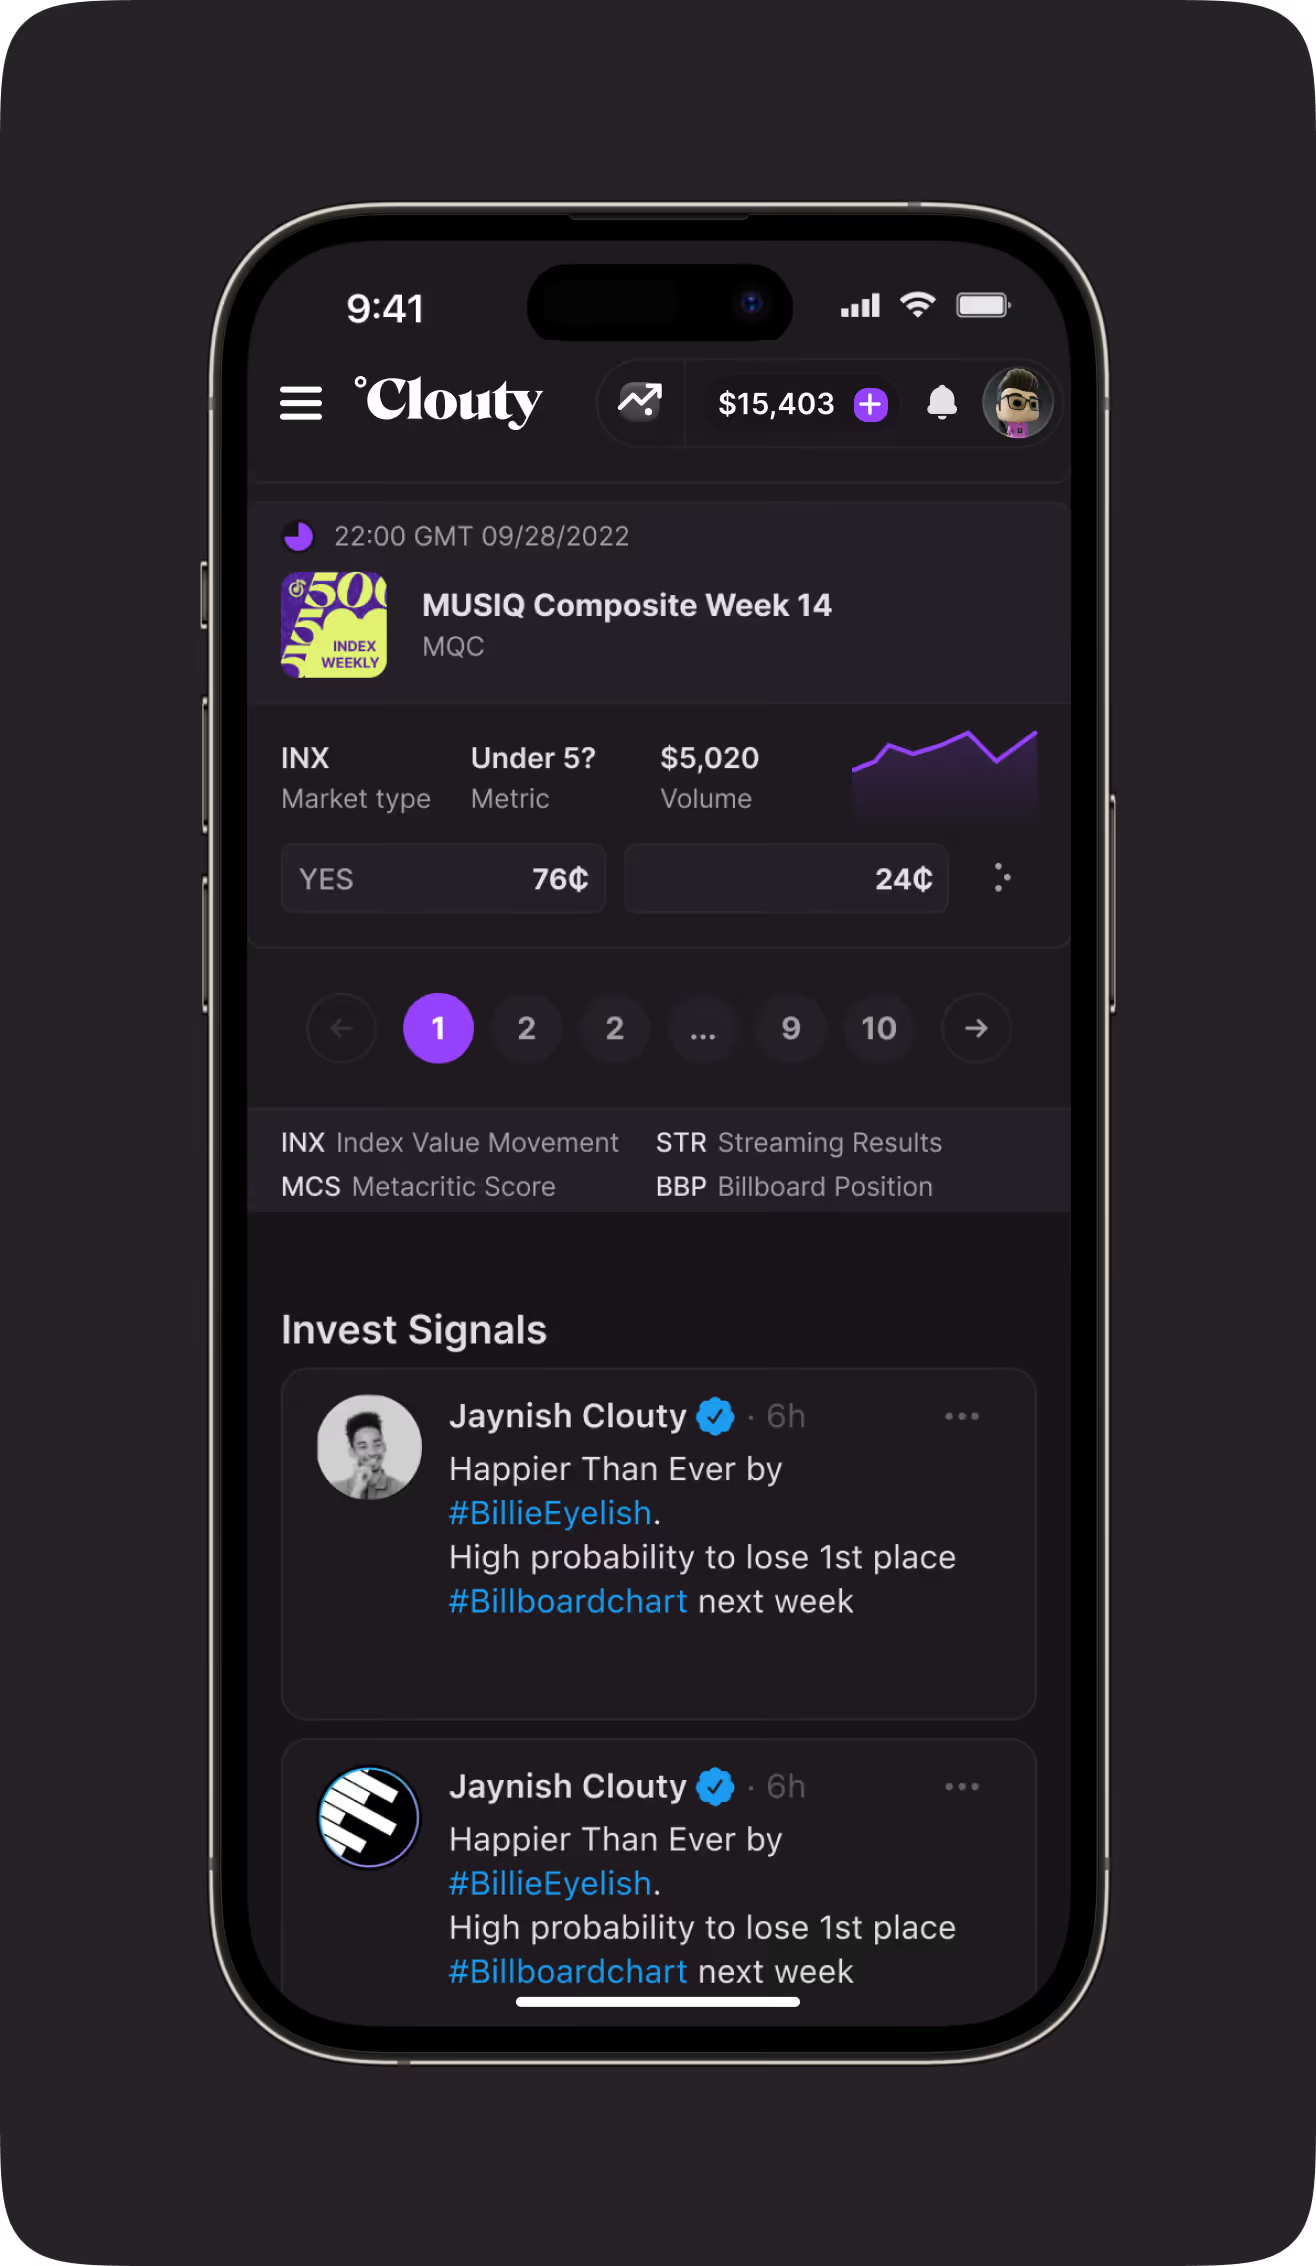
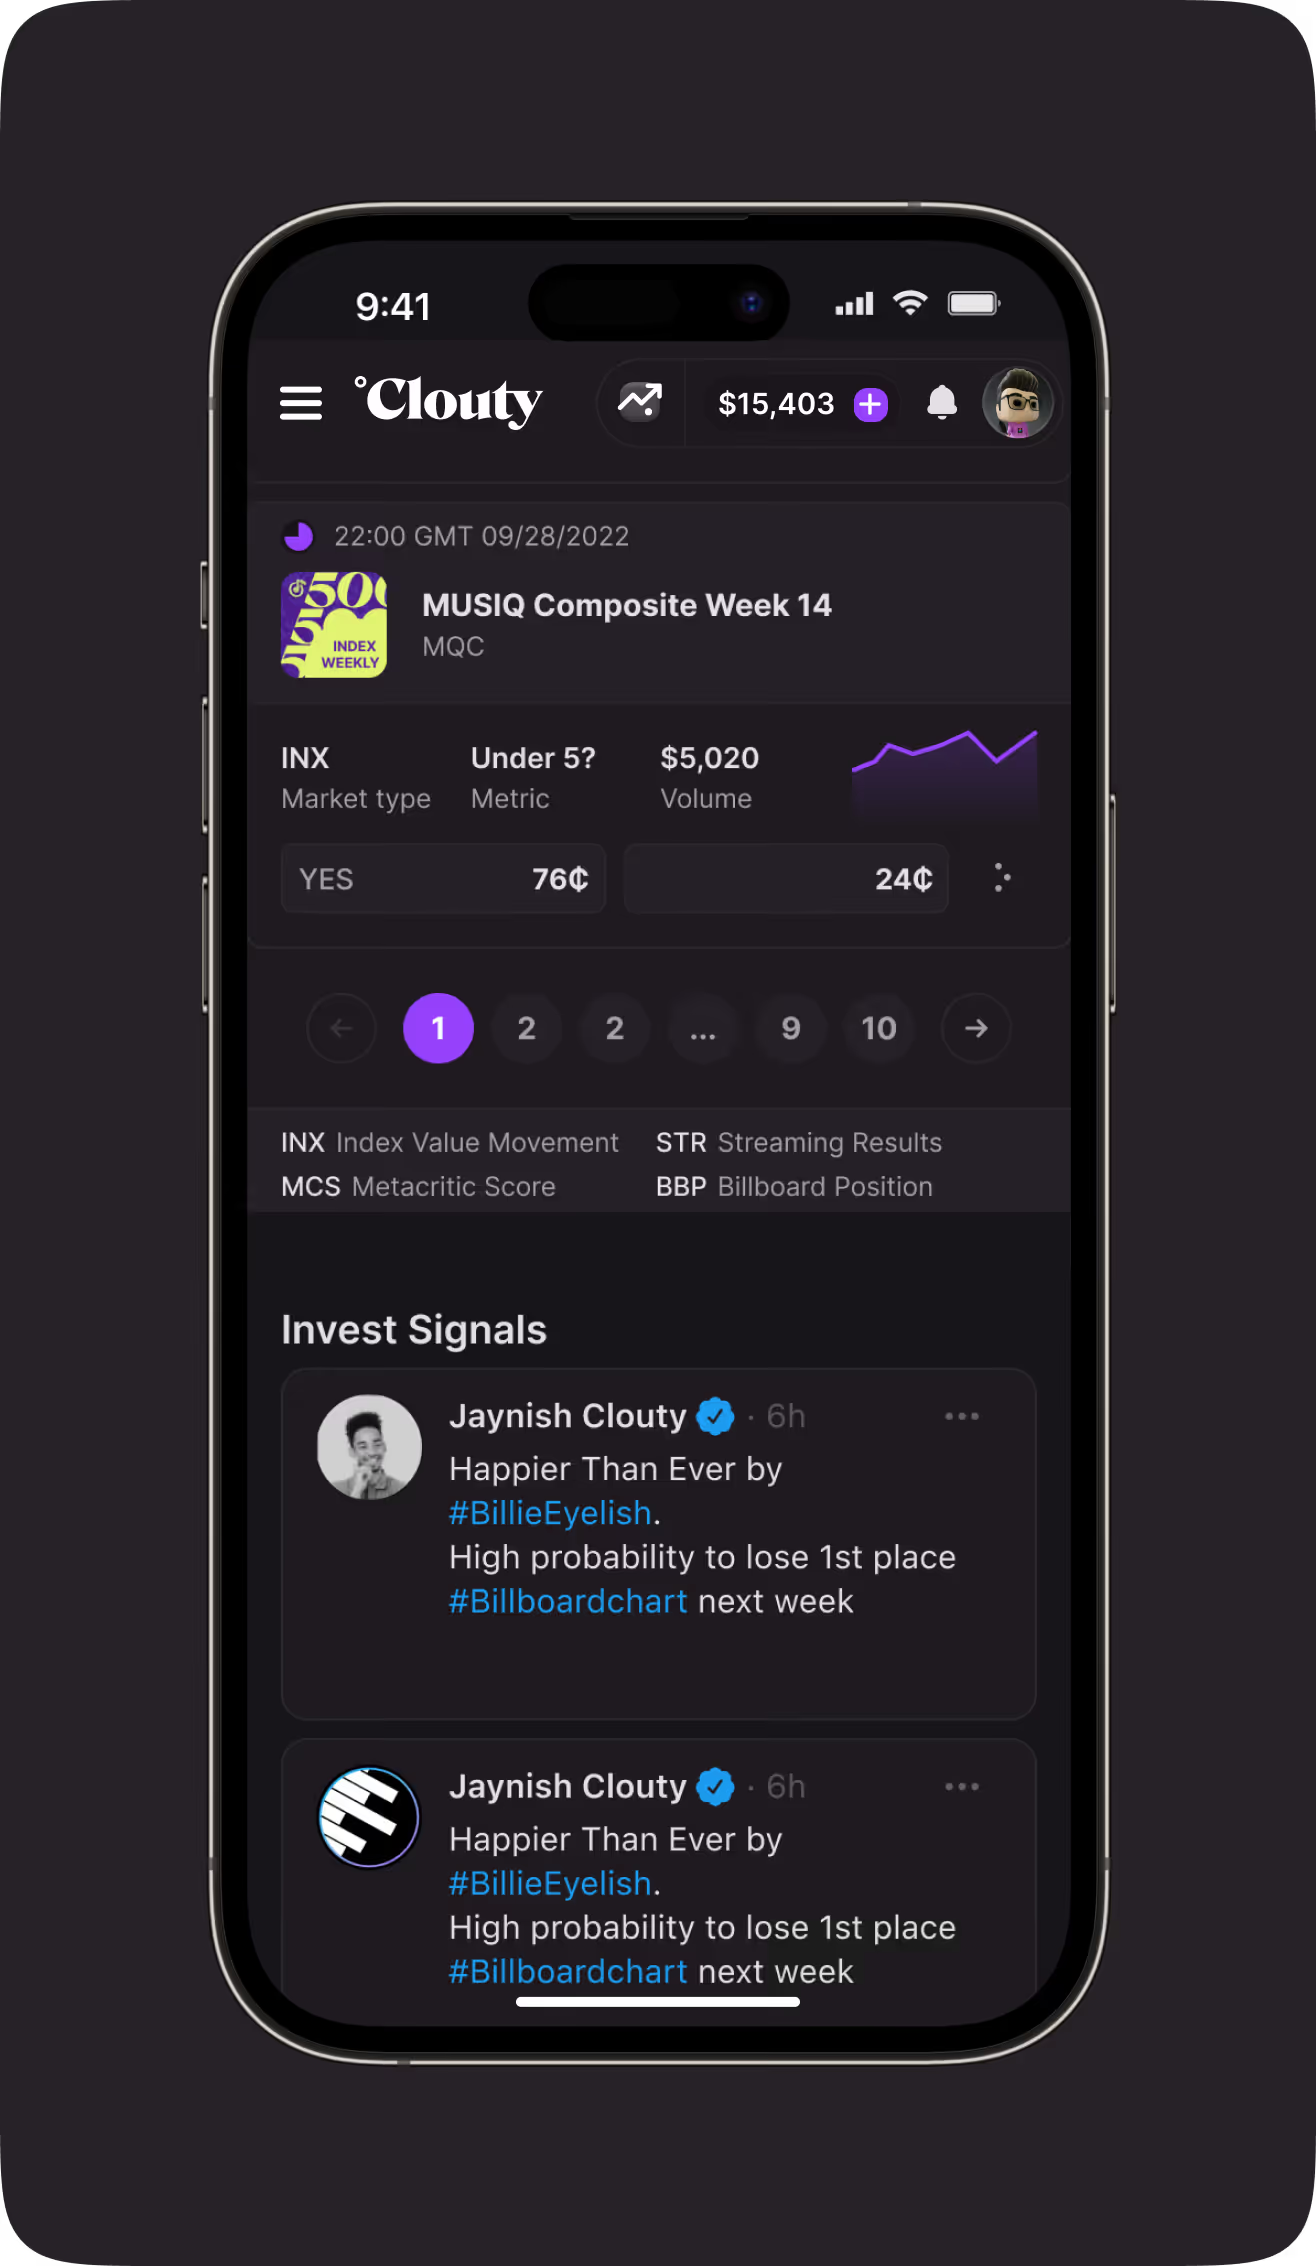
Mobile market event row with pagination and an Invest Signals feed below
Search and Filter for Song Events

A live search narrows market events as users type, with sorting options for volume and closing time. A free-to-play votes toggle and this filtering layer were built out as part of the project's Post-MVP Evolution phase.
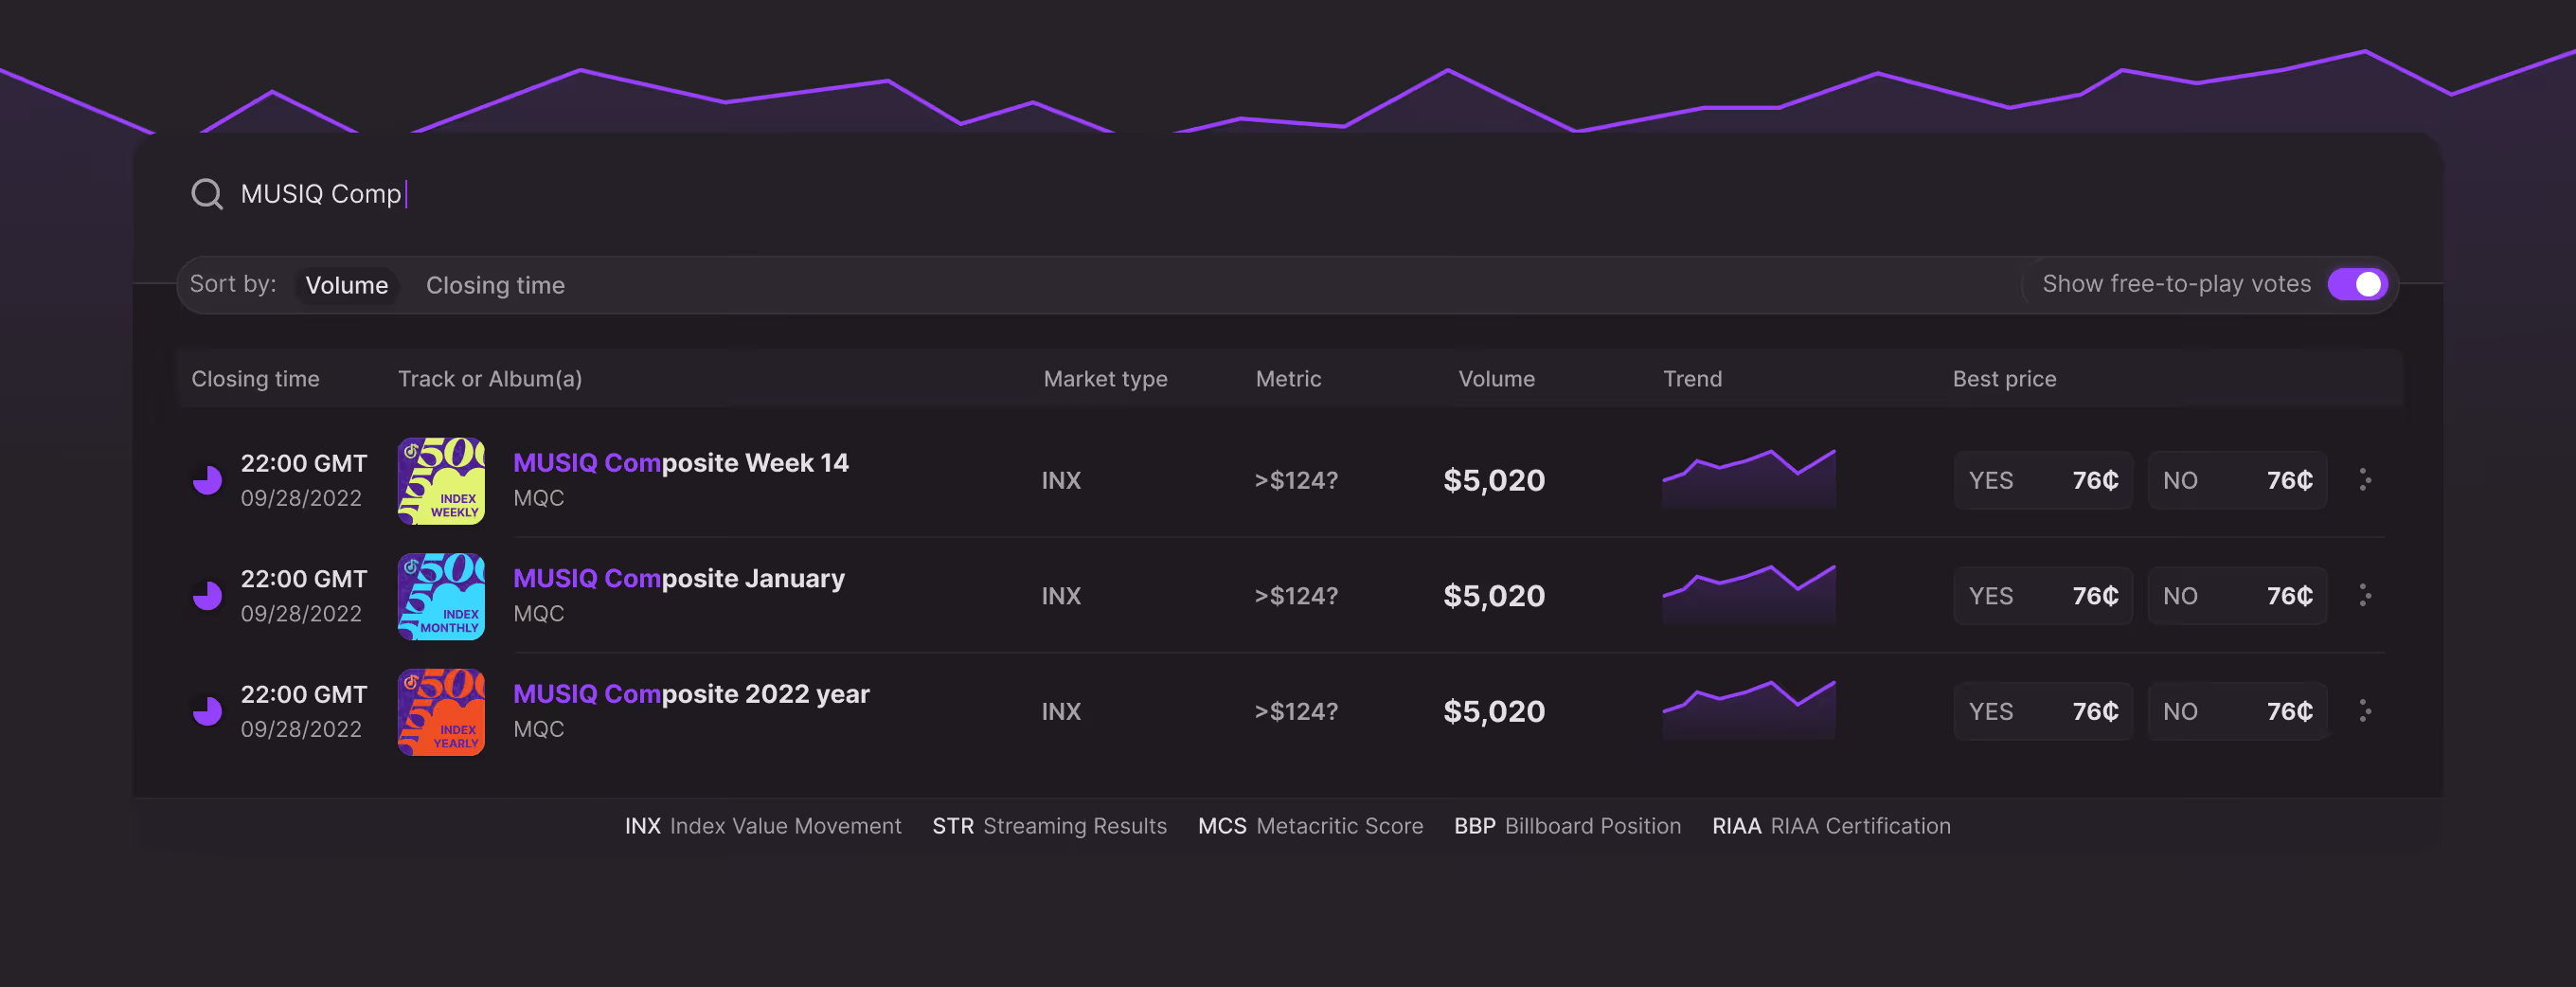
Live search and sort filters narrowing song and market events on a prediction platform

Trading Panel for Individual Song Events

Every market question, from streaming counts to certification status, opens its own trading panel with live Yes/No pricing. A resting-orders list and open-interest chart track a user's position across Clouty's prediction market for music assets.
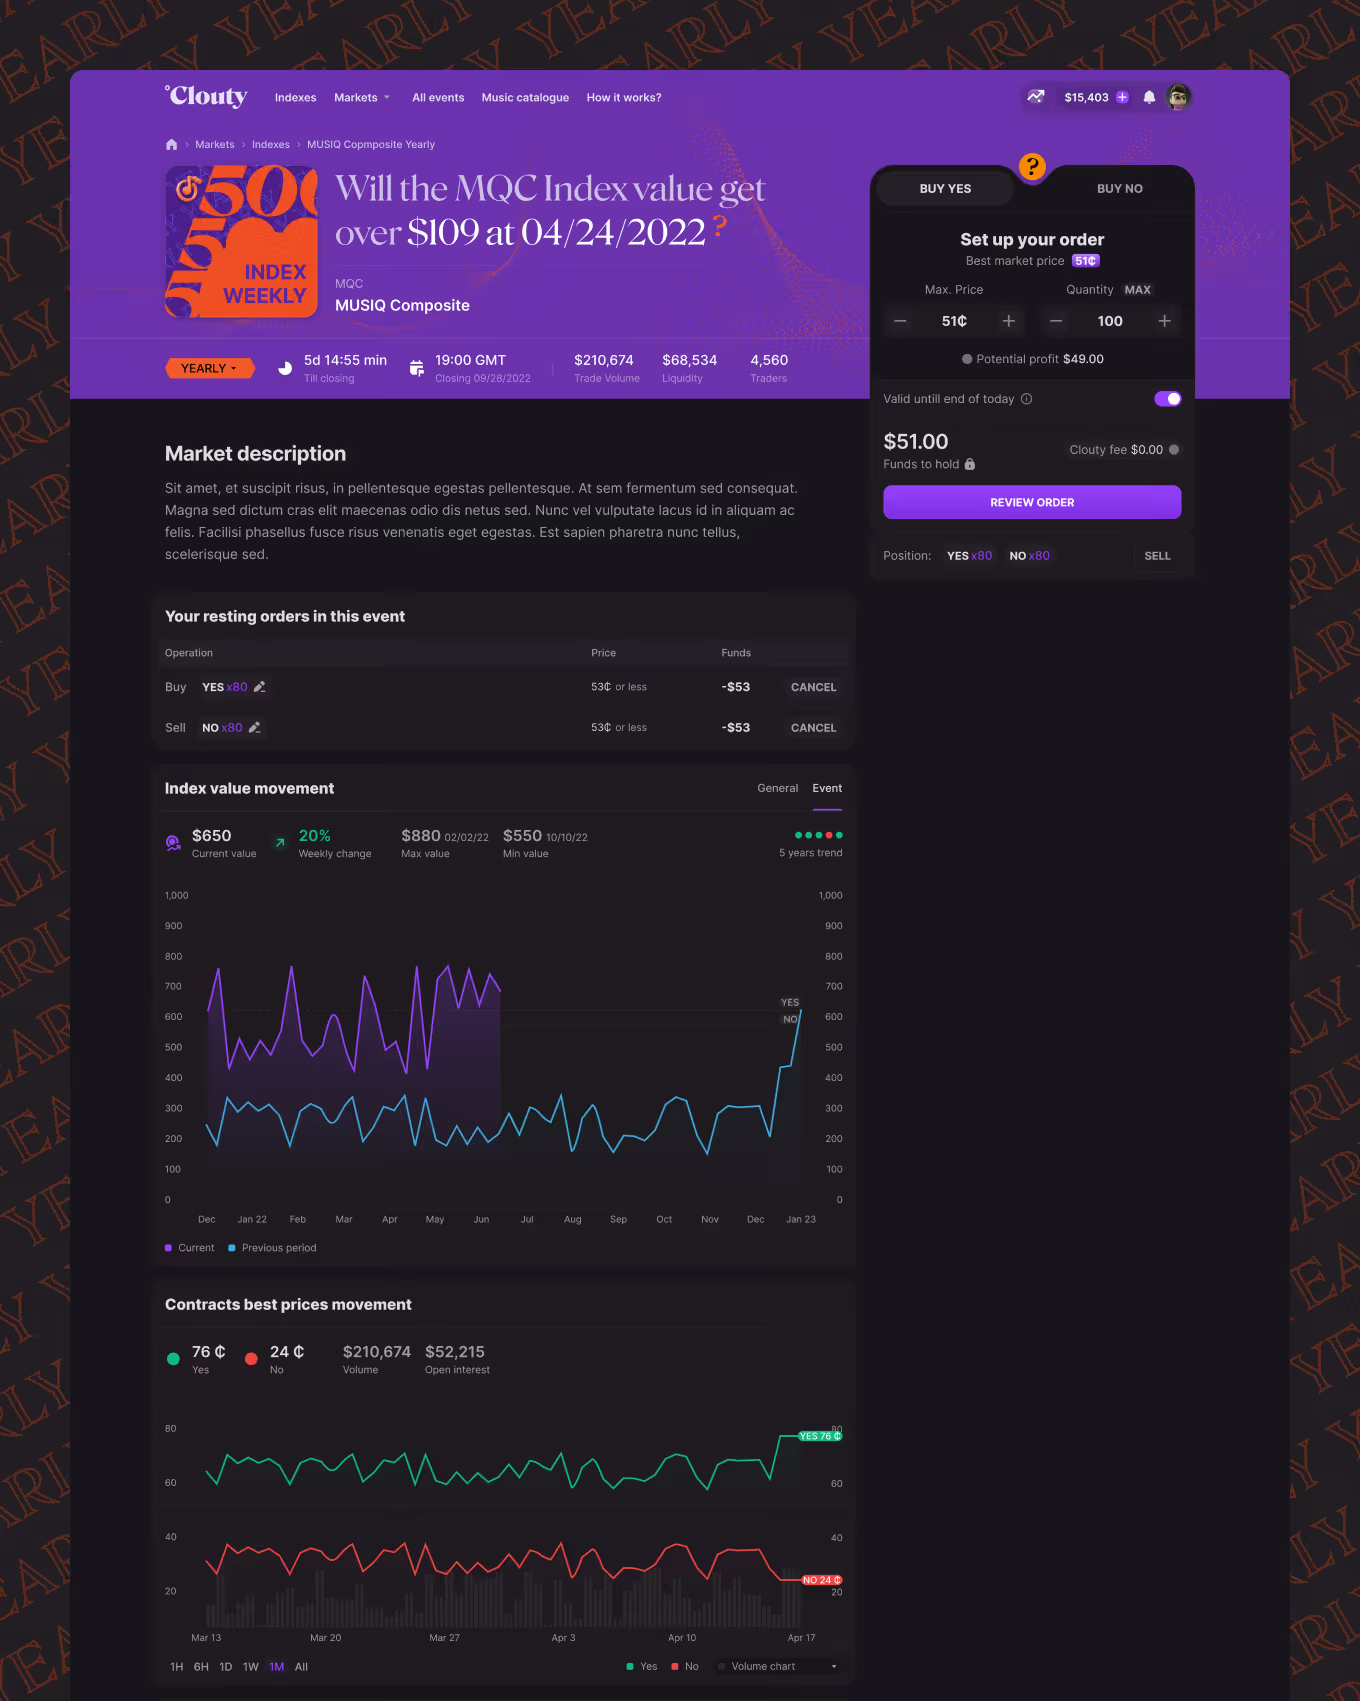
Trading panel with Yes/No pricing and open-interest chart for a song prediction market
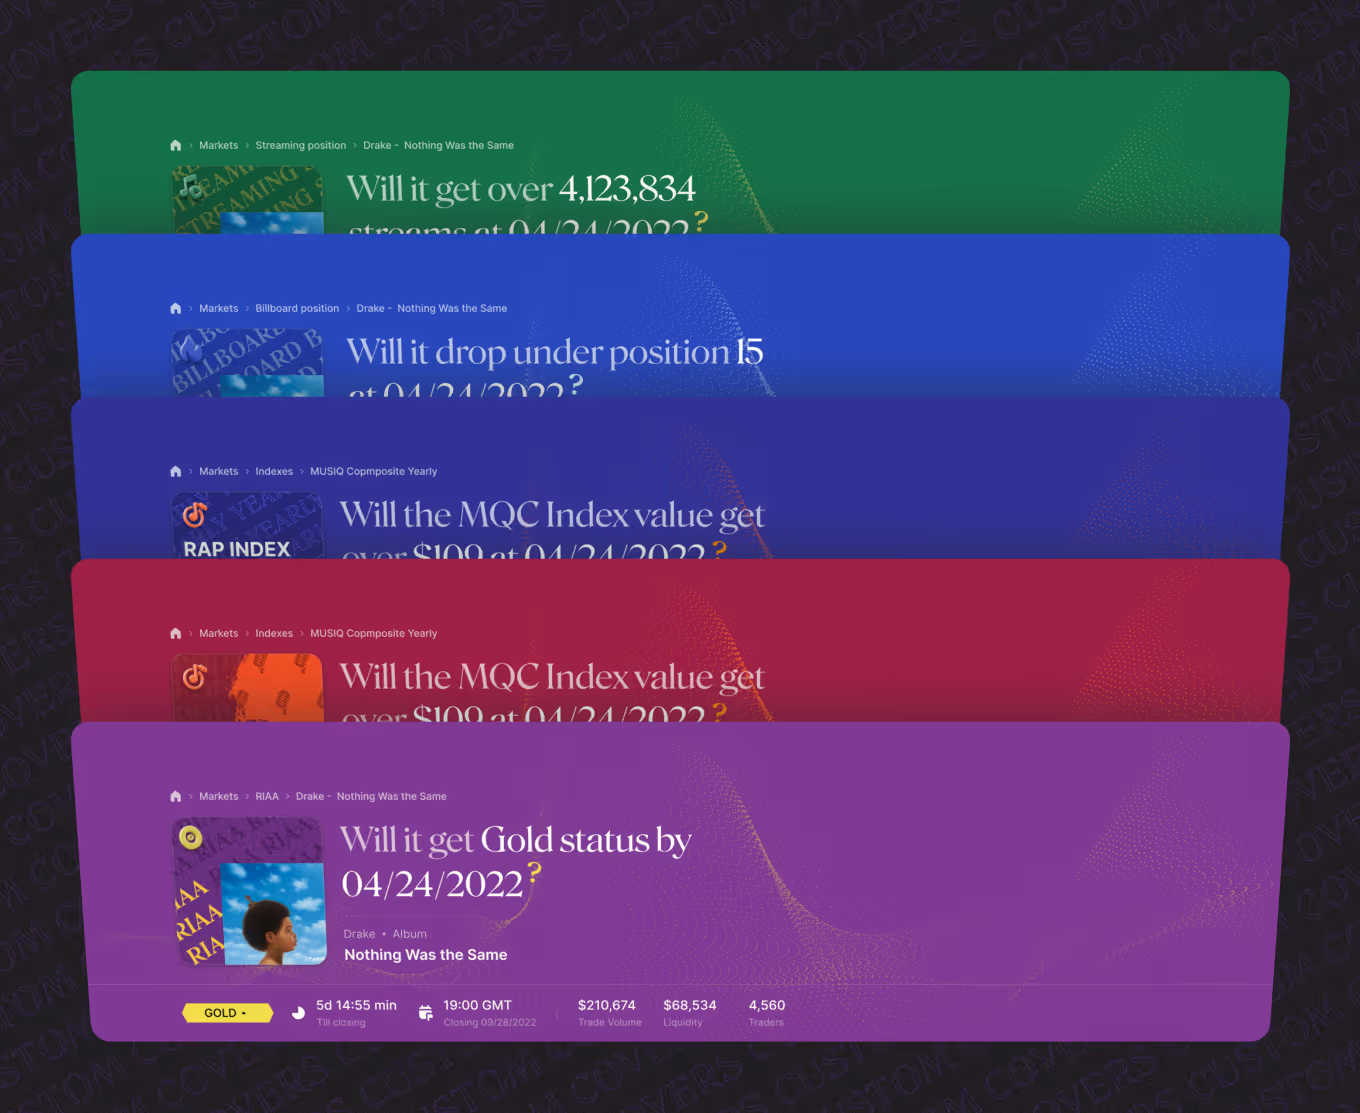
Stacked market cards in different colors for streaming, Billboard, index, and certification events
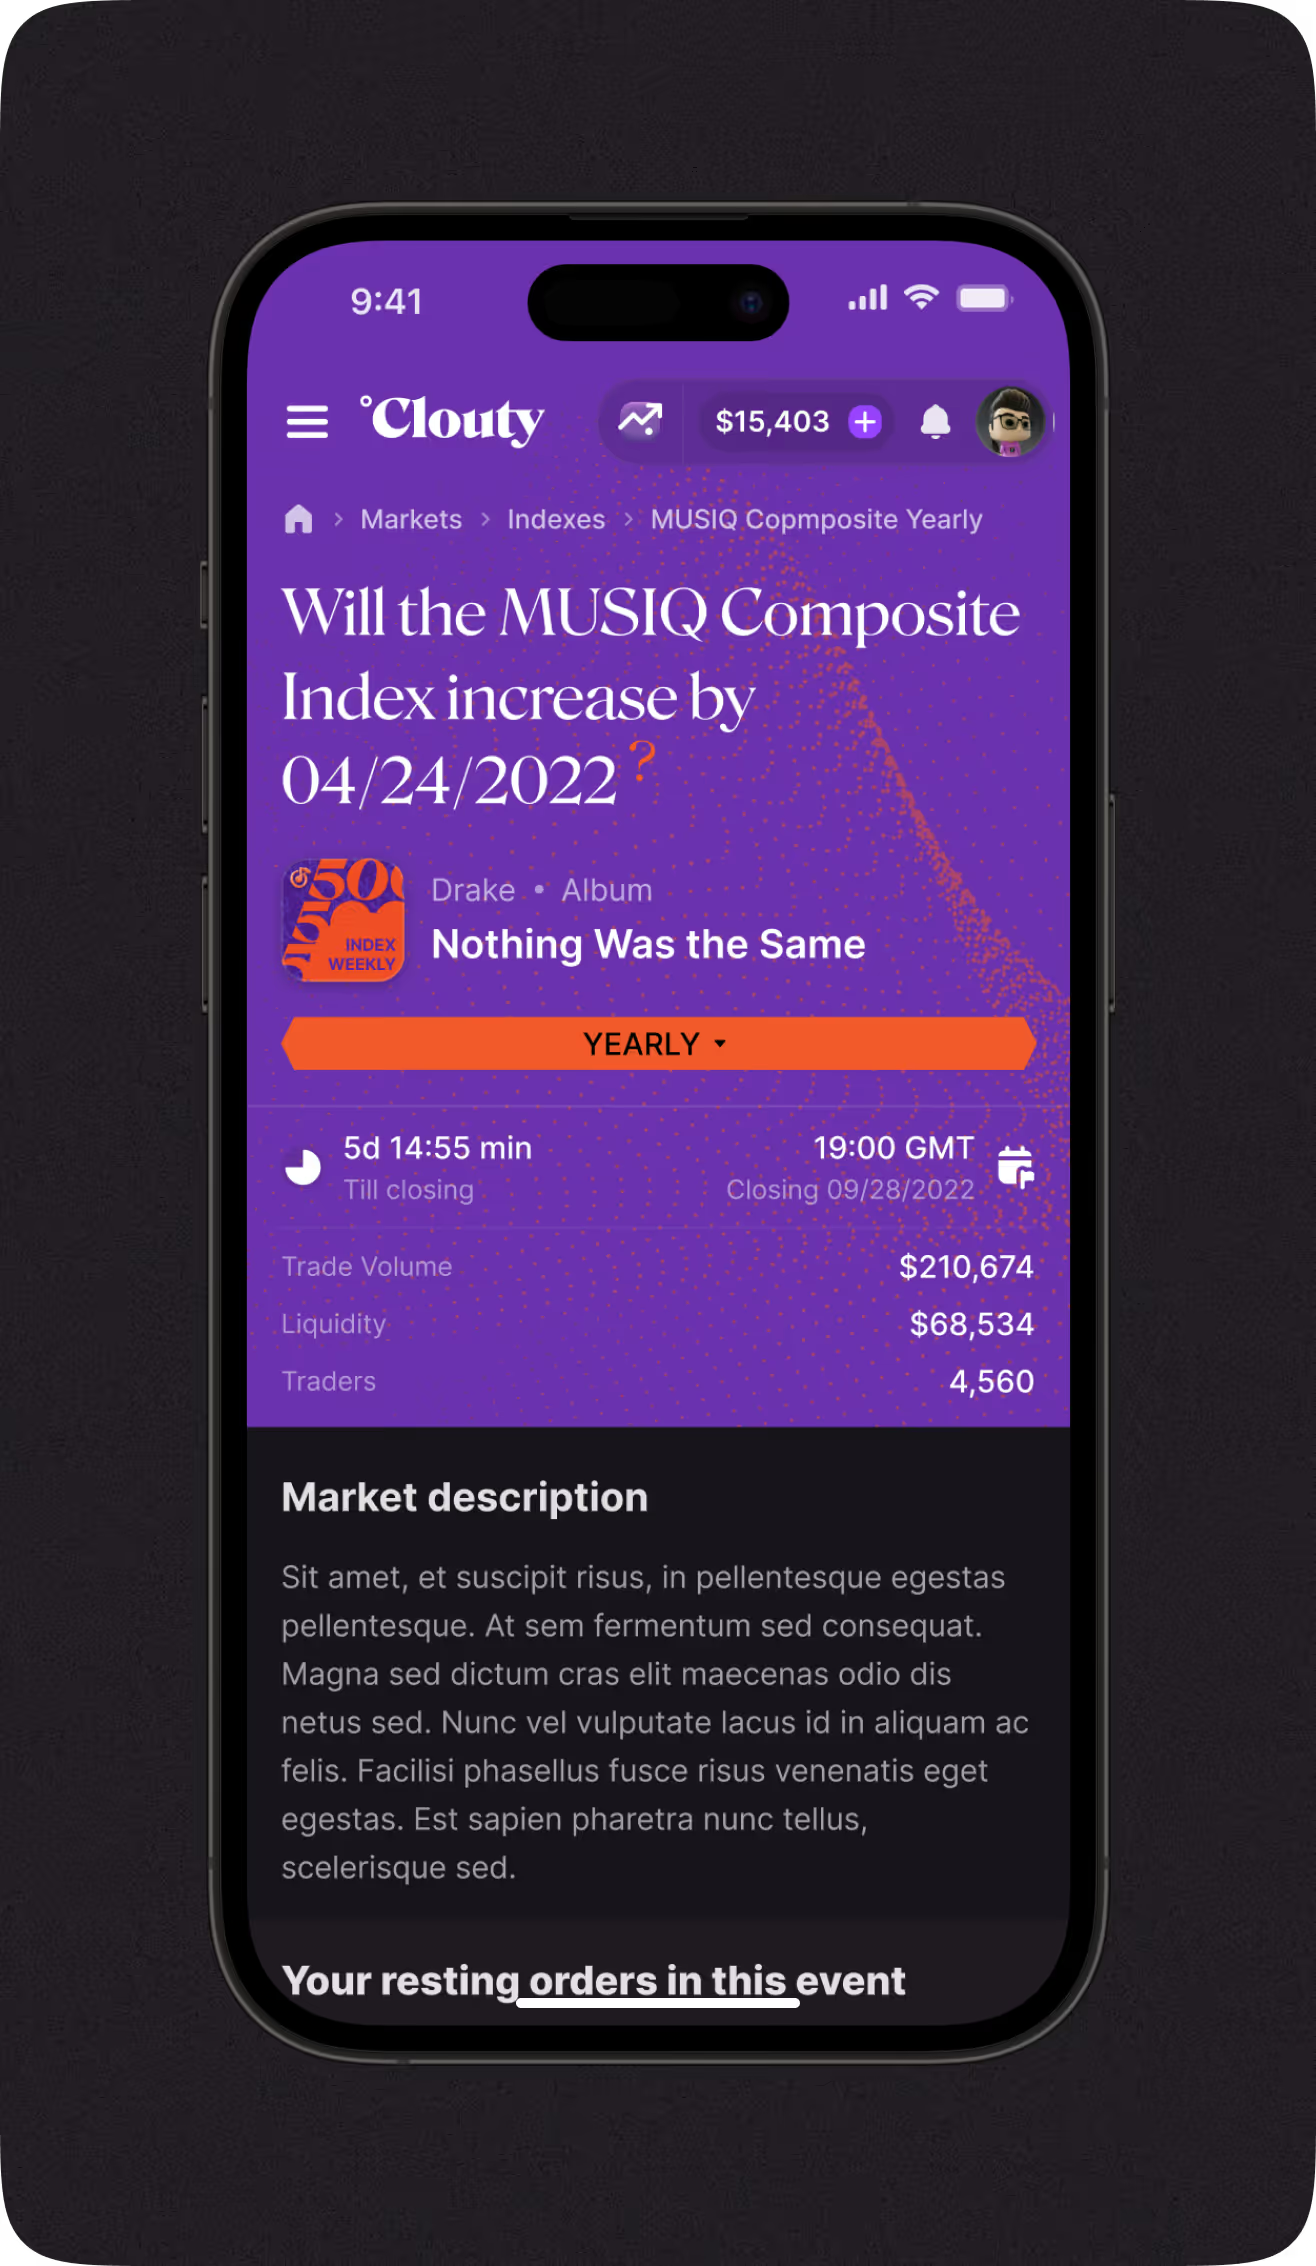
Mobile market detail page showing trade volume, liquidity, and market description
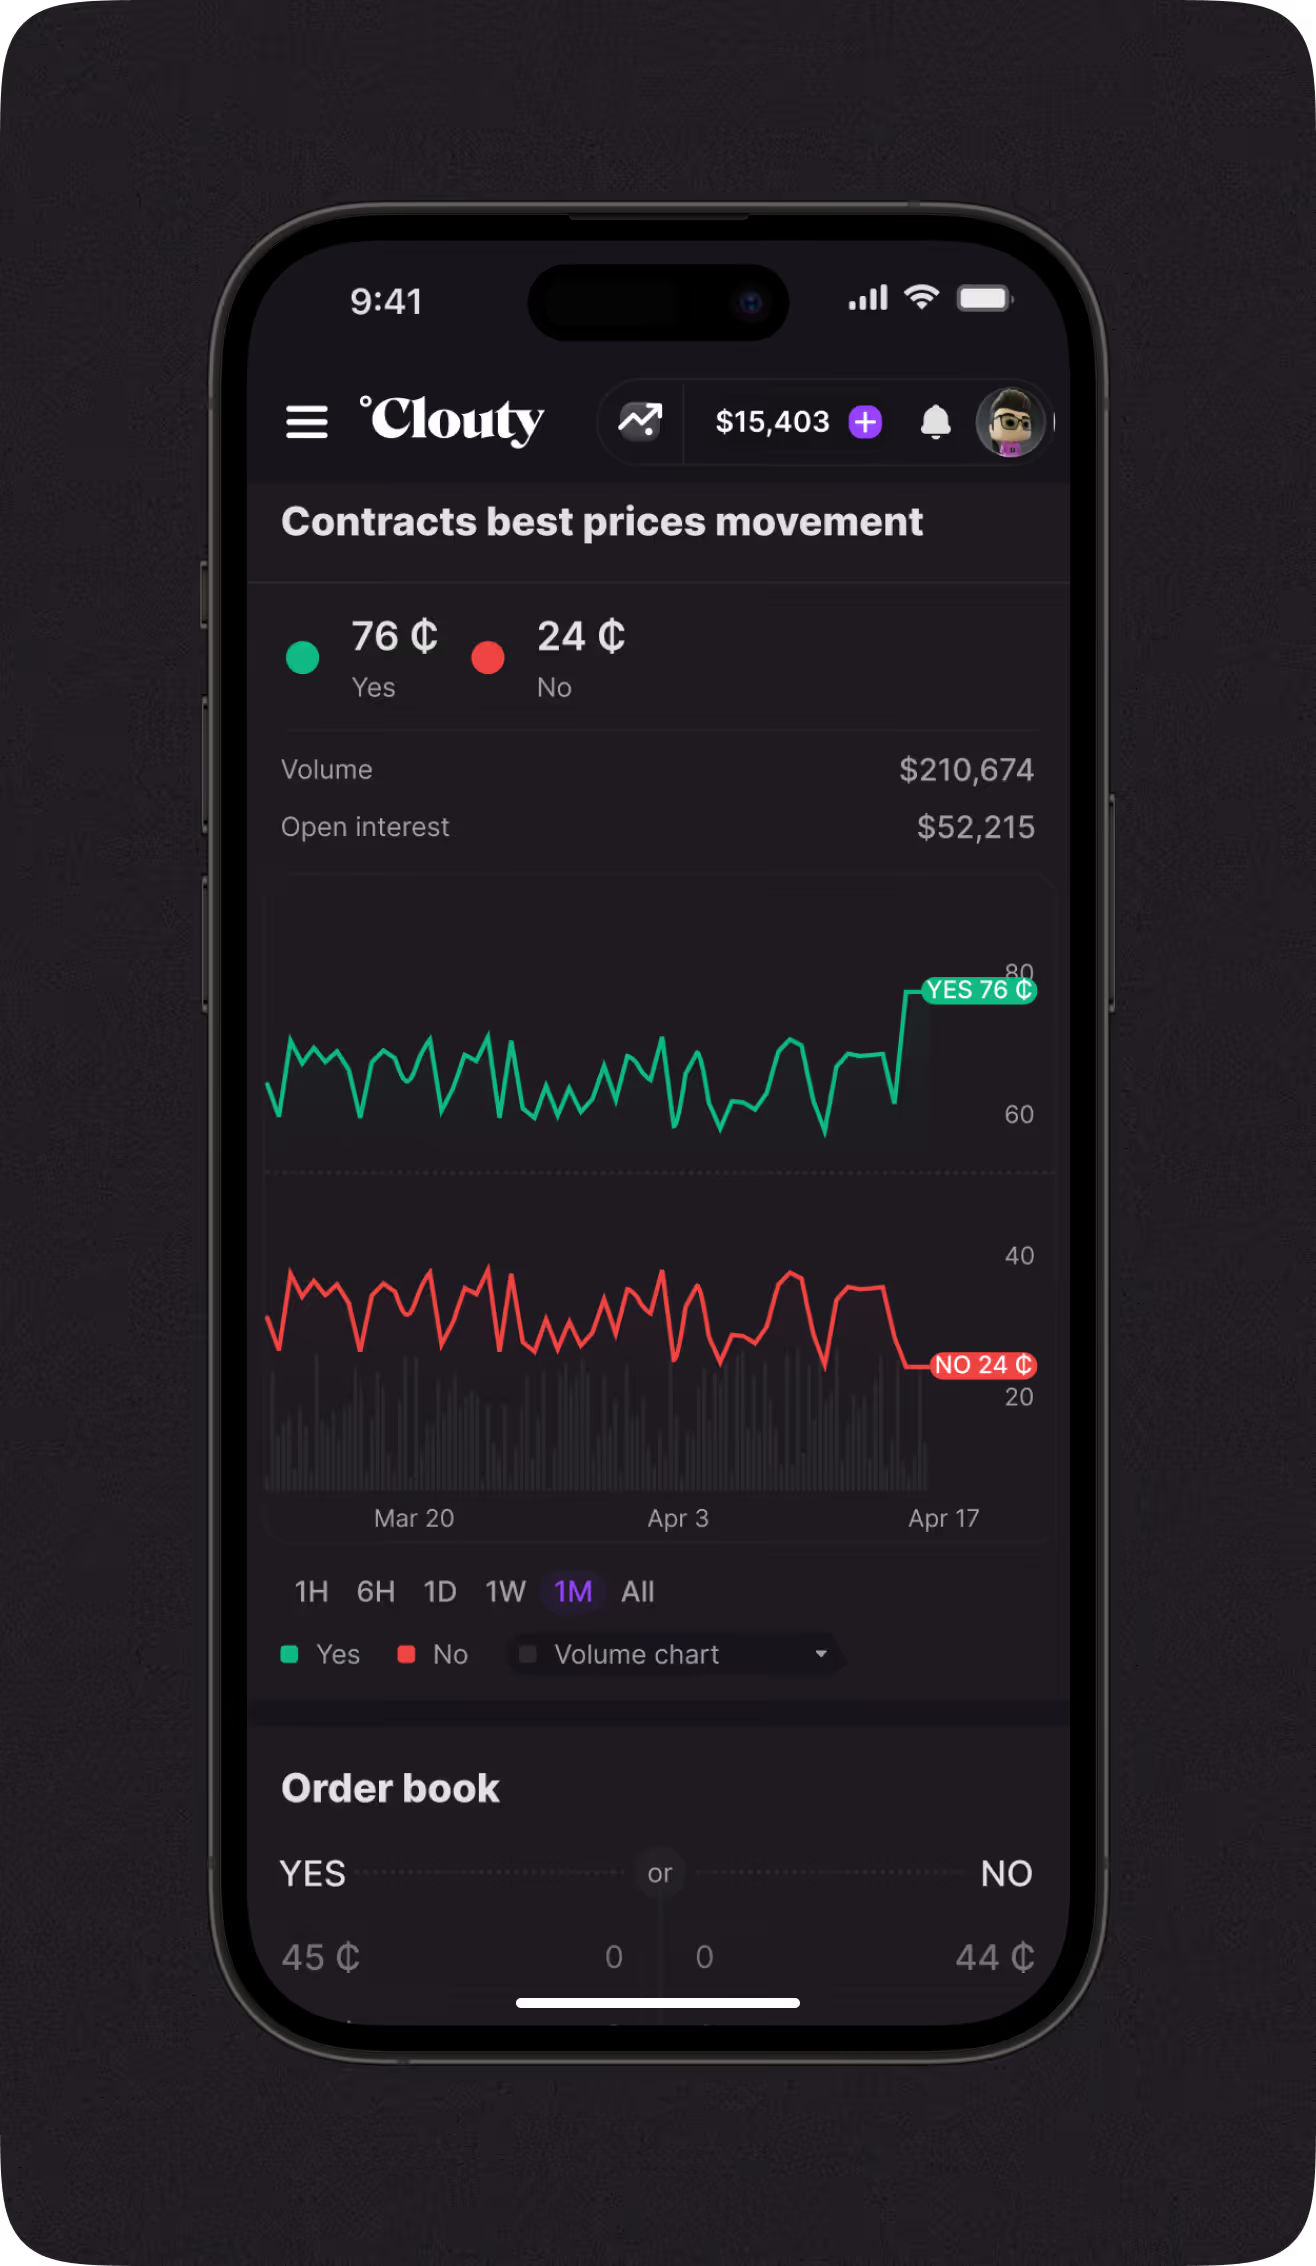
Mobile Yes/No price chart and order book for a music prediction market
Mobile Flow for Placing an Order

The mobile order flow guides a user through setting a max price and quantity, then reviewing potential profit before confirming. A pending-match screen and a numbered order summary follow, each showing exact profit and price.
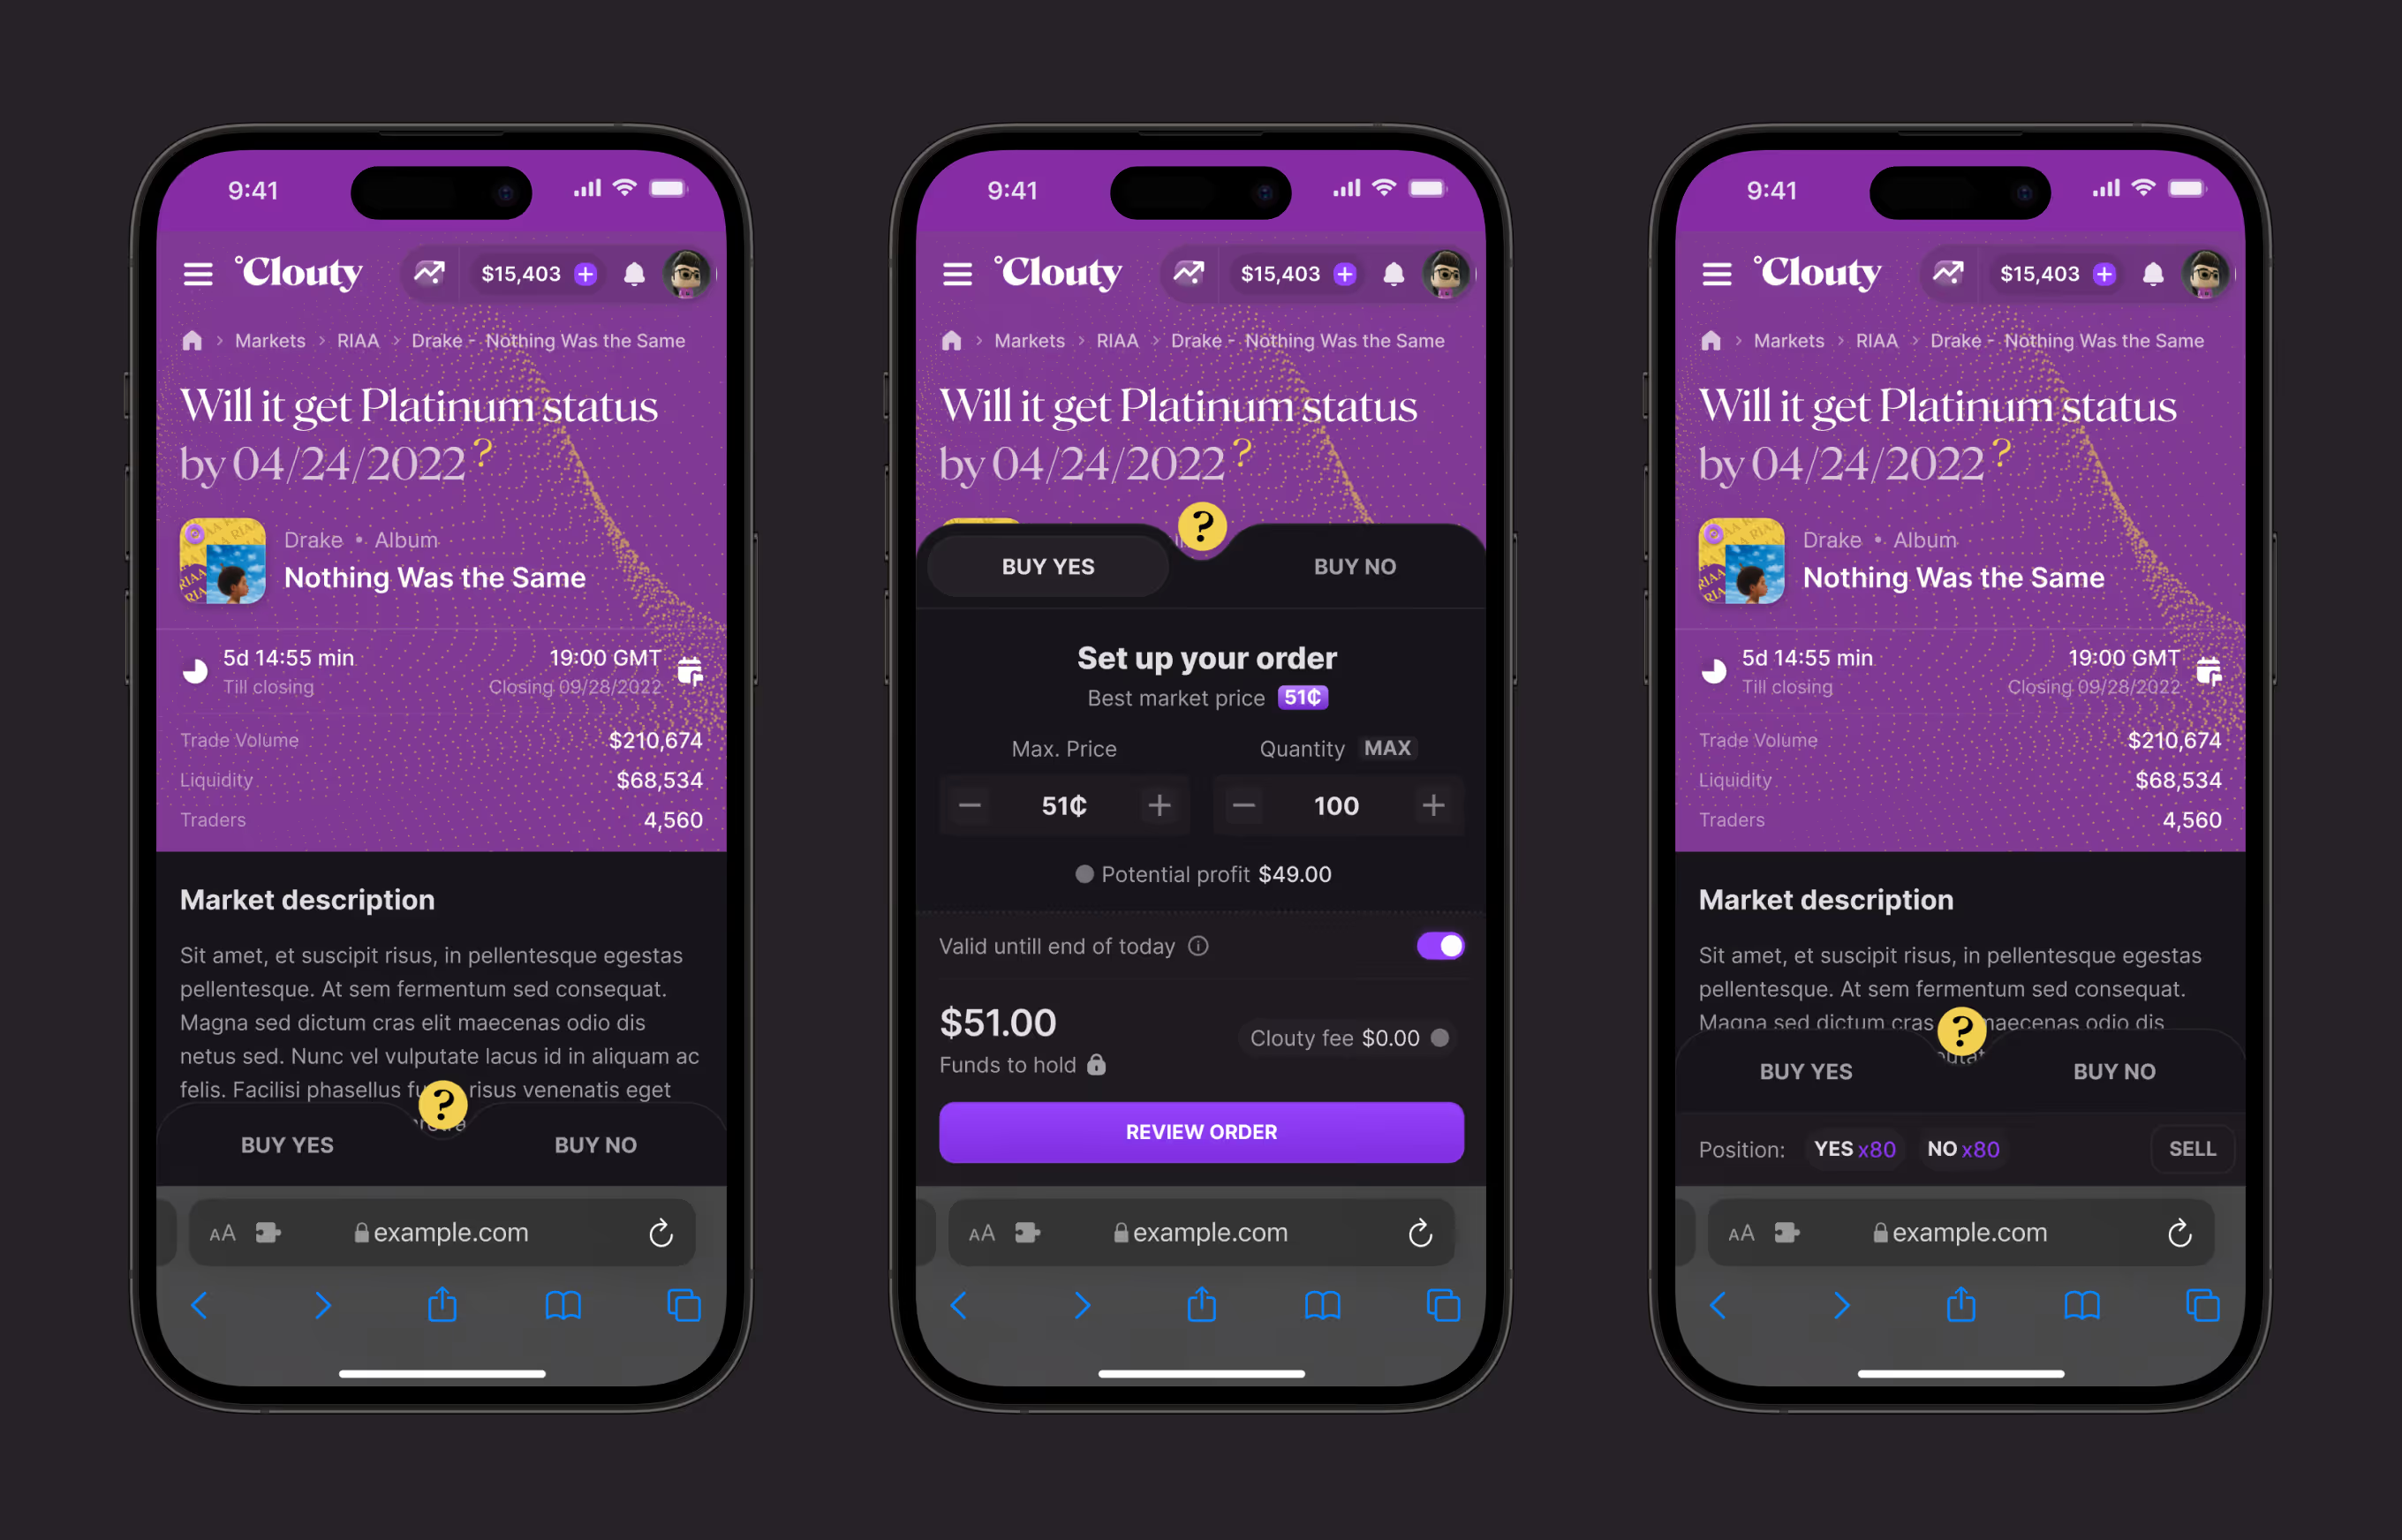
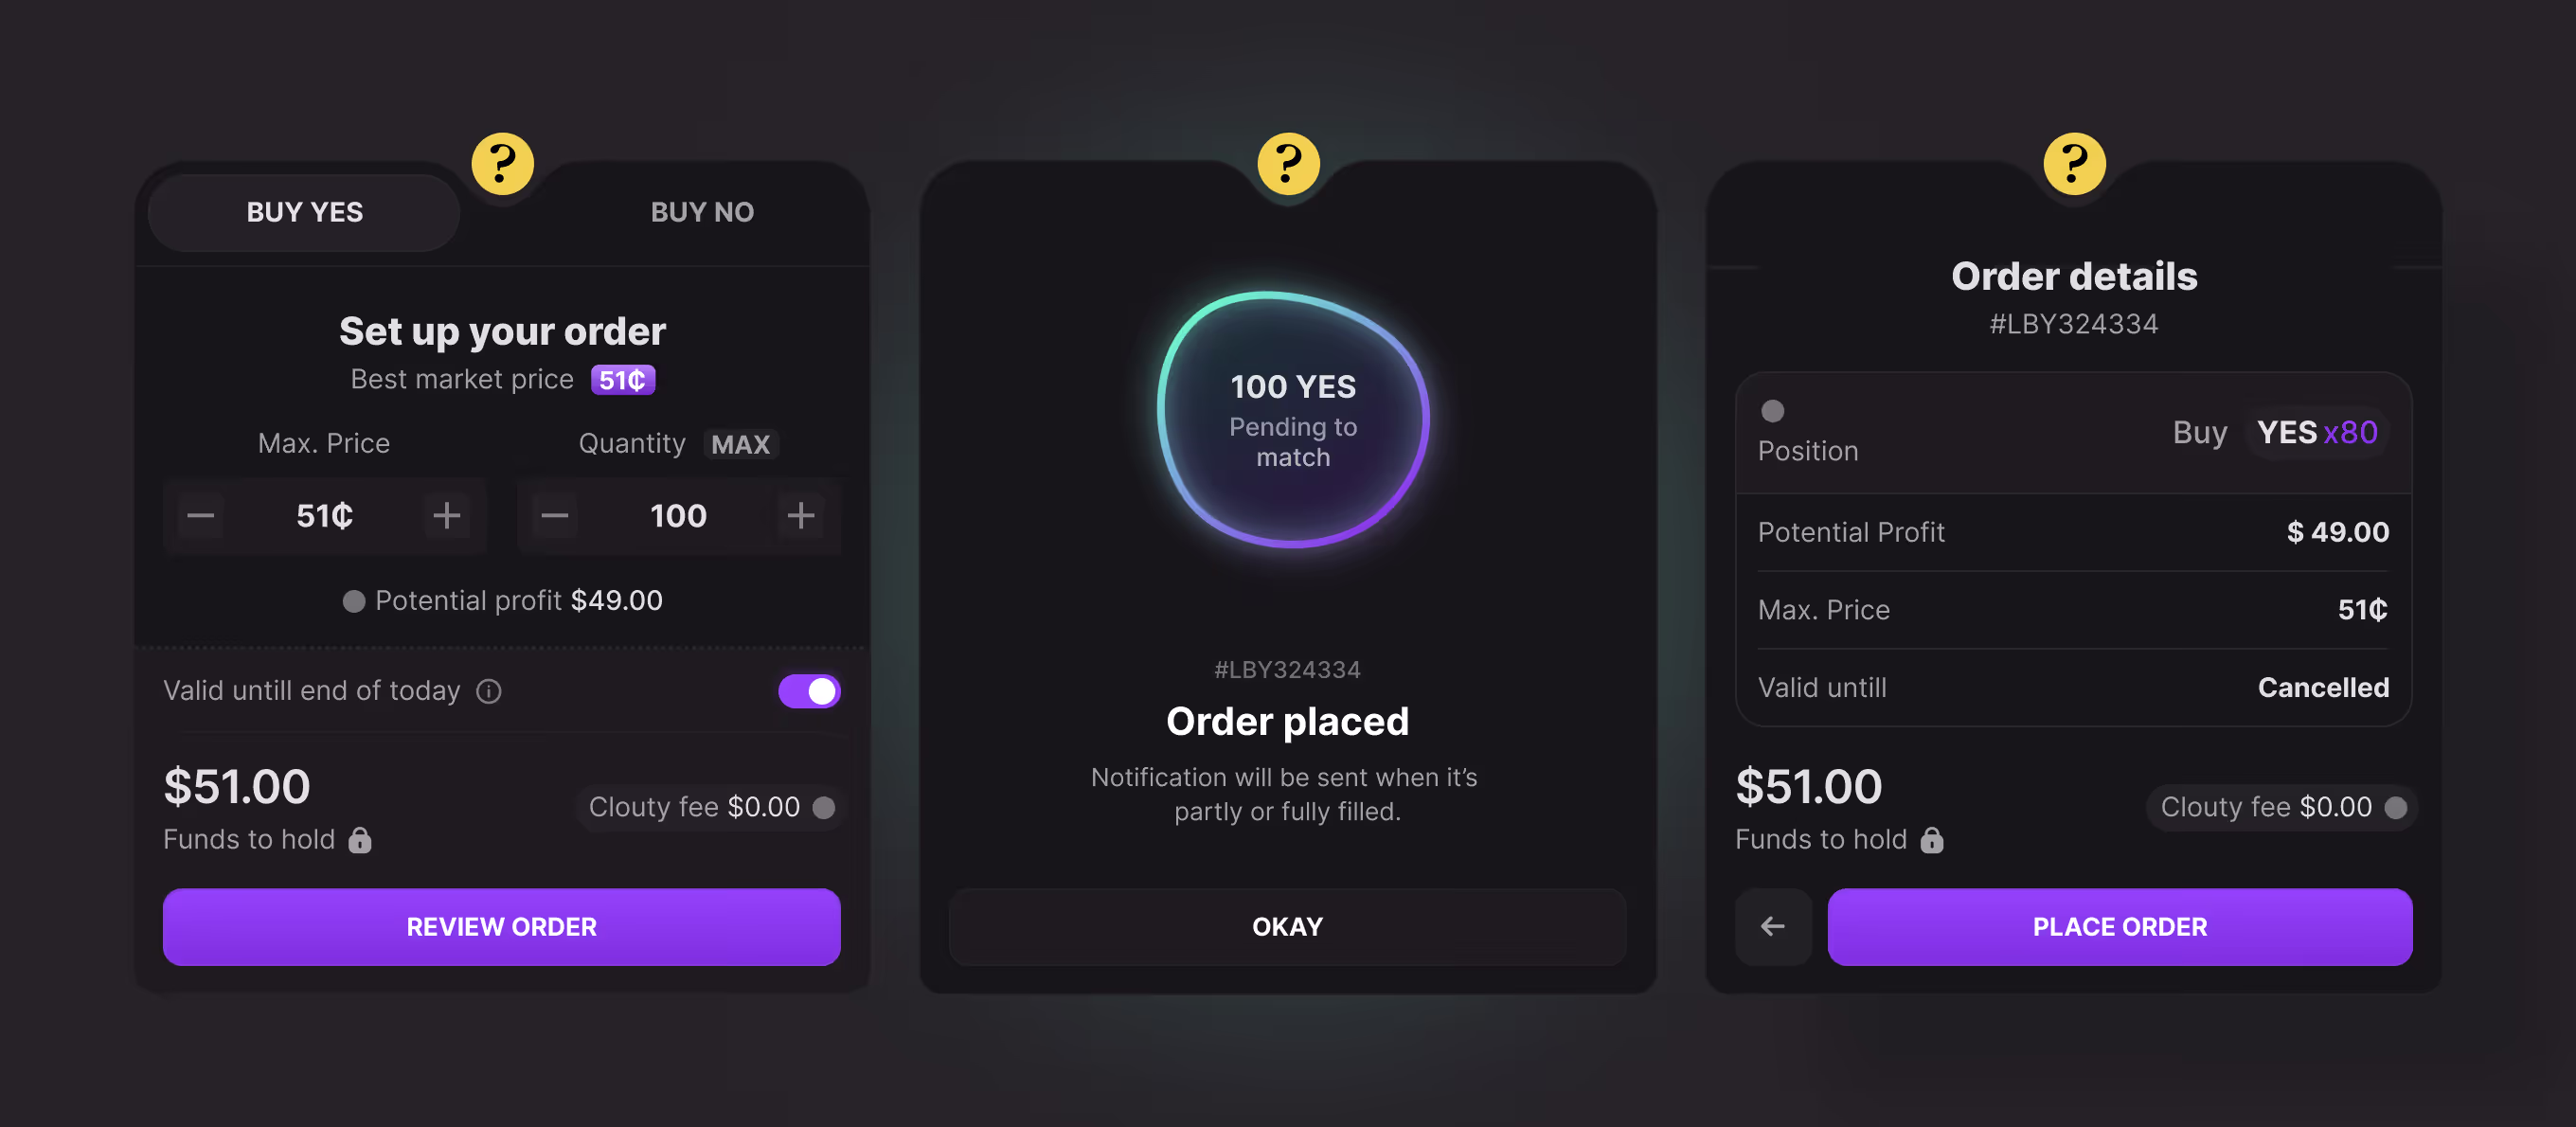
Mobile order flow with tooltip callouts on Buy Yes/No, order setup, and an open position
Mobile order flow showing order setup, pending match, and order details with potential profit

Artist Profile Linking Stats to Markets

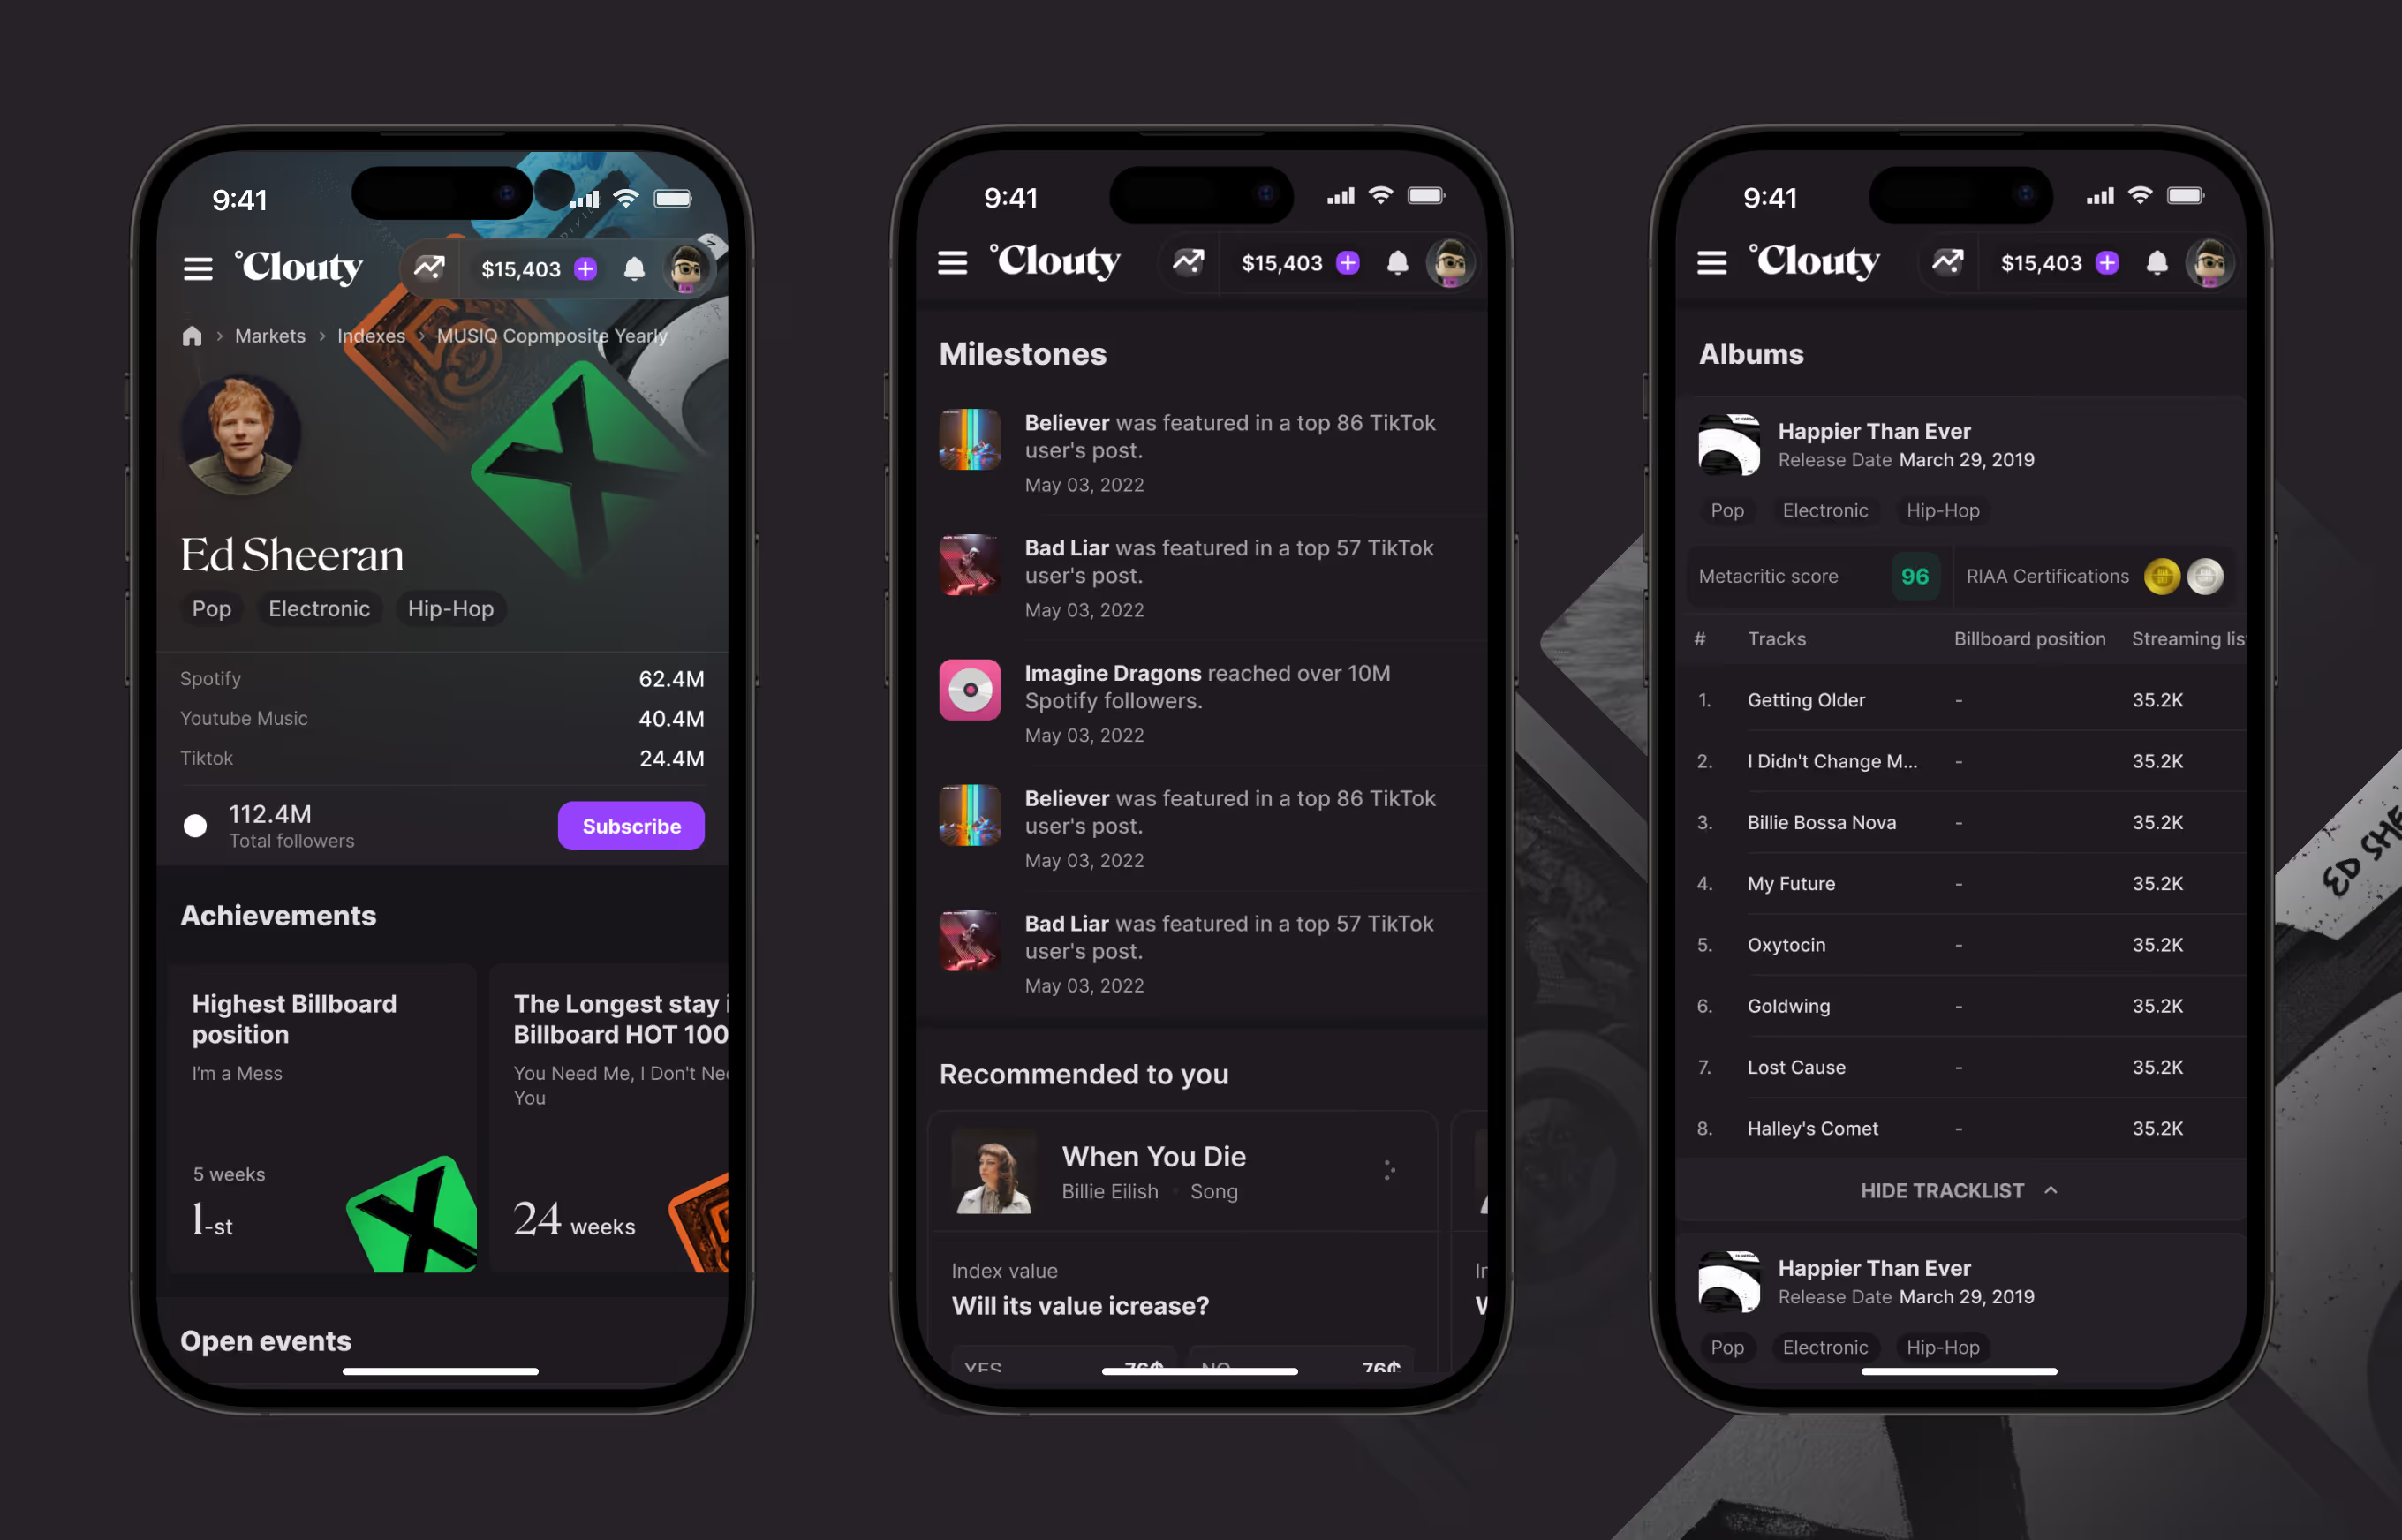
Each artist page pulls Spotify, YouTube Music, and TikTok stats into one profile, alongside career-best Achievements and a Milestones feed. Open events tied to that artist's tracks sit directly below, so context and trading stay on one screen.
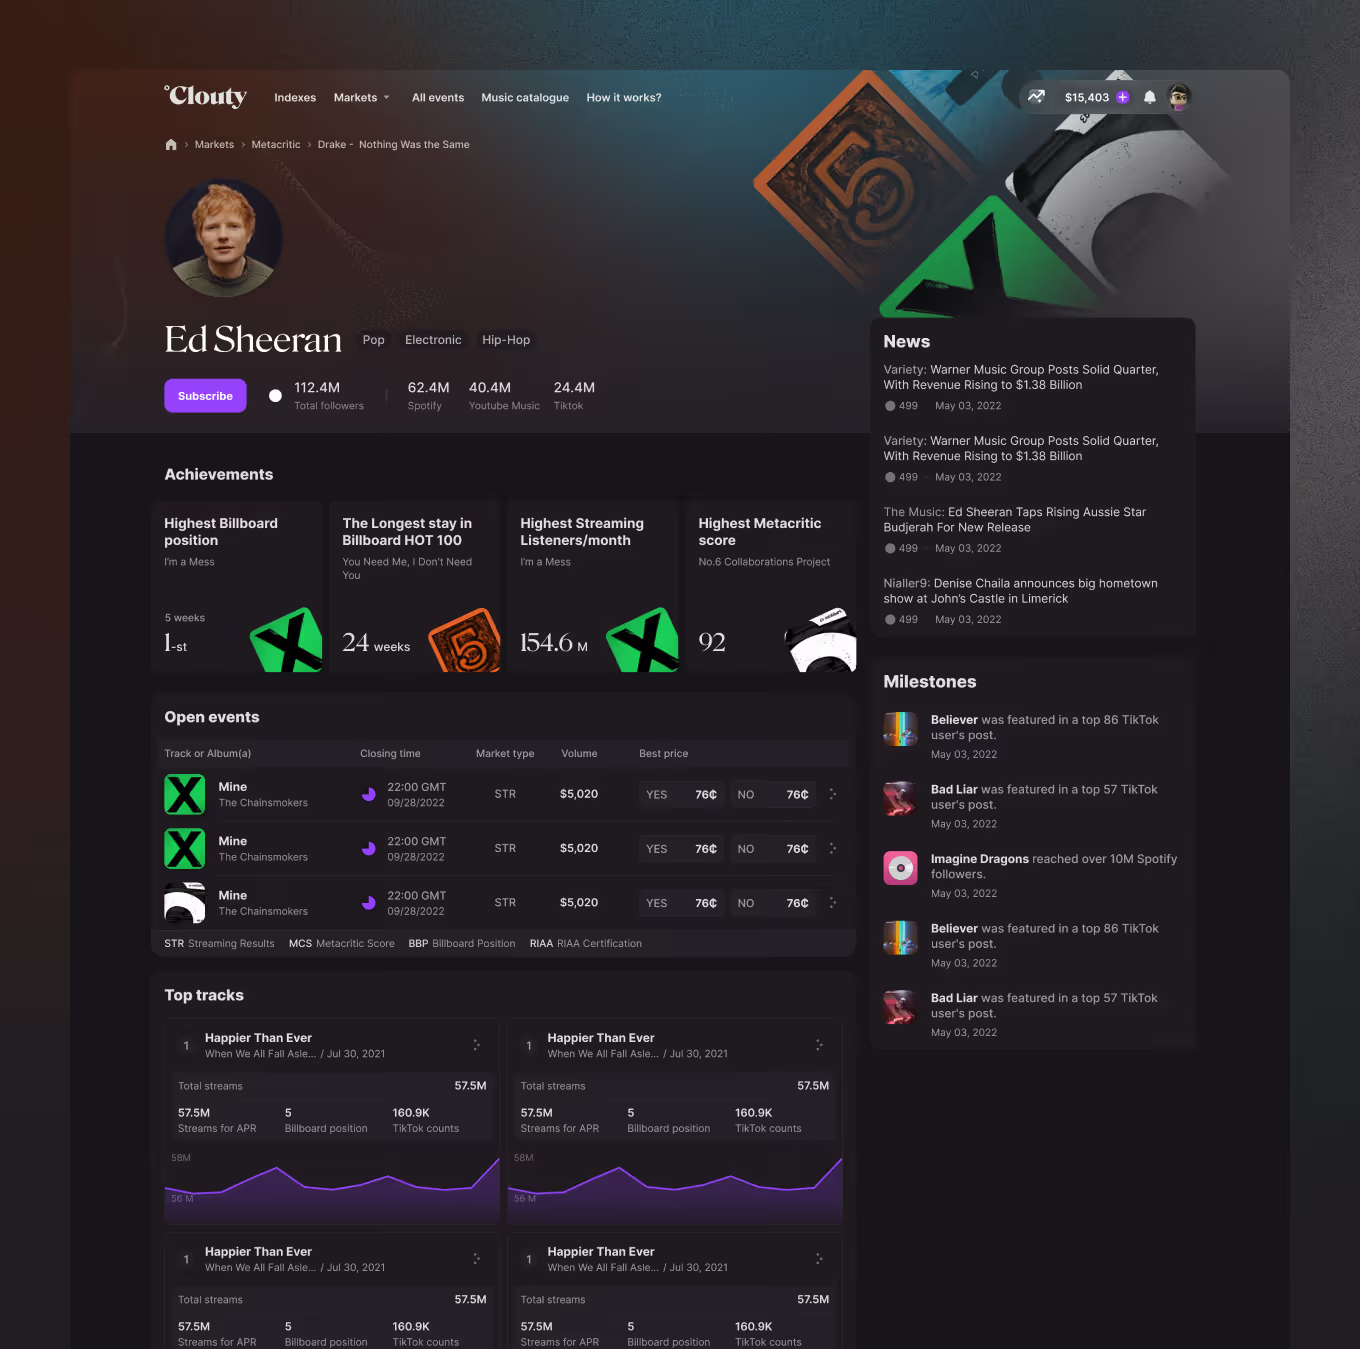
Desktop artist profile page showing achievements, open events, top tracks, and milestones feed
Mobile artist profile with achievements, milestones feed, and album tracklist with certifications
Track Detail Pages With Certification Events

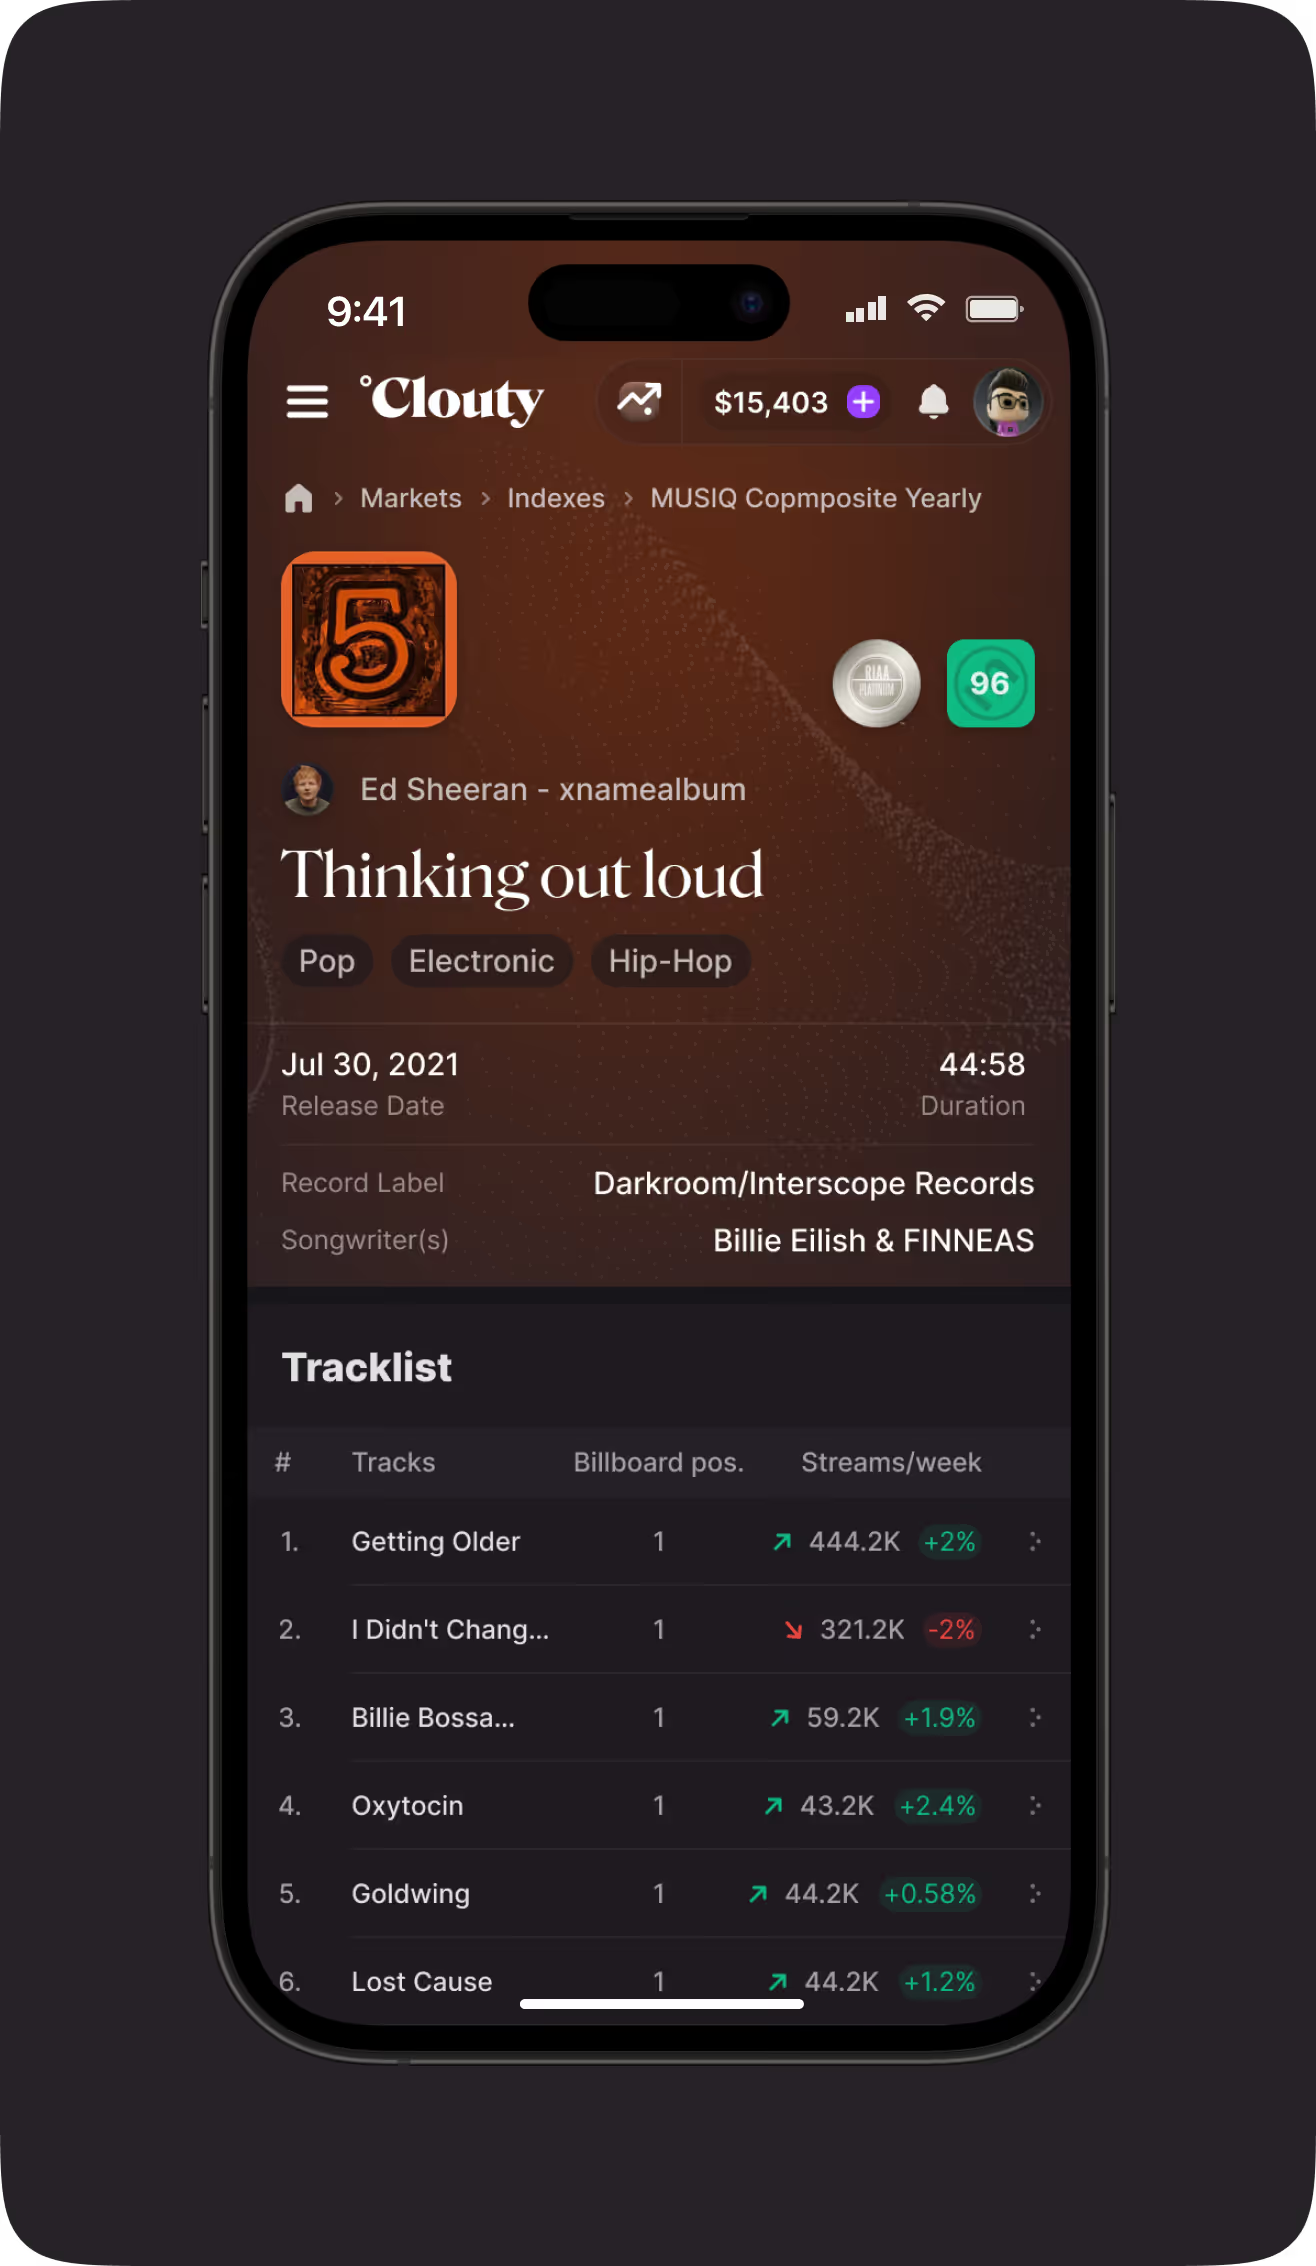
An album page lists every track's Billboard position and weekly stream trend, credits, and release details in one view. Individual tracks link to Metacritic and RIAA certification events, each showing score spread or sales against the threshold.
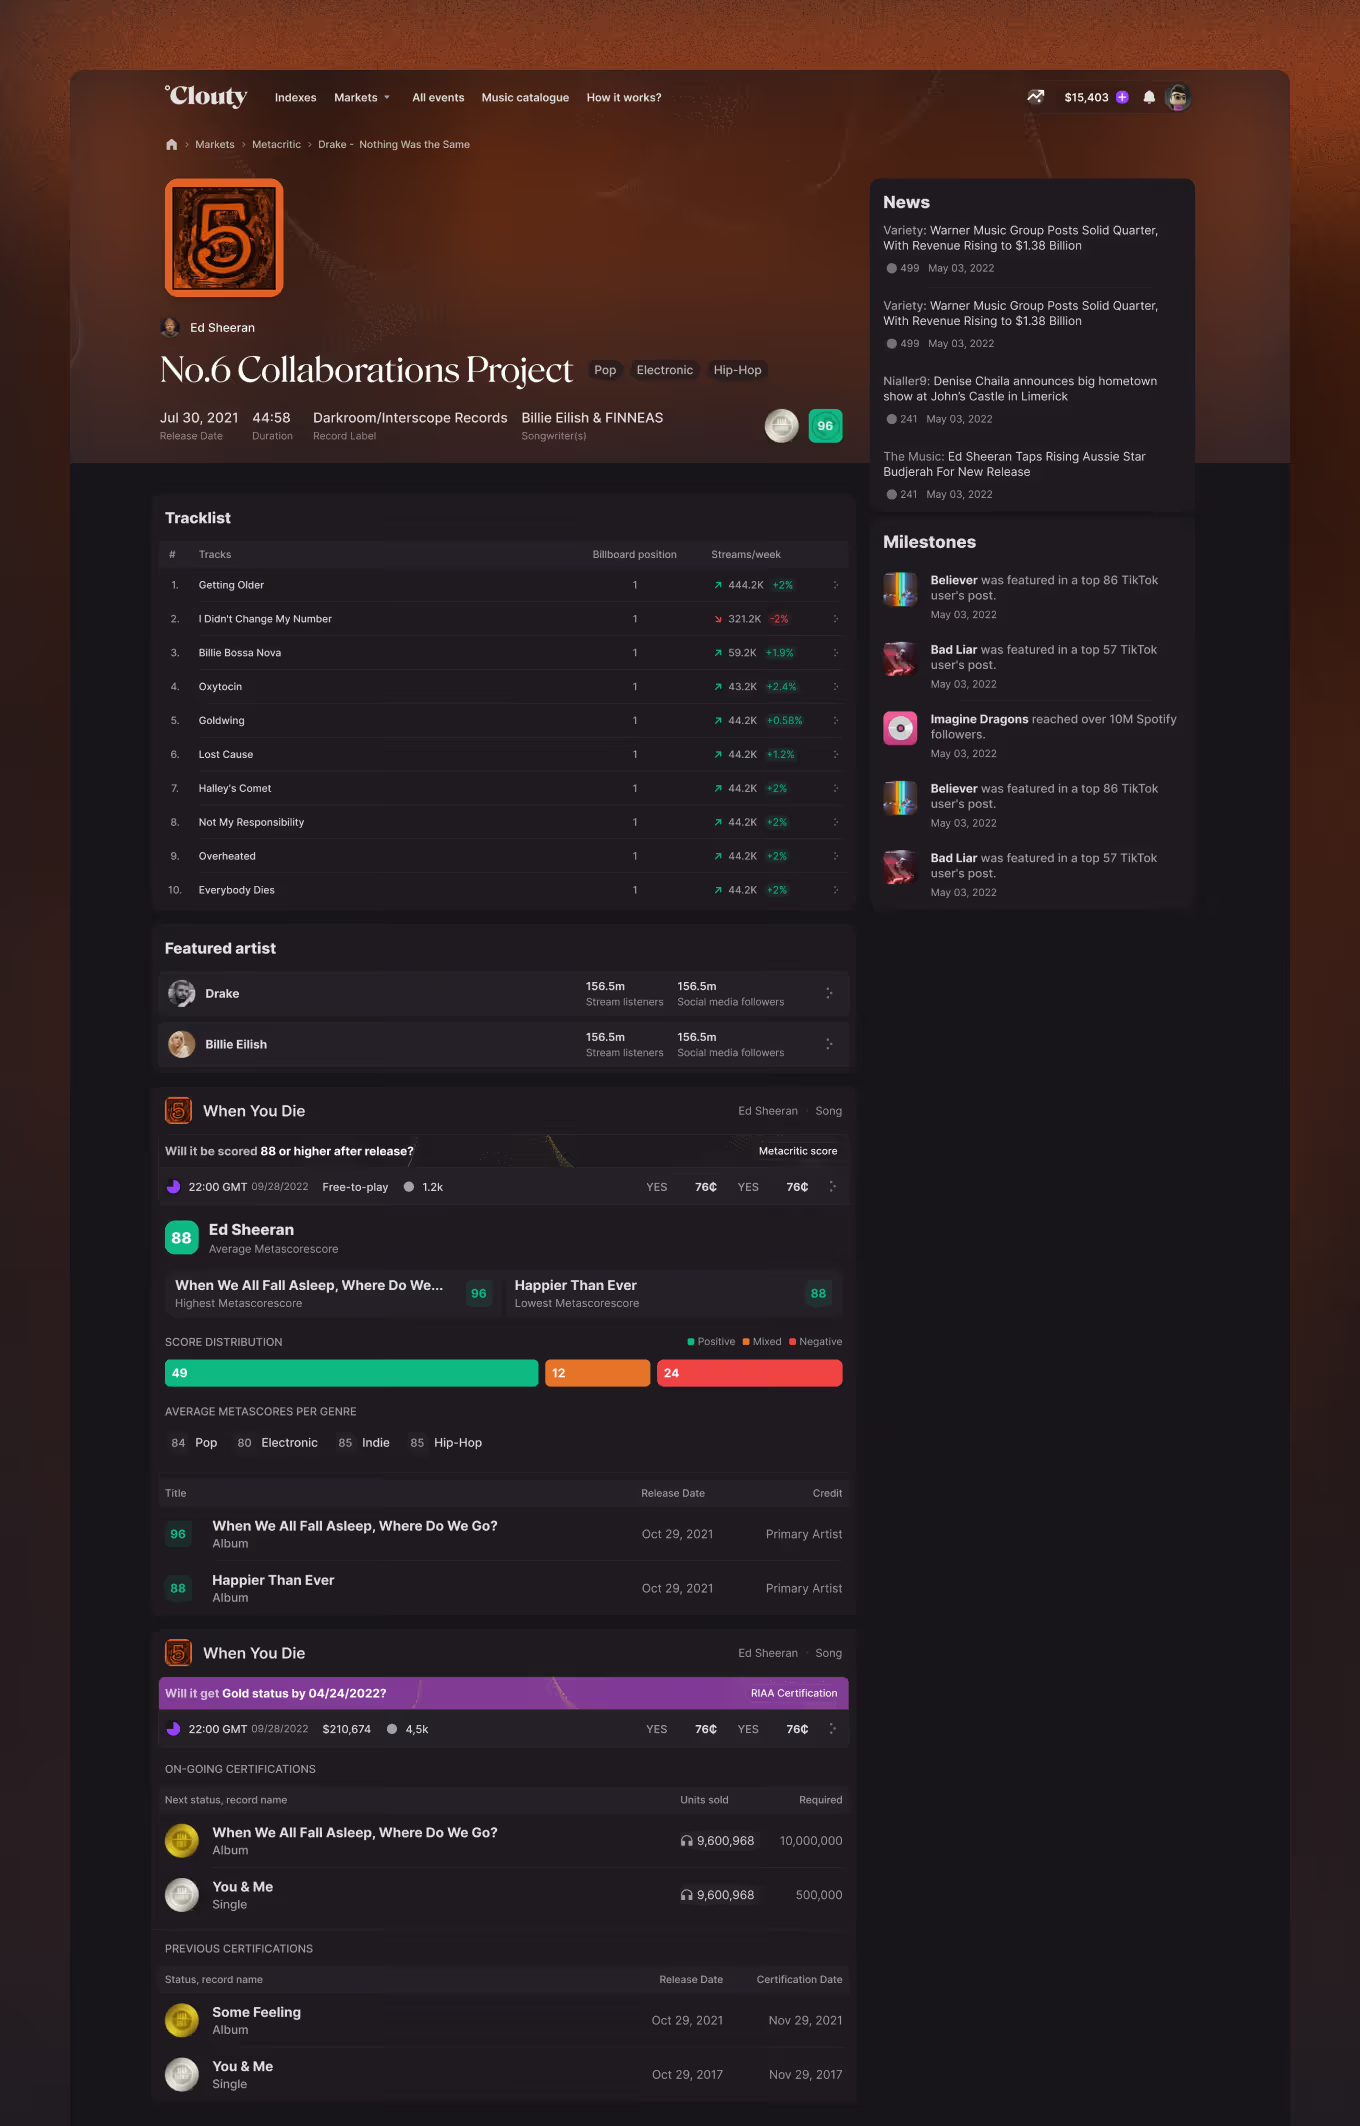
Desktop album page showing tracklist, featured artists, Metacritic score, and RIAA certification events
Mobile album page showing release details, credits, and tracklist with streaming trend
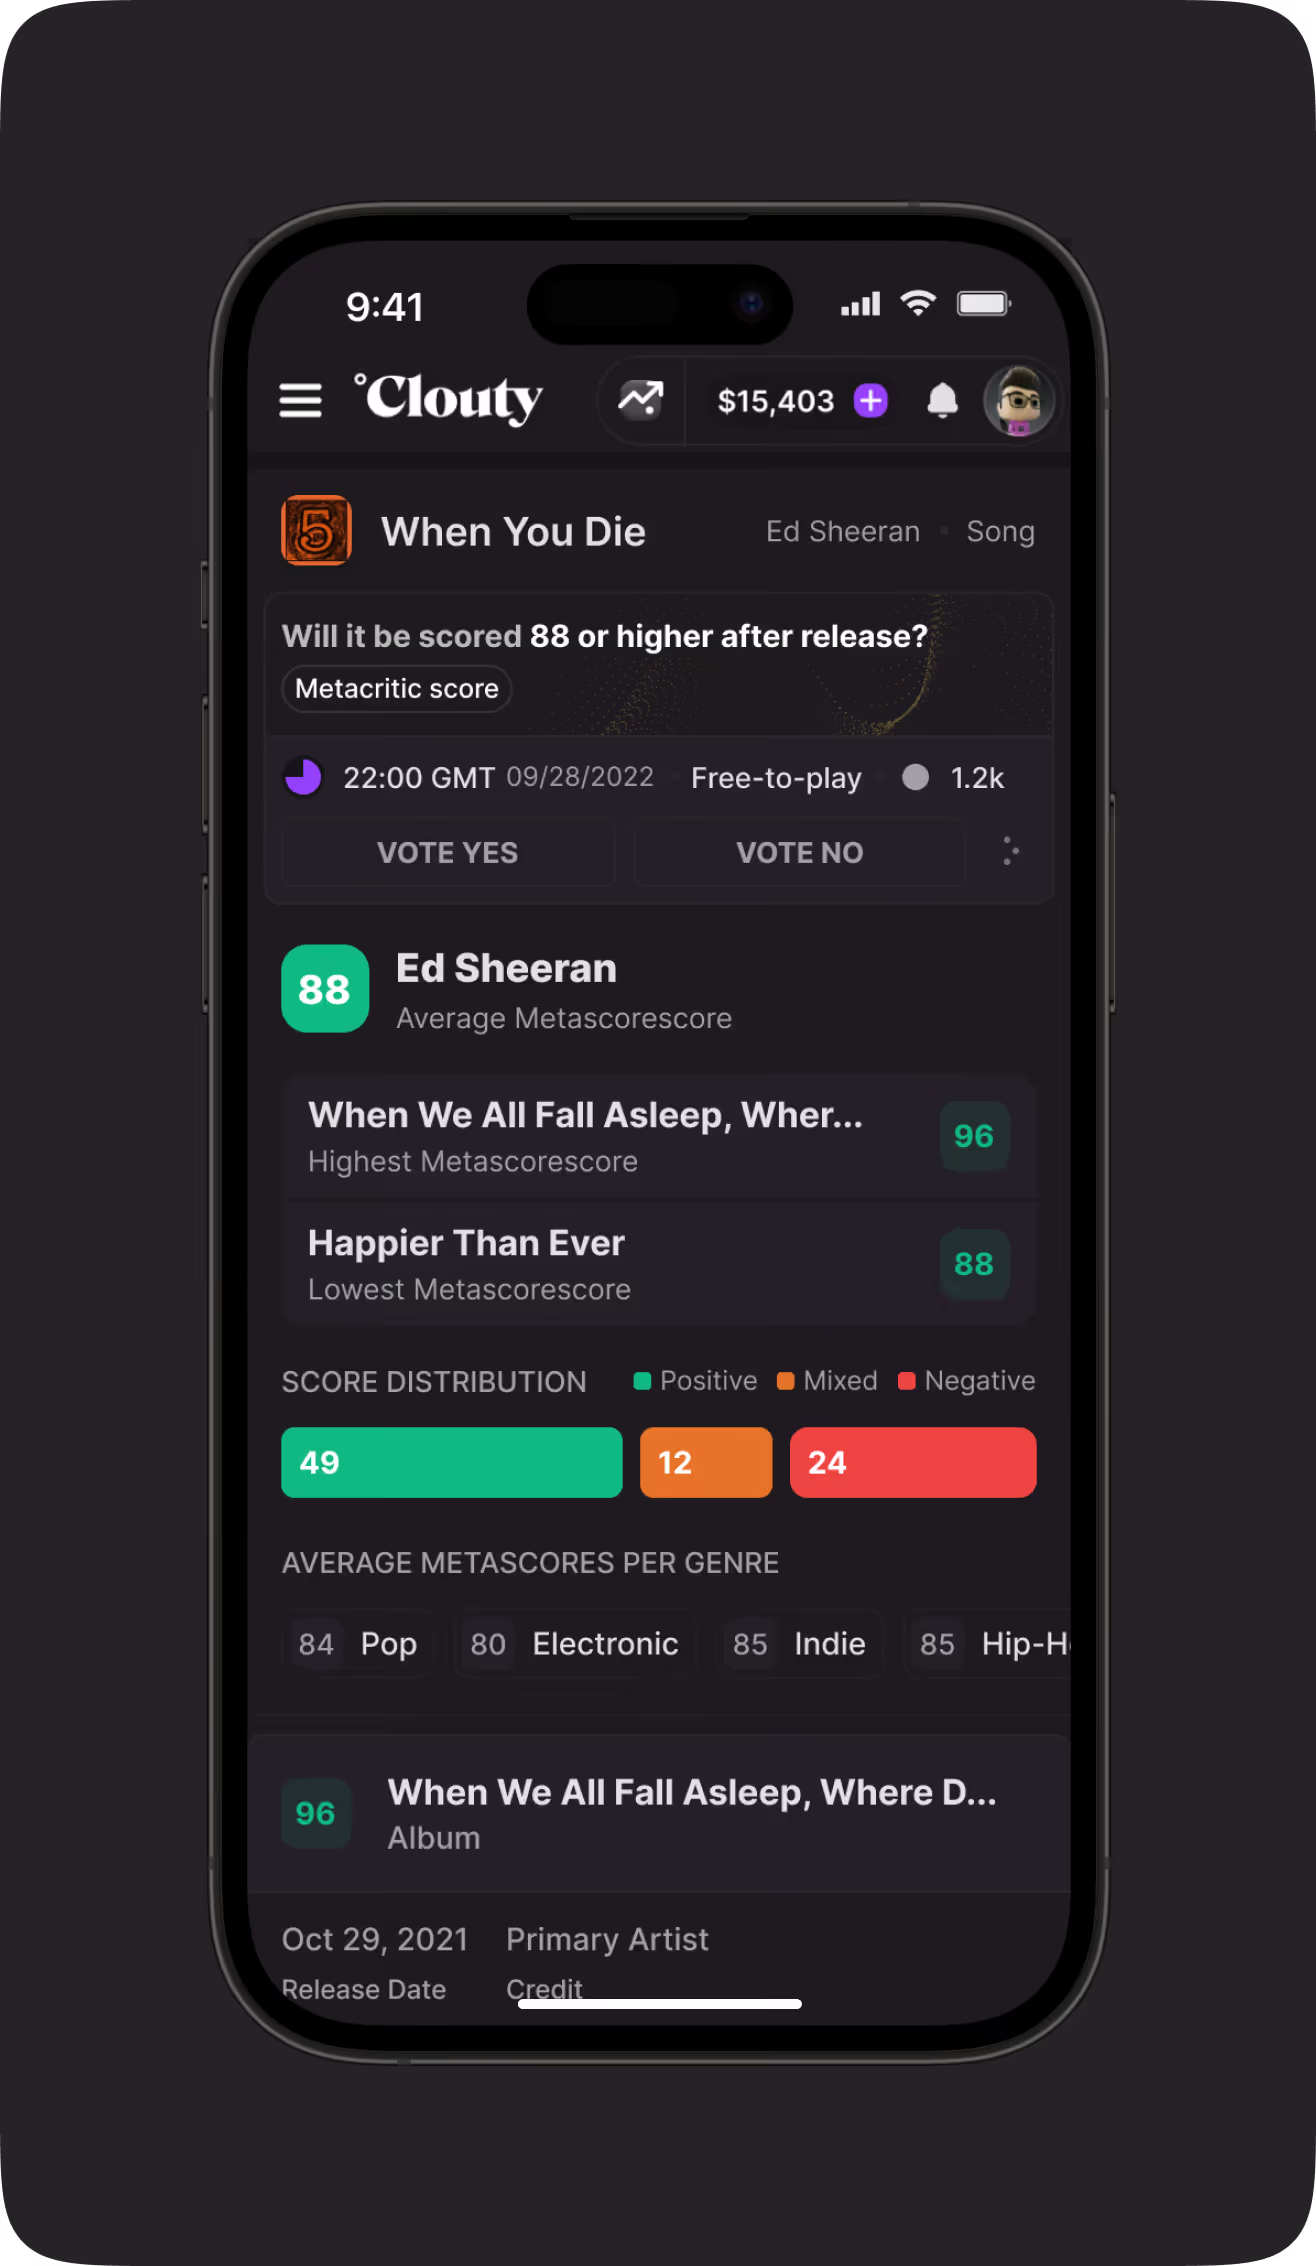
Mobile Metacritic score event showing score distribution and genre averages for a track
Streaming Trend History for Each Track

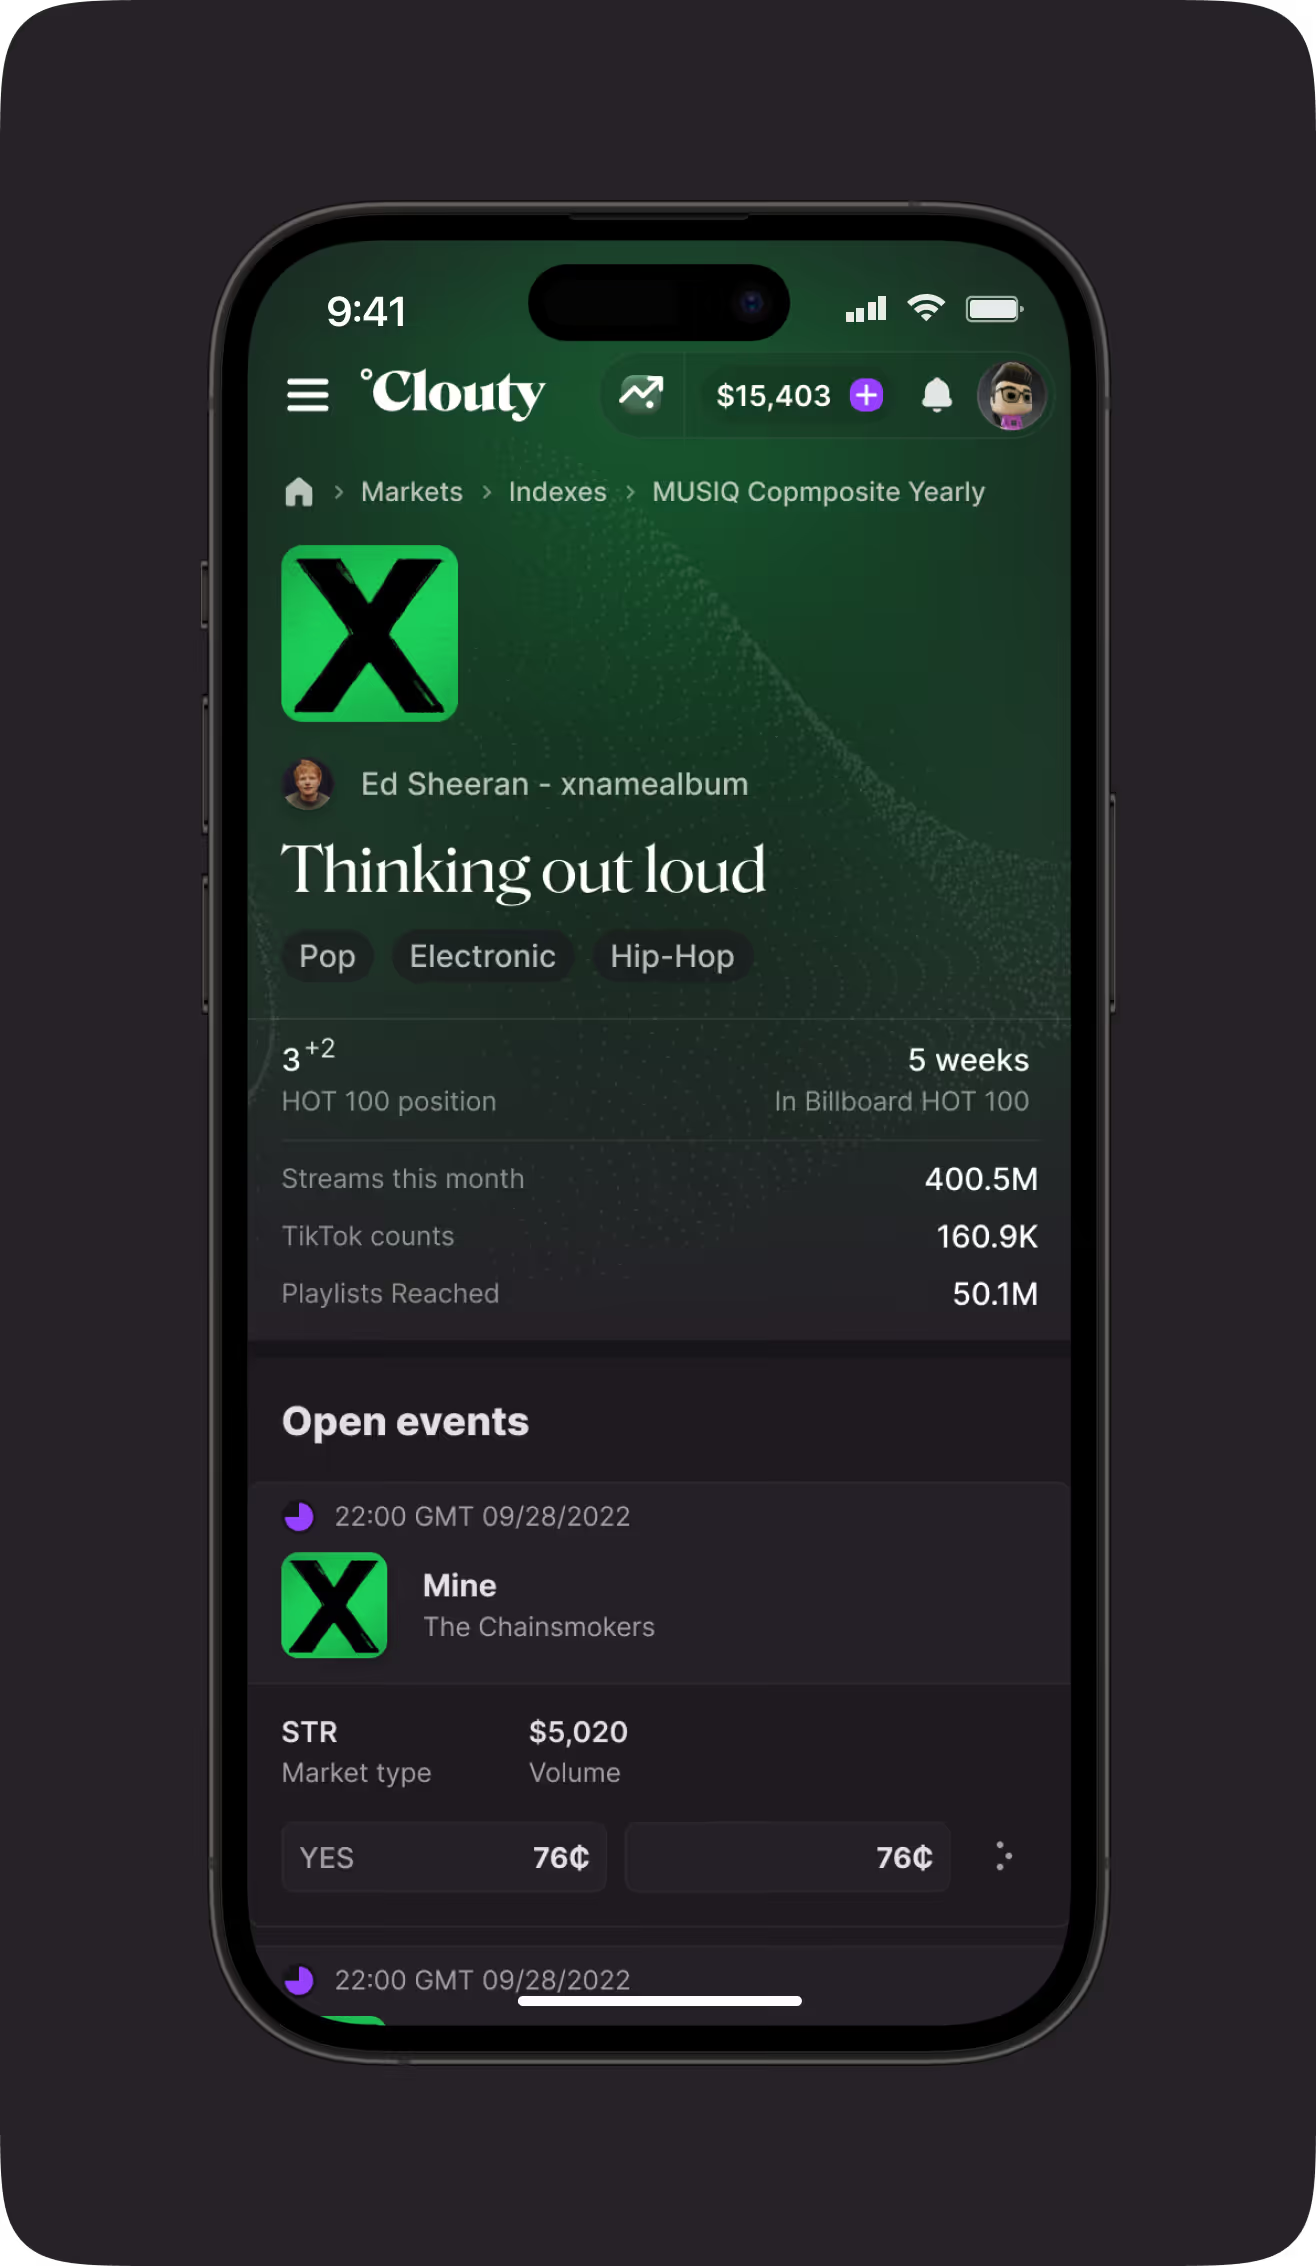
Each track page pairs core stats like Hot 100 position and streams with two trend charts tracking Billboard rank and streaming activity over time. The same page links back to that track's open events.
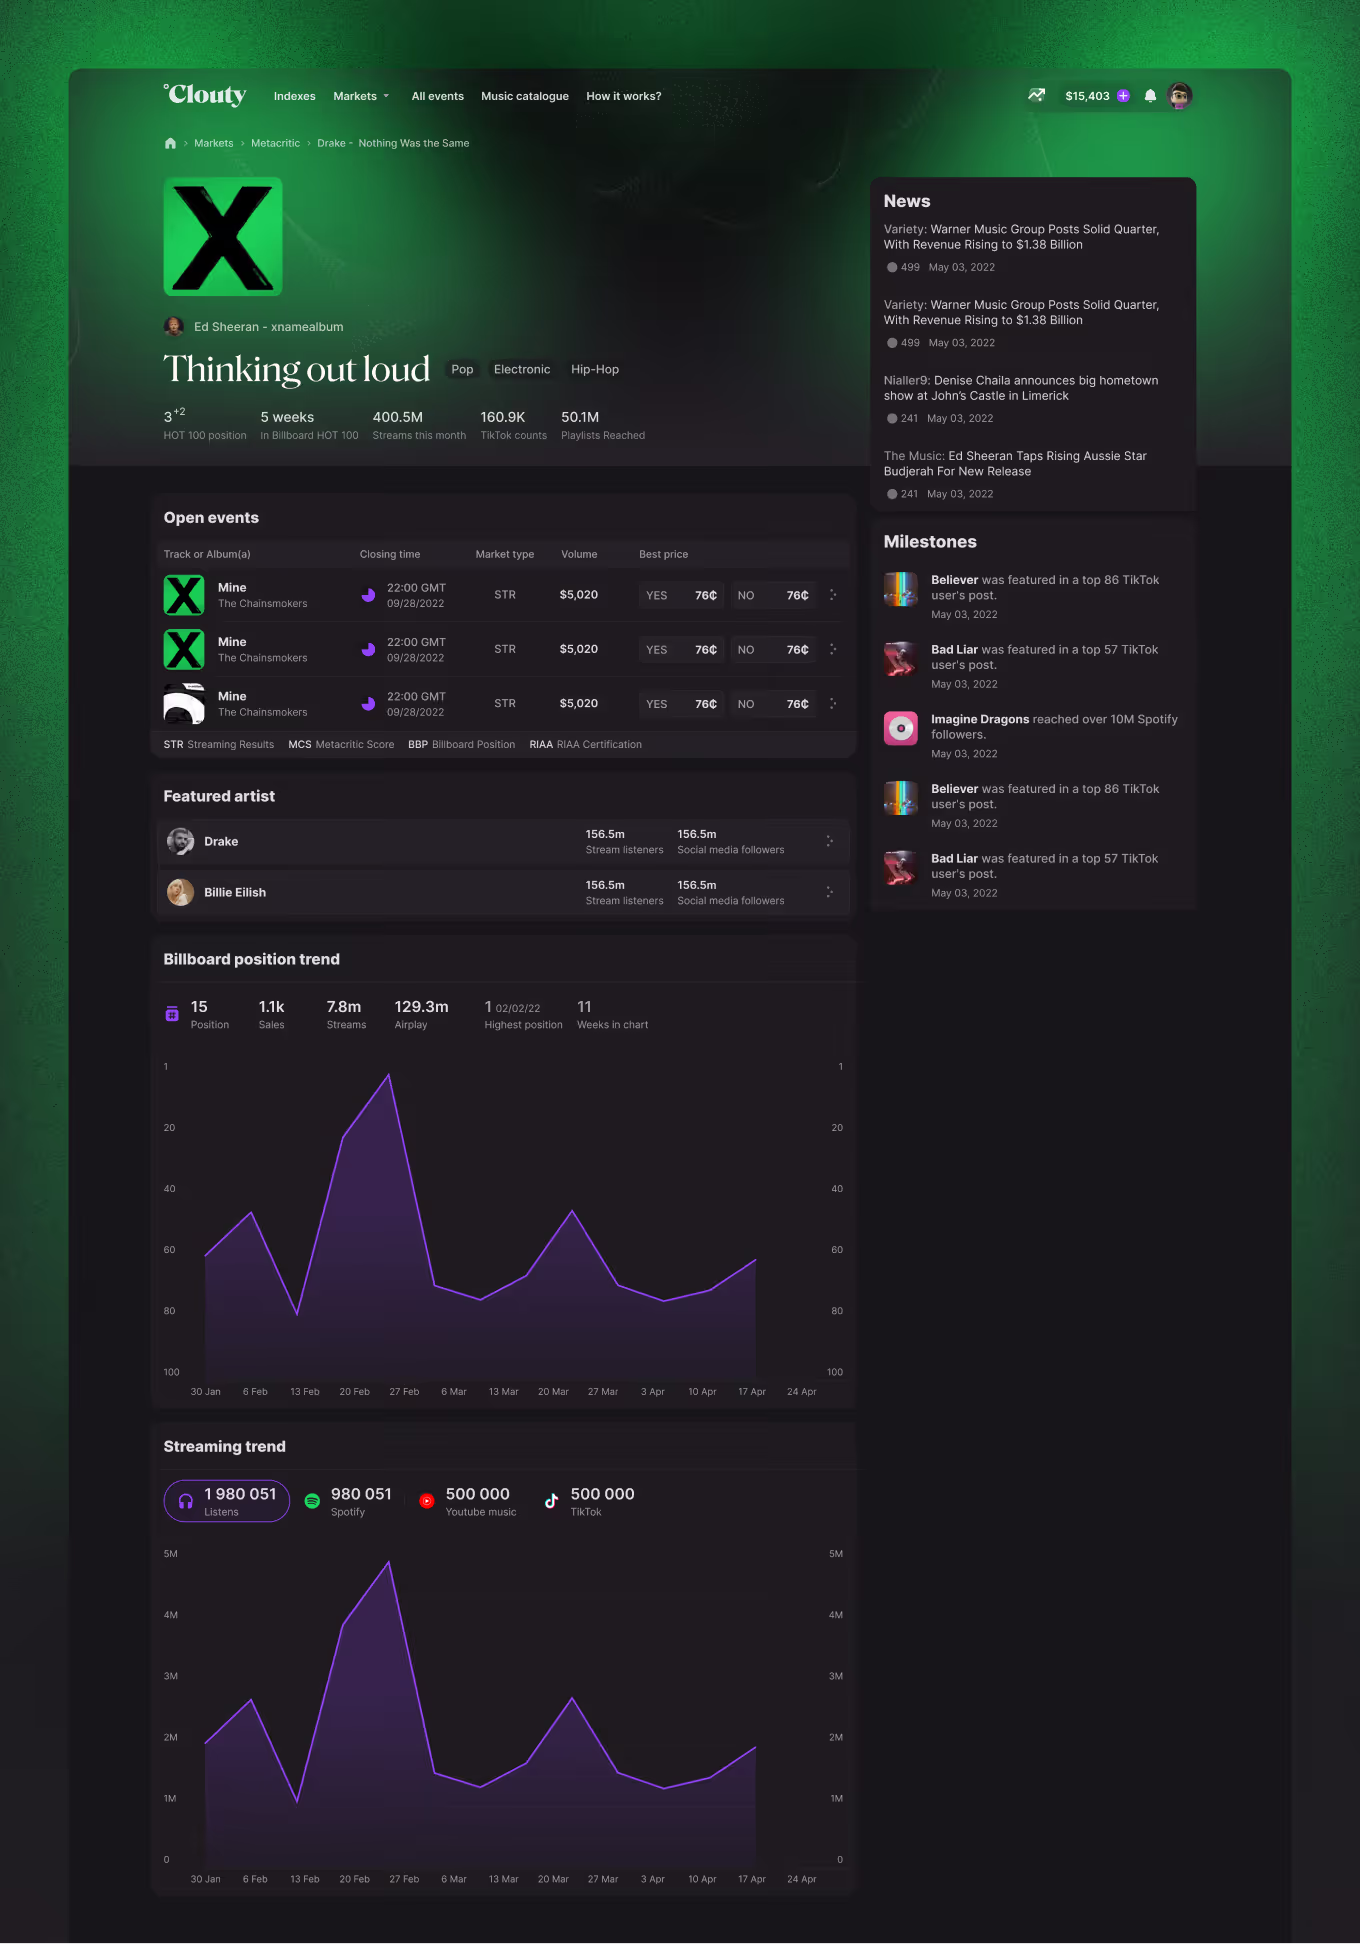
Track detail page with Billboard position and streaming trend charts over time
Mobile track detail page showing Hot 100 position, streaming stats, and an open market event
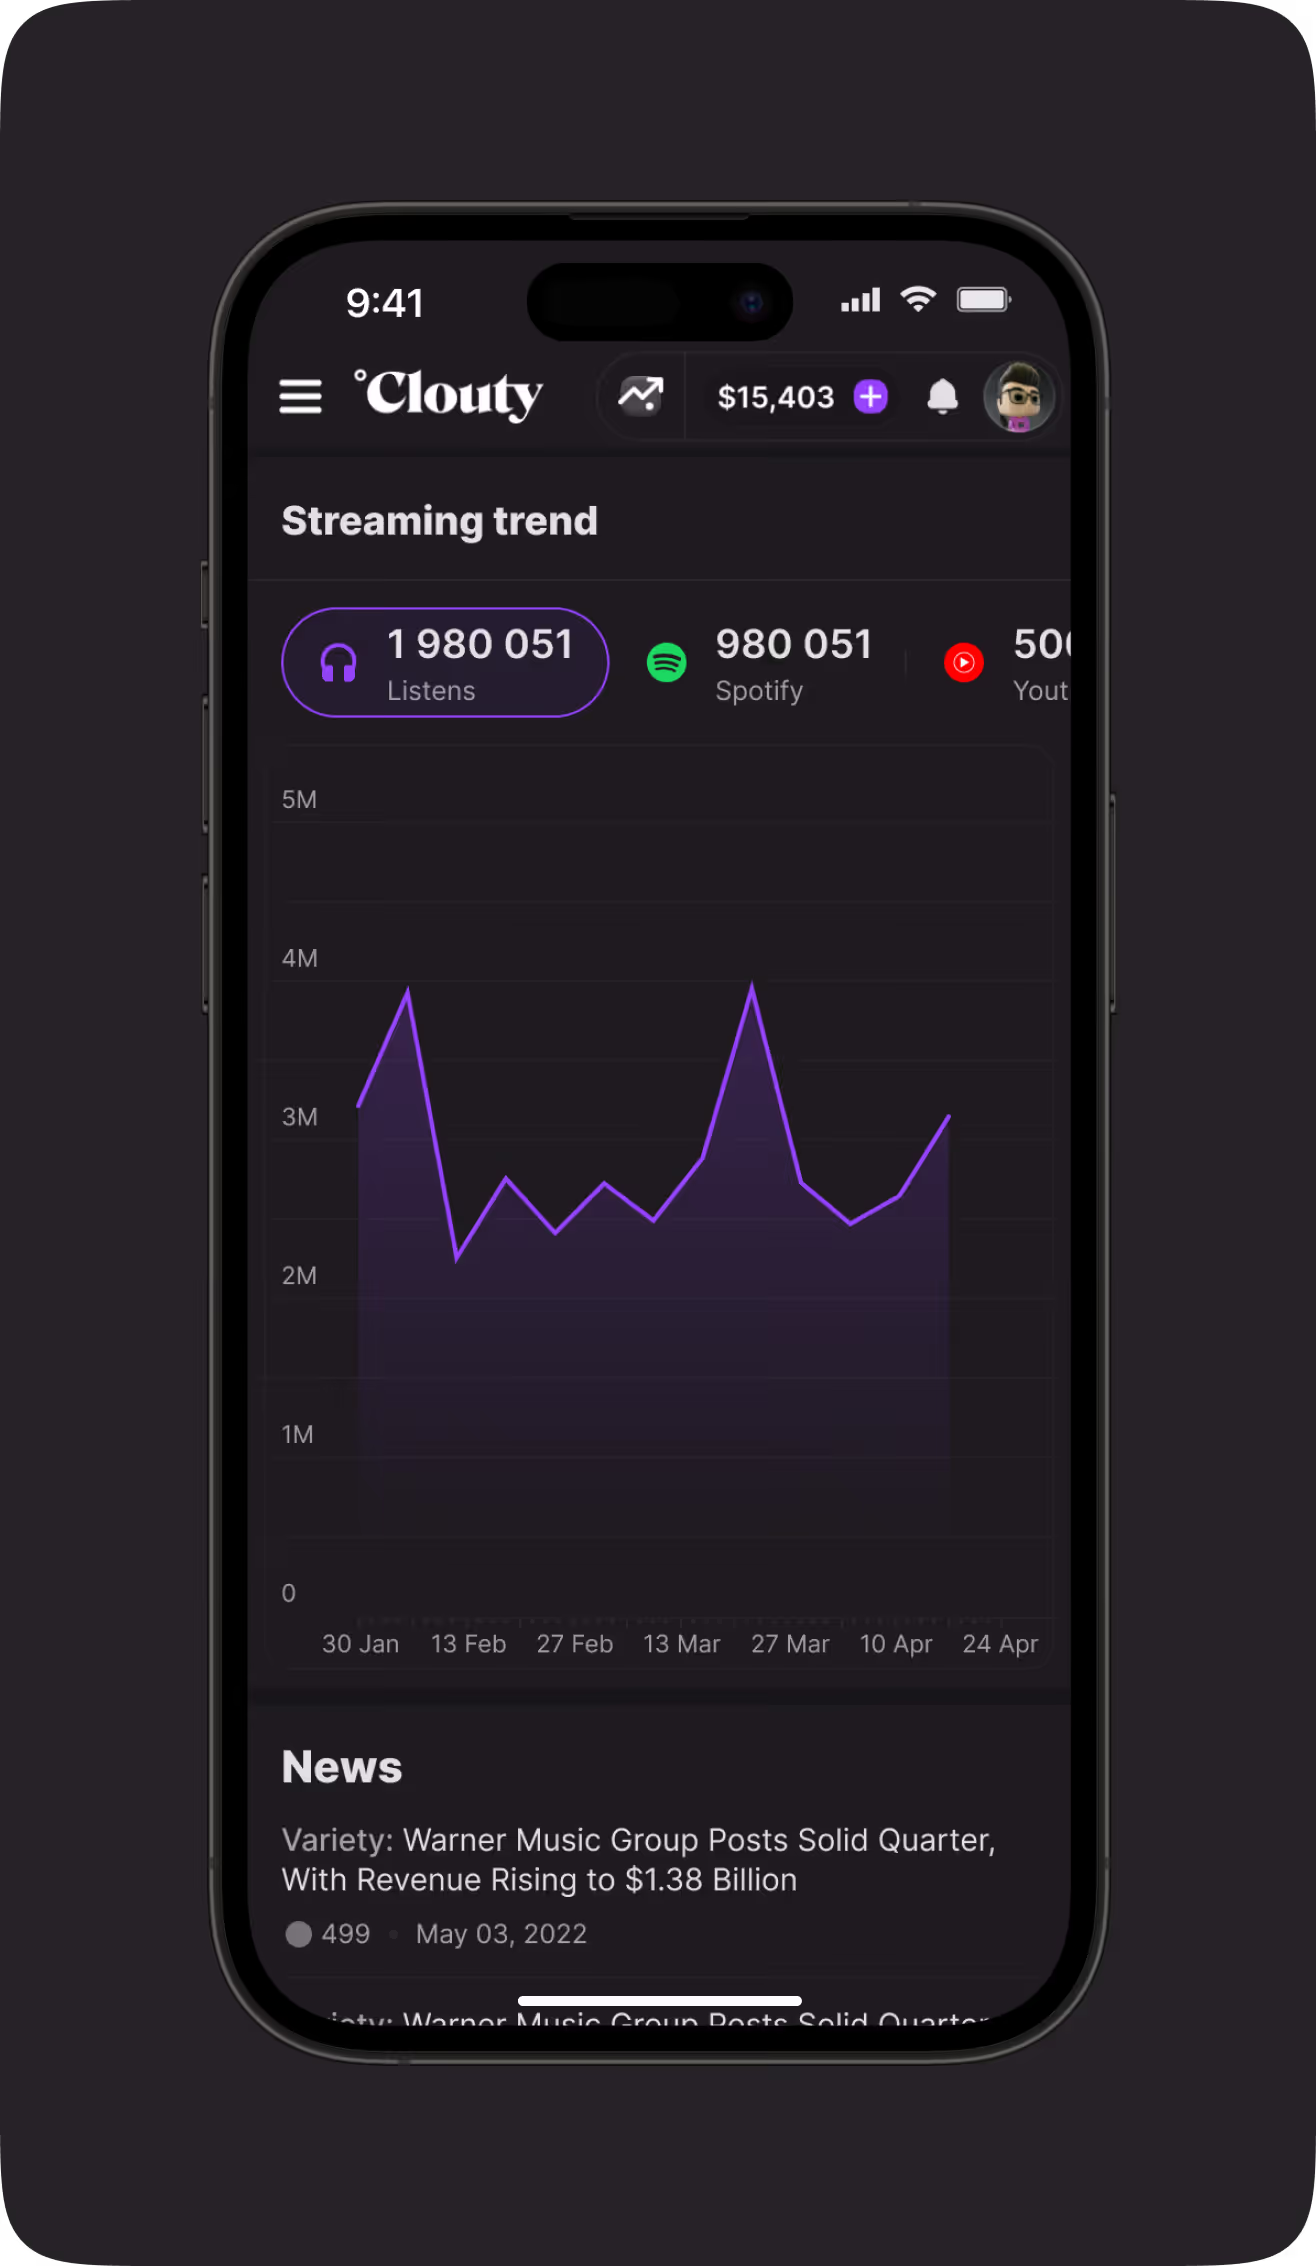
Mobile streaming trend chart comparing listens, Spotify, and other platform counts over time

Have an idea that currently fits on one line and needs to look investable in four weeks? Turning that chaos into a clickable product is our entry-point engagement.

Send us the line.

Ready to start your own project?